

Key Insights
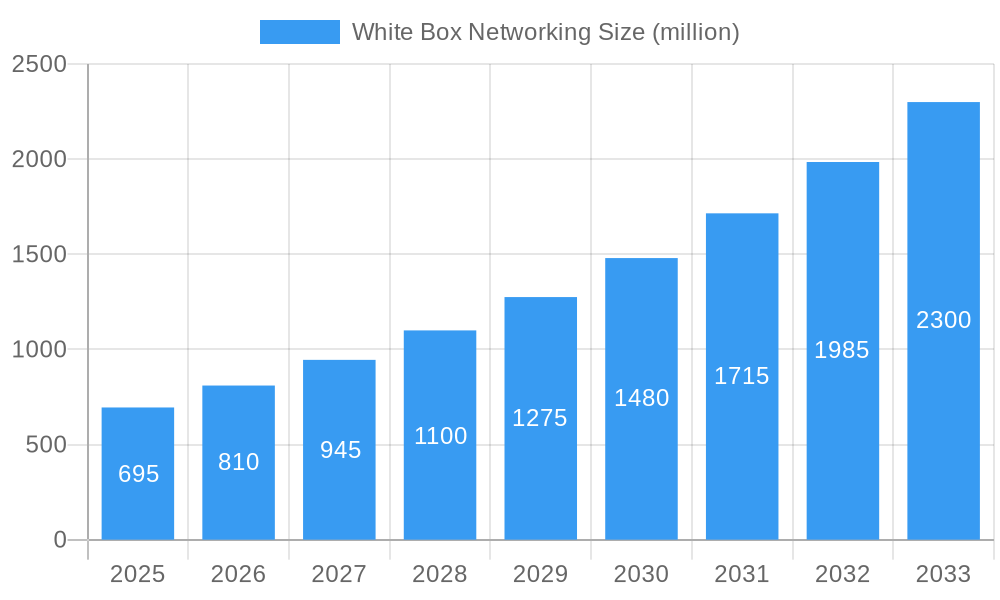
The white box networking market is experiencing robust growth, projected to reach $695 million in 2025 and exhibiting a Compound Annual Growth Rate (CAGR) of 16.9% from 2025 to 2033. This expansion is fueled by several key factors. Firstly, the increasing demand for cost-effective and flexible networking solutions within data centers and enterprise networks is driving adoption. White box solutions offer significant price advantages compared to traditional vendor-locked hardware, allowing businesses to optimize their IT budgets. Secondly, the growing adoption of software-defined networking (SDN) and network function virtualization (NFV) technologies creates a synergistic environment for white box deployments. These technologies rely on flexible, programmable hardware, a core characteristic of white box networking. Finally, the rise of hyperscale data centers, which prioritize operational efficiency and scalability, significantly contributes to the market's momentum. These large-scale deployments necessitate cost-effective and customizable solutions, making white box networking an attractive option.
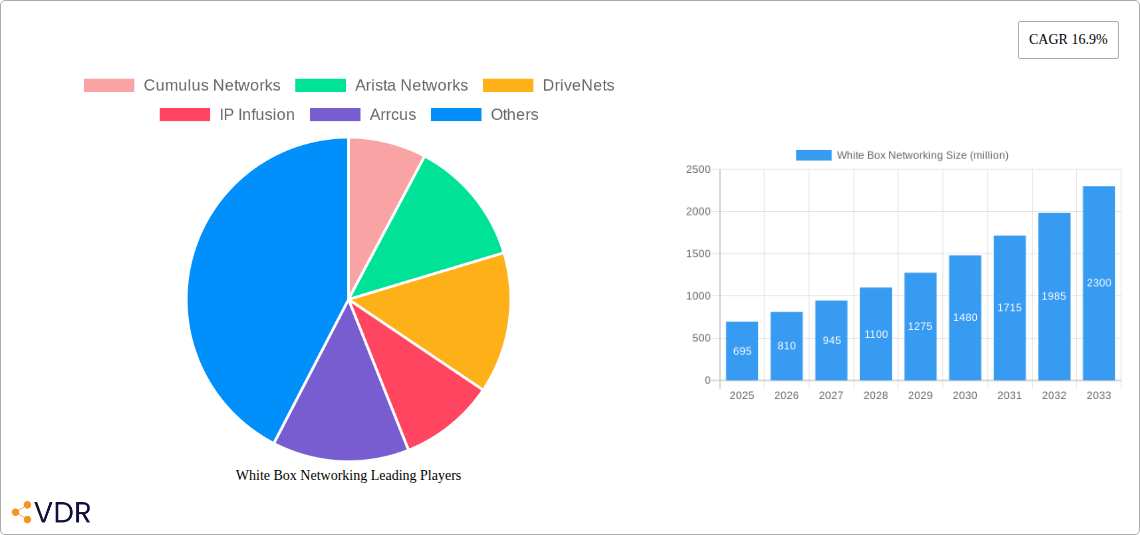
White Box Networking Market Size (In Million)
However, the market also faces some challenges. The complexity of integrating and managing white box solutions can be a barrier for some organizations lacking the necessary expertise. Furthermore, ensuring the long-term support and maintenance of white box deployments can be more involved than with traditional vendor-supported hardware. Despite these challenges, the cost savings, flexibility, and adaptability offered by white box networking are expected to outweigh the hurdles, resulting in sustained market expansion. The competitive landscape includes key players like Cumulus Networks, Arista Networks, DriveNets, IP Infusion, Arrcus, Pica8, SnapRoute, and Kaloom, each contributing to the innovation and evolution of this dynamic market segment. The market's trajectory strongly indicates a continued upward trend driven by technological advancements and the evolving needs of modern network architectures.
White Box Networking Company Market Share
White Box Networking Market Report: 2019-2033
This comprehensive report provides an in-depth analysis of the White Box Networking market, encompassing market dynamics, growth trends, regional dominance, product landscape, key players, and future outlook. The study period covers 2019-2033, with a base year of 2025 and a forecast period of 2025-2033. The report leverages extensive research and data analysis to offer invaluable insights for industry professionals, investors, and strategic decision-makers. Key players analyzed include Cumulus Networks, Arista Networks, DriveNets, IP Infusion, Arrcus, Pica8, SnapRoute, and Kaloom.
White Box Networking Market Dynamics & Structure
The White Box Networking market is characterized by a dynamic interplay of technological innovation, evolving regulatory landscapes, and intense competition. While the market is relatively fragmented, several key players exert significant influence. Market concentration is expected to shift in the coming years due to strategic partnerships and acquisitions. The total addressable market (TAM) was estimated at $XX billion in 2024 and is projected to reach $XX billion by 2033.
- Market Concentration: Moderately fragmented, with a few dominant players commanding significant market share (Arista Networks holding approximately xx%, Cumulus Networks holding xx%, and others holding xx%).
- Technological Innovation Drivers: Software-defined networking (SDN), network function virtualization (NFV), and the increasing adoption of open-source technologies are driving market growth.
- Regulatory Frameworks: Government regulations regarding data security and network infrastructure are influencing market dynamics. Compliance requirements are creating both opportunities and challenges for vendors.
- Competitive Product Substitutes: Traditional closed-system networking solutions pose a significant competitive threat. However, the cost-effectiveness and flexibility of white box solutions are key differentiators.
- End-User Demographics: Data centers, telecommunications providers, and large enterprises are the primary end-users, with cloud providers driving substantial demand.
- M&A Trends: The last five years saw xx M&A deals in this market, with a total value of approximately $XX billion, indicating significant consolidation within the sector. This trend is expected to continue with focus on strengthening technological capabilities and expanding market reach.
White Box Networking Growth Trends & Insights
The White Box Networking market has experienced robust growth over the past few years, driven by several factors. The Compound Annual Growth Rate (CAGR) from 2019 to 2024 was approximately xx%, and this trend is projected to continue. The increasing demand for cost-effective, flexible, and scalable networking solutions, especially within data centers and cloud environments, is fueling market expansion. Technological advancements, particularly in areas like SDN and NFV, are also contributing to accelerated adoption rates. The shift towards open networking standards allows for greater vendor independence and lowers the barriers to entry for new players in the space. The market penetration rate for white box networking solutions in data centers is expected to reach xx% by 2033. Furthermore, consumer behavior shifts towards cloud-based services and the growing demand for high-bandwidth applications are driving market expansion.
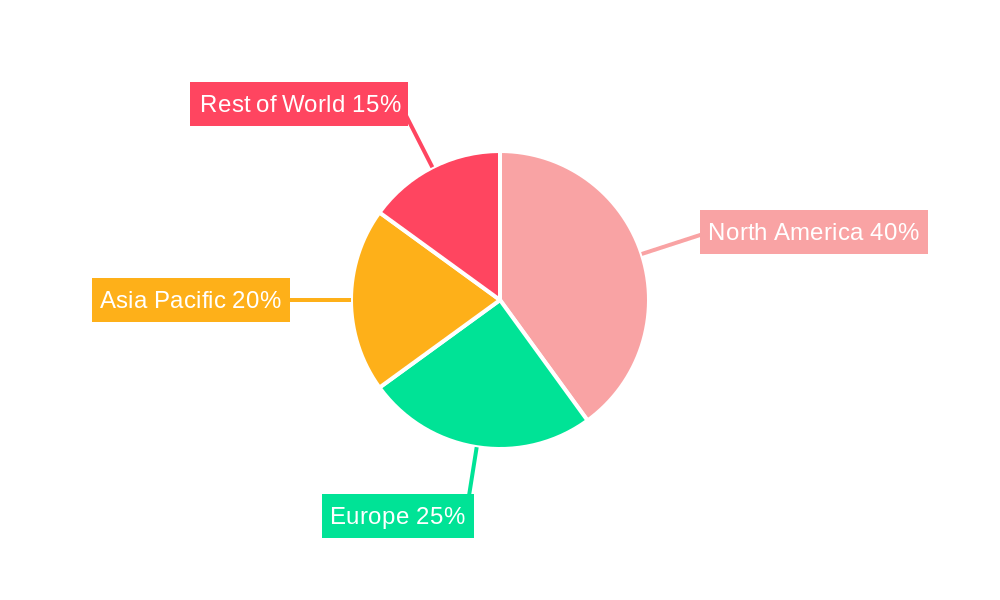
Dominant Regions, Countries, or Segments in White Box Networking
North America currently holds the largest market share due to the high concentration of data centers and cloud providers in the region. However, the Asia-Pacific region is experiencing the fastest growth rate, driven by increasing investments in digital infrastructure and expanding telecommunications networks. Europe holds a significant market share, propelled by the adoption of open networking in various industries.
- Key Drivers in North America: Strong presence of hyperscale data centers, well-established IT infrastructure, and high adoption of cloud-based services.
- Key Drivers in Asia-Pacific: Rapid economic growth, increasing government investments in digital infrastructure, and rising demand for high-speed internet access.
- Key Drivers in Europe: Government initiatives supporting digital transformation, strong presence of telecom operators, and growing adoption of SDN and NFV technologies.
White Box Networking Product Landscape
White box networking solutions encompass a range of products, including switches, routers, and network interface cards (NICs). These products are characterized by their use of open standards, flexible software configurations, and support for various network protocols. Key features driving adoption include cost-effectiveness compared to proprietary solutions, increased flexibility and customization options through open-source software, and improved scalability. Continuous innovation in areas such as disaggregated chassis and higher port density switches are pushing the boundaries of performance and efficiency.
Key Drivers, Barriers & Challenges in White Box Networking
Key Drivers:
- Cost Savings: White box solutions significantly reduce capital expenditure compared to proprietary networking equipment.
- Flexibility & Customization: Open-source software allows for tailoring solutions to specific needs.
- Increased Agility: Faster deployment and easier management compared to traditional closed systems.
Challenges & Restraints:
- Integration Complexity: Setting up and managing white box networks requires specialized expertise, which can be a barrier for some organizations.
- Support & Maintenance: Finding adequate support and maintenance services can be challenging compared to vendor-supported solutions.
- Security Concerns: Ensuring network security in a white box environment requires careful planning and implementation of robust security measures. The lack of vendor-provided security updates poses a risk if not managed carefully. This translates into an estimated xx% increase in security-related expenditures for organizations adopting white box solutions compared to traditional solutions.
Emerging Opportunities in White Box Networking
- Expansion into Edge Computing: White box networking offers significant opportunities in the growing edge computing market, where low latency and high bandwidth are essential.
- Integration with AI & Machine Learning: Integrating AI and machine learning into network management can further enhance efficiency and automation.
- Growth in 5G & IoT Networks: White box solutions are well-positioned to support the demands of next-generation networks, creating opportunities for expansion in these sectors.
Growth Accelerators in the White Box Networking Industry
Several factors are poised to accelerate the growth of the white box networking market, including the ongoing advancements in SDN and NFV technologies, the increasing adoption of open-source software, and the rise of hyperscale data centers. Strategic partnerships between hardware vendors, software providers, and system integrators will further drive market expansion. Moreover, the continued development of specialized white box solutions tailored for specific applications and industry verticals, such as financial services or healthcare, will expand the market reach.
Key Players Shaping the White Box Networking Market
Notable Milestones in White Box Networking Sector
- 2020: Cumulus Networks launches its new line of network operating systems with enhanced security features.
- 2021: Arista Networks acquires a smaller white box vendor, expanding its product portfolio.
- 2022: DriveNets secures a major contract with a tier-1 telecommunications provider.
- 2023: Open source initiatives significantly boost the development of white box networking solutions.
In-Depth White Box Networking Market Outlook
The future of the White Box Networking market is bright, driven by technological advancements and increasing demand. The market is expected to continue its robust growth trajectory, presenting significant opportunities for both established players and new entrants. Strategic alliances, investment in research and development, and focus on providing comprehensive support and services will be crucial for success in this dynamic market. The predicted CAGR from 2025 to 2033 is expected to be xx%, exceeding the previous period’s growth. This is primarily due to the expected acceleration in digital transformation across all industries and the increased adoption of cloud computing globally.
White Box Networking Segmentation
-
1. Application
- 1.1. SMEs
- 1.2. Large Enterprises
-
2. Types
- 2.1. Cloud Data Center
- 2.2. Other
White Box Networking Segmentation By Geography
-
1. North America
- 1.1. United States
- 1.2. Canada
- 1.3. Mexico
-
2. South America
- 2.1. Brazil
- 2.2. Argentina
- 2.3. Rest of South America
-
3. Europe
- 3.1. United Kingdom
- 3.2. Germany
- 3.3. France
- 3.4. Italy
- 3.5. Spain
- 3.6. Russia
- 3.7. Benelux
- 3.8. Nordics
- 3.9. Rest of Europe
-
4. Middle East & Africa
- 4.1. Turkey
- 4.2. Israel
- 4.3. GCC
- 4.4. North Africa
- 4.5. South Africa
- 4.6. Rest of Middle East & Africa
-
5. Asia Pacific
- 5.1. China
- 5.2. India
- 5.3. Japan
- 5.4. South Korea
- 5.5. ASEAN
- 5.6. Oceania
- 5.7. Rest of Asia Pacific
White Box Networking Regional Market Share
Geographic Coverage of White Box Networking
White Box Networking REPORT HIGHLIGHTS
| Aspects | Details |
|---|---|
| Study Period | 2020-2034 |
| Base Year | 2025 |
| Estimated Year | 2026 |
| Forecast Period | 2026-2034 |
| Historical Period | 2020-2025 |
| Growth Rate | CAGR of 16.9% from 2020-2034 |
| Segmentation |
|
Table of Contents
- 1. Introduction
- 1.1. Research Scope
- 1.2. Market Segmentation
- 1.3. Research Objective
- 1.4. Definitions and Assumptions
- 2. Executive Summary
- 2.1. Market Snapshot
- 3. Market Dynamics
- 3.1. Market Drivers
- 3.2. Market Restrains
- 3.3. Market Trends
- 3.4. Market Opportunities
- 4. Market Factor Analysis
- 4.1. Porters Five Forces
- 4.1.1. Bargaining Power of Suppliers
- 4.1.2. Bargaining Power of Buyers
- 4.1.3. Threat of New Entrants
- 4.1.4. Threat of Substitutes
- 4.1.5. Competitive Rivalry
- 4.2. PESTEL analysis
- 4.3. BCG Analysis
- 4.3.1. Stars (High Growth, High Market Share)
- 4.3.2. Cash Cows (Low Growth, High Market Share)
- 4.3.3. Question Mark (High Growth, Low Market Share)
- 4.3.4. Dogs (Low Growth, Low Market Share)
- 4.4. Ansoff Matrix Analysis
- 4.5. Supply Chain Analysis
- 4.6. Regulatory Landscape
- 4.7. Current Market Potential and Opportunity Assessment (TAM–SAM–SOM Framework)
- 4.8. VDR Analyst Note
- 4.1. Porters Five Forces
- 5. Market Analysis, Insights and Forecast 2021-2033
- 5.1. Market Analysis, Insights and Forecast - by Application
- 5.1.1. SMEs
- 5.1.2. Large Enterprises
- 5.2. Market Analysis, Insights and Forecast - by Types
- 5.2.1. Cloud Data Center
- 5.2.2. Other
- 5.3. Market Analysis, Insights and Forecast - by Region
- 5.3.1. North America
- 5.3.2. South America
- 5.3.3. Europe
- 5.3.4. Middle East & Africa
- 5.3.5. Asia Pacific
- 5.1. Market Analysis, Insights and Forecast - by Application
- 6. Global White Box Networking Analysis, Insights and Forecast, 2021-2033
- 6.1. Market Analysis, Insights and Forecast - by Application
- 6.1.1. SMEs
- 6.1.2. Large Enterprises
- 6.2. Market Analysis, Insights and Forecast - by Types
- 6.2.1. Cloud Data Center
- 6.2.2. Other
- 6.1. Market Analysis, Insights and Forecast - by Application
- 7. North America White Box Networking Analysis, Insights and Forecast, 2021-2033
- 7.1. Market Analysis, Insights and Forecast - by Application
- 7.1.1. SMEs
- 7.1.2. Large Enterprises
- 7.2. Market Analysis, Insights and Forecast - by Types
- 7.2.1. Cloud Data Center
- 7.2.2. Other
- 7.1. Market Analysis, Insights and Forecast - by Application
- 8. South America White Box Networking Analysis, Insights and Forecast, 2021-2033
- 8.1. Market Analysis, Insights and Forecast - by Application
- 8.1.1. SMEs
- 8.1.2. Large Enterprises
- 8.2. Market Analysis, Insights and Forecast - by Types
- 8.2.1. Cloud Data Center
- 8.2.2. Other
- 8.1. Market Analysis, Insights and Forecast - by Application
- 9. Europe White Box Networking Analysis, Insights and Forecast, 2021-2033
- 9.1. Market Analysis, Insights and Forecast - by Application
- 9.1.1. SMEs
- 9.1.2. Large Enterprises
- 9.2. Market Analysis, Insights and Forecast - by Types
- 9.2.1. Cloud Data Center
- 9.2.2. Other
- 9.1. Market Analysis, Insights and Forecast - by Application
- 10. Middle East & Africa White Box Networking Analysis, Insights and Forecast, 2021-2033
- 10.1. Market Analysis, Insights and Forecast - by Application
- 10.1.1. SMEs
- 10.1.2. Large Enterprises
- 10.2. Market Analysis, Insights and Forecast - by Types
- 10.2.1. Cloud Data Center
- 10.2.2. Other
- 10.1. Market Analysis, Insights and Forecast - by Application
- 11. Asia Pacific White Box Networking Analysis, Insights and Forecast, 2021-2033
- 11.1. Market Analysis, Insights and Forecast - by Application
- 11.1.1. SMEs
- 11.1.2. Large Enterprises
- 11.2. Market Analysis, Insights and Forecast - by Types
- 11.2.1. Cloud Data Center
- 11.2.2. Other
- 11.1. Market Analysis, Insights and Forecast - by Application
- 12. Competitive Analysis
- 12.1. Company Profiles
- 12.1.1 Cumulus Networks
- 12.1.1.1. Company Overview
- 12.1.1.2. Products
- 12.1.1.3. Company Financials
- 12.1.1.4. SWOT Analysis
- 12.1.2 Arista Networks
- 12.1.2.1. Company Overview
- 12.1.2.2. Products
- 12.1.2.3. Company Financials
- 12.1.2.4. SWOT Analysis
- 12.1.3 DriveNets
- 12.1.3.1. Company Overview
- 12.1.3.2. Products
- 12.1.3.3. Company Financials
- 12.1.3.4. SWOT Analysis
- 12.1.4 IP Infusion
- 12.1.4.1. Company Overview
- 12.1.4.2. Products
- 12.1.4.3. Company Financials
- 12.1.4.4. SWOT Analysis
- 12.1.5 Arrcus
- 12.1.5.1. Company Overview
- 12.1.5.2. Products
- 12.1.5.3. Company Financials
- 12.1.5.4. SWOT Analysis
- 12.1.6 Pica8
- 12.1.6.1. Company Overview
- 12.1.6.2. Products
- 12.1.6.3. Company Financials
- 12.1.6.4. SWOT Analysis
- 12.1.7 SnapRoute
- 12.1.7.1. Company Overview
- 12.1.7.2. Products
- 12.1.7.3. Company Financials
- 12.1.7.4. SWOT Analysis
- 12.1.8 Kaloom
- 12.1.8.1. Company Overview
- 12.1.8.2. Products
- 12.1.8.3. Company Financials
- 12.1.8.4. SWOT Analysis
- 12.1.1 Cumulus Networks
- 12.2. Market Entropy
- 12.2.1 Company's Key Areas Served
- 12.2.2 Recent Developments
- 12.3. Company Market Share Analysis 2025
- 12.3.1 Top 5 Companies Market Share Analysis
- 12.3.2 Top 3 Companies Market Share Analysis
- 12.4. List of Potential Customers
- 13. Research Methodology
List of Figures
- Figure 1: Global White Box Networking Revenue Breakdown (million, %) by Region 2025 & 2033
- Figure 2: North America White Box Networking Revenue (million), by Application 2025 & 2033
- Figure 3: North America White Box Networking Revenue Share (%), by Application 2025 & 2033
- Figure 4: North America White Box Networking Revenue (million), by Types 2025 & 2033
- Figure 5: North America White Box Networking Revenue Share (%), by Types 2025 & 2033
- Figure 6: North America White Box Networking Revenue (million), by Country 2025 & 2033
- Figure 7: North America White Box Networking Revenue Share (%), by Country 2025 & 2033
- Figure 8: South America White Box Networking Revenue (million), by Application 2025 & 2033
- Figure 9: South America White Box Networking Revenue Share (%), by Application 2025 & 2033
- Figure 10: South America White Box Networking Revenue (million), by Types 2025 & 2033
- Figure 11: South America White Box Networking Revenue Share (%), by Types 2025 & 2033
- Figure 12: South America White Box Networking Revenue (million), by Country 2025 & 2033
- Figure 13: South America White Box Networking Revenue Share (%), by Country 2025 & 2033
- Figure 14: Europe White Box Networking Revenue (million), by Application 2025 & 2033
- Figure 15: Europe White Box Networking Revenue Share (%), by Application 2025 & 2033
- Figure 16: Europe White Box Networking Revenue (million), by Types 2025 & 2033
- Figure 17: Europe White Box Networking Revenue Share (%), by Types 2025 & 2033
- Figure 18: Europe White Box Networking Revenue (million), by Country 2025 & 2033
- Figure 19: Europe White Box Networking Revenue Share (%), by Country 2025 & 2033
- Figure 20: Middle East & Africa White Box Networking Revenue (million), by Application 2025 & 2033
- Figure 21: Middle East & Africa White Box Networking Revenue Share (%), by Application 2025 & 2033
- Figure 22: Middle East & Africa White Box Networking Revenue (million), by Types 2025 & 2033
- Figure 23: Middle East & Africa White Box Networking Revenue Share (%), by Types 2025 & 2033
- Figure 24: Middle East & Africa White Box Networking Revenue (million), by Country 2025 & 2033
- Figure 25: Middle East & Africa White Box Networking Revenue Share (%), by Country 2025 & 2033
- Figure 26: Asia Pacific White Box Networking Revenue (million), by Application 2025 & 2033
- Figure 27: Asia Pacific White Box Networking Revenue Share (%), by Application 2025 & 2033
- Figure 28: Asia Pacific White Box Networking Revenue (million), by Types 2025 & 2033
- Figure 29: Asia Pacific White Box Networking Revenue Share (%), by Types 2025 & 2033
- Figure 30: Asia Pacific White Box Networking Revenue (million), by Country 2025 & 2033
- Figure 31: Asia Pacific White Box Networking Revenue Share (%), by Country 2025 & 2033
List of Tables
- Table 1: Global White Box Networking Revenue million Forecast, by Application 2020 & 2033
- Table 2: Global White Box Networking Revenue million Forecast, by Types 2020 & 2033
- Table 3: Global White Box Networking Revenue million Forecast, by Region 2020 & 2033
- Table 4: Global White Box Networking Revenue million Forecast, by Application 2020 & 2033
- Table 5: Global White Box Networking Revenue million Forecast, by Types 2020 & 2033
- Table 6: Global White Box Networking Revenue million Forecast, by Country 2020 & 2033
- Table 7: United States White Box Networking Revenue (million) Forecast, by Application 2020 & 2033
- Table 8: Canada White Box Networking Revenue (million) Forecast, by Application 2020 & 2033
- Table 9: Mexico White Box Networking Revenue (million) Forecast, by Application 2020 & 2033
- Table 10: Global White Box Networking Revenue million Forecast, by Application 2020 & 2033
- Table 11: Global White Box Networking Revenue million Forecast, by Types 2020 & 2033
- Table 12: Global White Box Networking Revenue million Forecast, by Country 2020 & 2033
- Table 13: Brazil White Box Networking Revenue (million) Forecast, by Application 2020 & 2033
- Table 14: Argentina White Box Networking Revenue (million) Forecast, by Application 2020 & 2033
- Table 15: Rest of South America White Box Networking Revenue (million) Forecast, by Application 2020 & 2033
- Table 16: Global White Box Networking Revenue million Forecast, by Application 2020 & 2033
- Table 17: Global White Box Networking Revenue million Forecast, by Types 2020 & 2033
- Table 18: Global White Box Networking Revenue million Forecast, by Country 2020 & 2033
- Table 19: United Kingdom White Box Networking Revenue (million) Forecast, by Application 2020 & 2033
- Table 20: Germany White Box Networking Revenue (million) Forecast, by Application 2020 & 2033
- Table 21: France White Box Networking Revenue (million) Forecast, by Application 2020 & 2033
- Table 22: Italy White Box Networking Revenue (million) Forecast, by Application 2020 & 2033
- Table 23: Spain White Box Networking Revenue (million) Forecast, by Application 2020 & 2033
- Table 24: Russia White Box Networking Revenue (million) Forecast, by Application 2020 & 2033
- Table 25: Benelux White Box Networking Revenue (million) Forecast, by Application 2020 & 2033
- Table 26: Nordics White Box Networking Revenue (million) Forecast, by Application 2020 & 2033
- Table 27: Rest of Europe White Box Networking Revenue (million) Forecast, by Application 2020 & 2033
- Table 28: Global White Box Networking Revenue million Forecast, by Application 2020 & 2033
- Table 29: Global White Box Networking Revenue million Forecast, by Types 2020 & 2033
- Table 30: Global White Box Networking Revenue million Forecast, by Country 2020 & 2033
- Table 31: Turkey White Box Networking Revenue (million) Forecast, by Application 2020 & 2033
- Table 32: Israel White Box Networking Revenue (million) Forecast, by Application 2020 & 2033
- Table 33: GCC White Box Networking Revenue (million) Forecast, by Application 2020 & 2033
- Table 34: North Africa White Box Networking Revenue (million) Forecast, by Application 2020 & 2033
- Table 35: South Africa White Box Networking Revenue (million) Forecast, by Application 2020 & 2033
- Table 36: Rest of Middle East & Africa White Box Networking Revenue (million) Forecast, by Application 2020 & 2033
- Table 37: Global White Box Networking Revenue million Forecast, by Application 2020 & 2033
- Table 38: Global White Box Networking Revenue million Forecast, by Types 2020 & 2033
- Table 39: Global White Box Networking Revenue million Forecast, by Country 2020 & 2033
- Table 40: China White Box Networking Revenue (million) Forecast, by Application 2020 & 2033
- Table 41: India White Box Networking Revenue (million) Forecast, by Application 2020 & 2033
- Table 42: Japan White Box Networking Revenue (million) Forecast, by Application 2020 & 2033
- Table 43: South Korea White Box Networking Revenue (million) Forecast, by Application 2020 & 2033
- Table 44: ASEAN White Box Networking Revenue (million) Forecast, by Application 2020 & 2033
- Table 45: Oceania White Box Networking Revenue (million) Forecast, by Application 2020 & 2033
- Table 46: Rest of Asia Pacific White Box Networking Revenue (million) Forecast, by Application 2020 & 2033
Frequently Asked Questions
1. What is the projected Compound Annual Growth Rate (CAGR) of the White Box Networking?
The projected CAGR is approximately 16.9%.
2. Which companies are prominent players in the White Box Networking?
Key companies in the market include Cumulus Networks, Arista Networks, DriveNets, IP Infusion, Arrcus, Pica8, SnapRoute, Kaloom.
3. What are the main segments of the White Box Networking?
The market segments include Application, Types.
4. Can you provide details about the market size?
The market size is estimated to be USD 695 million as of 2022.
5. What are some drivers contributing to market growth?
N/A
6. What are the notable trends driving market growth?
N/A
7. Are there any restraints impacting market growth?
N/A
8. Can you provide examples of recent developments in the market?
N/A
9. What pricing options are available for accessing the report?
Pricing options include single-user, multi-user, and enterprise licenses priced at USD 2900.00, USD 4350.00, and USD 5800.00 respectively.
10. Is the market size provided in terms of value or volume?
The market size is provided in terms of value, measured in million.
11. Are there any specific market keywords associated with the report?
Yes, the market keyword associated with the report is "White Box Networking," which aids in identifying and referencing the specific market segment covered.
12. How do I determine which pricing option suits my needs best?
The pricing options vary based on user requirements and access needs. Individual users may opt for single-user licenses, while businesses requiring broader access may choose multi-user or enterprise licenses for cost-effective access to the report.
13. Are there any additional resources or data provided in the White Box Networking report?
While the report offers comprehensive insights, it's advisable to review the specific contents or supplementary materials provided to ascertain if additional resources or data are available.
14. How can I stay updated on further developments or reports in the White Box Networking?
To stay informed about further developments, trends, and reports in the White Box Networking, consider subscribing to industry newsletters, following relevant companies and organizations, or regularly checking reputable industry news sources and publications.
Methodology
Step 1 - Identification of Relevant Samples Size from Population Database


Step 2 - Approaches for Defining Global Market Size (Value, Volume* & Price*)

Note*: In applicable scenarios
Step 3 - Data Sources
Primary Research
- Web Analytics
- Survey Reports
- Research Institute
- Latest Research Reports
- Opinion Leaders
Secondary Research
- Annual Reports
- White Paper
- Latest Press Release
- Industry Association
- Paid Database
- Investor Presentations

Step 4 - Data Triangulation
Involves using different sources of information in order to increase the validity of a study
These sources are likely to be stakeholders in a program - participants, other researchers, program staff, other community members, and so on.
Then we put all data in single framework & apply various statistical tools to find out the dynamic on the market.
During the analysis stage, feedback from the stakeholder groups would be compared to determine areas of agreement as well as areas of divergence