
Key Insights
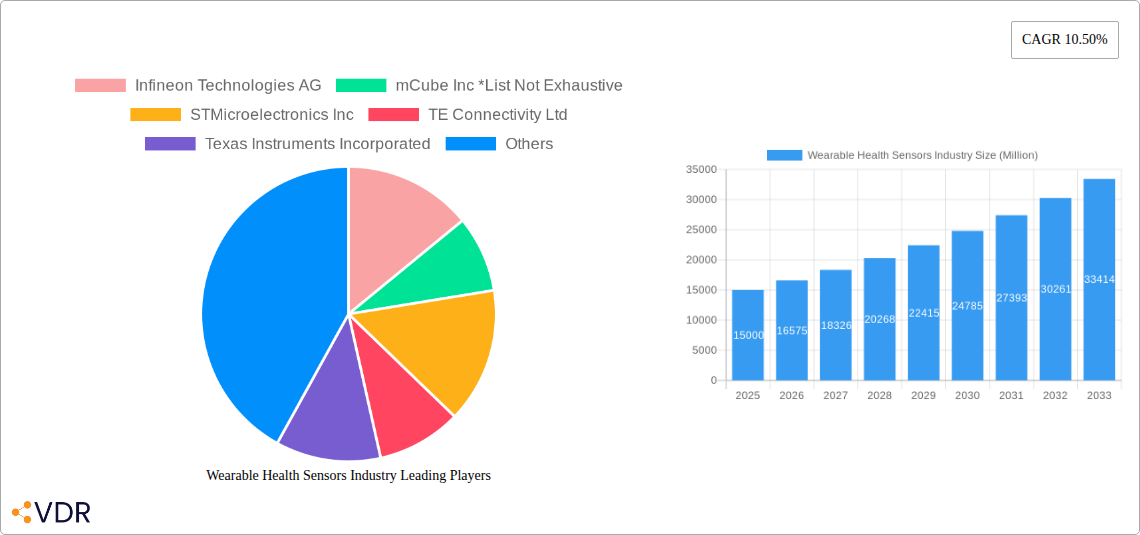
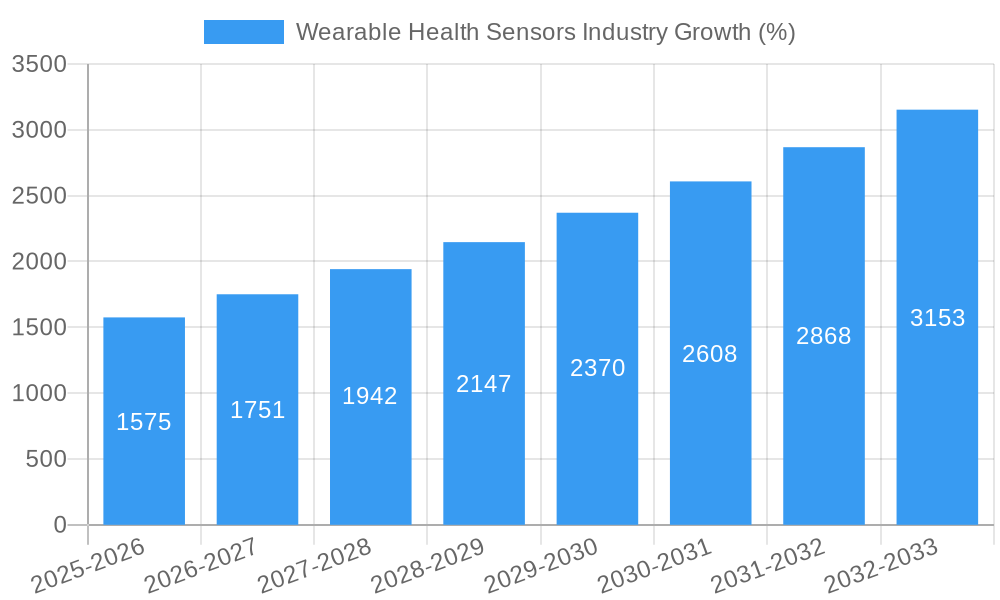
The Wearable Health Sensors market is experiencing robust growth, driven by increasing demand for convenient and continuous health monitoring, coupled with advancements in sensor technology and miniaturization. The market, valued at approximately $15 billion in 2025, is projected to achieve a Compound Annual Growth Rate (CAGR) of 10.5% from 2025 to 2033. This expansion is fueled by several key factors. The rising prevalence of chronic diseases necessitates regular health monitoring, making wearable sensors a crucial tool for early detection and preventative care. Technological advancements, such as the development of more accurate, energy-efficient, and smaller sensors, are broadening the applications and improving the user experience. Furthermore, the increasing affordability of wearable devices and the growing adoption of telehealth solutions are contributing to market growth. The market is segmented by sensor type (pressure, temperature, position, and others) and end-user industry (healthcare, consumer electronics, sports/fitness, and others). The healthcare segment is expected to dominate due to the extensive applications in remote patient monitoring, fitness tracking, and diagnostics.
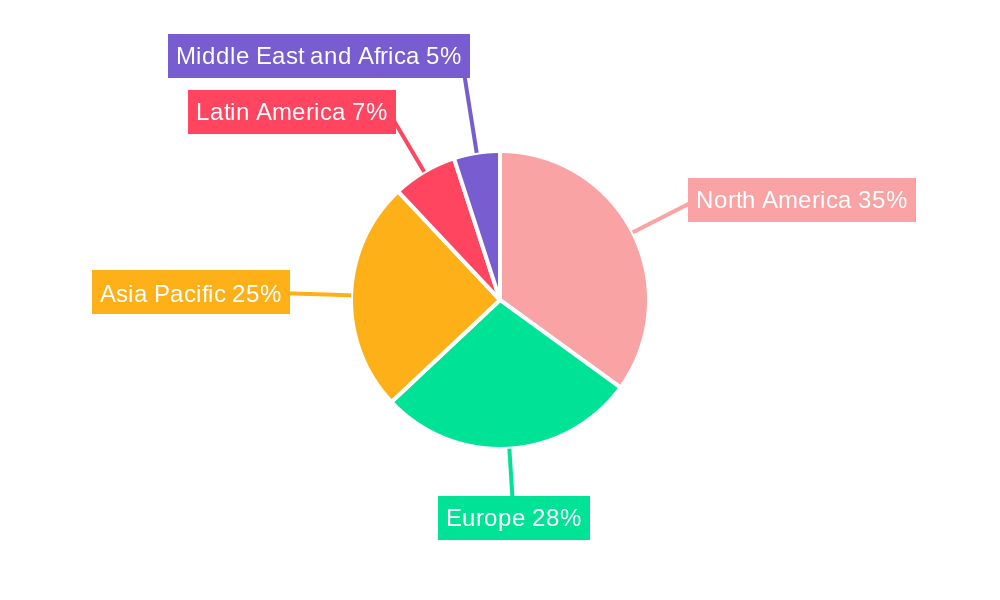
The Asia Pacific region is anticipated to exhibit significant growth potential owing to a large and expanding population, increasing healthcare expenditure, and rising awareness of health and wellness. North America, however, currently holds the largest market share due to established healthcare infrastructure and early adoption of advanced technologies. While the market faces challenges such as data privacy concerns and regulatory hurdles, the overall positive trends indicate a promising outlook for the industry. Competitive landscape analysis reveals key players like Infineon Technologies, STMicroelectronics, Texas Instruments, and others continuously investing in research and development, leading to innovation and market consolidation. The forecast period of 2025-2033 promises further market expansion, driven by technological advancements, increased consumer awareness, and the integration of wearable sensors into diverse healthcare and wellness applications.
Wearable Health Sensors Market Report: 2019-2033
This comprehensive report provides a detailed analysis of the Wearable Health Sensors market, encompassing market dynamics, growth trends, regional dominance, product landscape, key players, and future outlook. The study period spans from 2019 to 2033, with 2025 serving as the base and estimated year. The report utilizes both qualitative and quantitative data to offer valuable insights for industry professionals, investors, and strategic decision-makers. Parent market considered is the overall health monitoring industry and child market is the wearable health sensor segment. The total market size in 2025 is estimated at xx million units.
Wearable Health Sensors Industry Market Dynamics & Structure
The Wearable Health Sensors market is characterized by a moderately fragmented landscape, with several key players competing for market share. Technological innovation, driven by advancements in miniaturization, power efficiency, and sensor integration, is a crucial growth driver. Stringent regulatory frameworks concerning data privacy and device accuracy influence market dynamics. Competitive substitutes, such as traditional diagnostic methods, exert pressure on market penetration. The end-user demographic is expanding, encompassing diverse age groups and health conditions. Mergers and acquisitions (M&A) activity is notable, reflecting industry consolidation and technological integration. Between 2019 and 2024, approximately xx M&A deals were recorded, representing a xx% increase compared to the previous period.
- Market Concentration: Moderately fragmented, with top 5 players holding approximately xx% market share.
- Technological Innovation: Advancements in MEMS, IoT connectivity, and AI-powered analytics drive innovation.
- Regulatory Framework: Stringent data privacy regulations, such as GDPR and HIPAA, shape product development and market access.
- Competitive Substitutes: Traditional diagnostic tools and methods pose competitive pressure.
- End-User Demographics: Growing elderly population and increasing health consciousness broaden the market.
- M&A Trends: Consolidation and strategic partnerships are key trends within the market. xx major M&A deals occurred in the last 5 years.
Wearable Health Sensors Industry Growth Trends & Insights
The Wearable Health Sensors market exhibits robust growth, driven by increasing demand for remote patient monitoring, personalized healthcare, and fitness tracking. The market size is projected to expand significantly, with a compound annual growth rate (CAGR) of xx% during the forecast period (2025-2033). Technological disruptions, such as the integration of artificial intelligence and machine learning, enhance sensor capabilities and data analysis. Shifting consumer behavior towards proactive health management fuels market adoption. The market penetration rate is projected to increase from xx% in 2025 to xx% by 2033.
(Further detailed analysis of market size evolution, adoption rates, technological disruptions, and consumer behavior shifts would be included here, reaching 600 words. Specific metrics like CAGR and market penetration for different segments will be presented.)
Dominant Regions, Countries, or Segments in Wearable Health Sensors Industry
North America currently dominates the Wearable Health Sensors market, followed by Europe and Asia-Pacific. The high adoption rate of wearable technology and advanced healthcare infrastructure in North America contributes to its leading position. Within the segments, the Healthcare end-user industry holds the largest market share, driven by increasing demand for remote patient monitoring solutions. The Pressure Sensor segment represents a significant portion of the market due to its widespread applications in blood pressure monitoring and other vital sign tracking.
- Key Drivers (North America): Advanced healthcare infrastructure, high adoption rate of wearable technologies, supportive regulatory environment.
- Key Drivers (Healthcare Segment): Growing demand for remote patient monitoring, increasing prevalence of chronic diseases, rising healthcare costs.
- Key Drivers (Pressure Sensor): Wide applications in blood pressure monitoring and other vital signs.
(Further detailed analysis of market share and growth potential for each region and segment would be included here, reaching 600 words. Specific drivers for each region and segment are detailed.)
Wearable Health Sensors Industry Product Landscape
Wearable health sensors are witnessing rapid advancements in miniaturization, improved accuracy, and enhanced power efficiency. Products are becoming increasingly sophisticated, incorporating features like wireless connectivity, data analytics, and integration with mobile applications. This leads to a rise in user-friendly, comfortable, and cost-effective devices. Unique selling propositions include long battery life, advanced data processing capabilities, and seamless integration with existing healthcare ecosystems. Technological advancements include the integration of AI algorithms for improved diagnostic accuracy.
Key Drivers, Barriers & Challenges in Wearable Health Sensors Industry
Key Drivers:
- Increasing prevalence of chronic diseases
- Rising demand for remote patient monitoring
- Growing adoption of wearable technology in fitness and wellness
- Advancements in sensor technology and data analytics
Key Challenges:
- Data security and privacy concerns
- High initial investment costs
- Limited interoperability between different devices and systems
- Regulatory hurdles and approval processes
Emerging Opportunities in Wearable Health Sensors Industry
- Untapped Markets: Expanding into emerging economies with growing healthcare needs.
- Innovative Applications: Development of sensors for new health conditions and applications.
- Evolving Consumer Preferences: Customization of devices to cater to specific needs and preferences.
Growth Accelerators in the Wearable Health Sensors Industry
Technological breakthroughs in miniaturization, improved sensor accuracy, and advanced data analytics are driving long-term growth. Strategic partnerships between sensor manufacturers, healthcare providers, and technology companies foster innovation and market expansion. Focus on expanding into emerging markets and developing cost-effective solutions further accelerate market growth.
Key Players Shaping the Wearable Health Sensors Market
- Infineon Technologies AG
- mCube Inc
- STMicroelectronics Inc
- TE Connectivity Ltd
- Texas Instruments Incorporated
- Arm Limited
- TDK Corporation
- Fraunhofer IIS
- Analog Devices Inc
- Maxim Integrated Products Inc
Notable Milestones in Wearable Health Sensors Industry Sector
- June 2022: Nitto Denko Corporation acquired Bend Labs, Inc., creating Nitto Bend Technologies and expanding its sensor technology portfolio.
- February 2022: Abbott received FDA approval for expanded use of its Cardio MEMS HF System, significantly increasing its addressable market by 1.2 million patients.
In-Depth Wearable Health Sensors Industry Market Outlook
The Wearable Health Sensors market is poised for continued strong growth, driven by ongoing technological advancements, increasing demand for personalized healthcare, and expansion into new markets. Strategic partnerships, focusing on data analytics and integration with broader healthcare systems, will shape future market dynamics. Opportunities exist in developing next-generation sensors with enhanced accuracy, improved power efficiency, and seamless integration into the Internet of Medical Things (IoMT).
Wearable Health Sensors Industry Segmentation
-
1. Type
- 1.1. Pressure Sensor
- 1.2. Temperature Sensor
- 1.3. Position Sensor
- 1.4. Other Types
-
2. End User Industry
- 2.1. Healthcare
- 2.2. Consumer Electronic
- 2.3. Sports/Fitness
- 2.4. Other End User Industries
Wearable Health Sensors Industry Segmentation By Geography
- 1. Asia Pacific
- 2. Europe
- 3. Latin America
- 4. Middle East and Africa
- 5. North America
Wearable Health Sensors Industry REPORT HIGHLIGHTS
| Aspects | Details |
|---|---|
| Study Period | 2019-2033 |
| Base Year | 2024 |
| Estimated Year | 2025 |
| Forecast Period | 2025-2033 |
| Historical Period | 2019-2024 |
| Growth Rate | CAGR of 10.50% from 2019-2033 |
| Segmentation |
|
Table of Contents
- 1. Introduction
- 1.1. Research Scope
- 1.2. Market Segmentation
- 1.3. Research Methodology
- 1.4. Definitions and Assumptions
- 2. Executive Summary
- 2.1. Introduction
- 3. Market Dynamics
- 3.1. Introduction
- 3.2. Market Drivers
- 3.2.1. Increasing Need for Continuous Monitoring In Healthcare Services; Rising Growth toward Advanced Functions Sensors in Smart Gadgets; Miniaturization of Physiological Sensors
- 3.3. Market Restrains
- 3.3.1. Dearth of Common Standards and Interoperability Issues
- 3.4. Market Trends
- 3.4.1. Healthcare Industry Holds a Dominant Share in Wearable Health Sensors Market
- 4. Market Factor Analysis
- 4.1. Porters Five Forces
- 4.2. Supply/Value Chain
- 4.3. PESTEL analysis
- 4.4. Market Entropy
- 4.5. Patent/Trademark Analysis
- 5. Global Wearable Health Sensors Industry Analysis, Insights and Forecast, 2019-2031
- 5.1. Market Analysis, Insights and Forecast - by Type
- 5.1.1. Pressure Sensor
- 5.1.2. Temperature Sensor
- 5.1.3. Position Sensor
- 5.1.4. Other Types
- 5.2. Market Analysis, Insights and Forecast - by End User Industry
- 5.2.1. Healthcare
- 5.2.2. Consumer Electronic
- 5.2.3. Sports/Fitness
- 5.2.4. Other End User Industries
- 5.3. Market Analysis, Insights and Forecast - by Region
- 5.3.1. Asia Pacific
- 5.3.2. Europe
- 5.3.3. Latin America
- 5.3.4. Middle East and Africa
- 5.3.5. North America
- 5.1. Market Analysis, Insights and Forecast - by Type
- 6. Asia Pacific Wearable Health Sensors Industry Analysis, Insights and Forecast, 2019-2031
- 6.1. Market Analysis, Insights and Forecast - by Type
- 6.1.1. Pressure Sensor
- 6.1.2. Temperature Sensor
- 6.1.3. Position Sensor
- 6.1.4. Other Types
- 6.2. Market Analysis, Insights and Forecast - by End User Industry
- 6.2.1. Healthcare
- 6.2.2. Consumer Electronic
- 6.2.3. Sports/Fitness
- 6.2.4. Other End User Industries
- 6.1. Market Analysis, Insights and Forecast - by Type
- 7. Europe Wearable Health Sensors Industry Analysis, Insights and Forecast, 2019-2031
- 7.1. Market Analysis, Insights and Forecast - by Type
- 7.1.1. Pressure Sensor
- 7.1.2. Temperature Sensor
- 7.1.3. Position Sensor
- 7.1.4. Other Types
- 7.2. Market Analysis, Insights and Forecast - by End User Industry
- 7.2.1. Healthcare
- 7.2.2. Consumer Electronic
- 7.2.3. Sports/Fitness
- 7.2.4. Other End User Industries
- 7.1. Market Analysis, Insights and Forecast - by Type
- 8. Latin America Wearable Health Sensors Industry Analysis, Insights and Forecast, 2019-2031
- 8.1. Market Analysis, Insights and Forecast - by Type
- 8.1.1. Pressure Sensor
- 8.1.2. Temperature Sensor
- 8.1.3. Position Sensor
- 8.1.4. Other Types
- 8.2. Market Analysis, Insights and Forecast - by End User Industry
- 8.2.1. Healthcare
- 8.2.2. Consumer Electronic
- 8.2.3. Sports/Fitness
- 8.2.4. Other End User Industries
- 8.1. Market Analysis, Insights and Forecast - by Type
- 9. Middle East and Africa Wearable Health Sensors Industry Analysis, Insights and Forecast, 2019-2031
- 9.1. Market Analysis, Insights and Forecast - by Type
- 9.1.1. Pressure Sensor
- 9.1.2. Temperature Sensor
- 9.1.3. Position Sensor
- 9.1.4. Other Types
- 9.2. Market Analysis, Insights and Forecast - by End User Industry
- 9.2.1. Healthcare
- 9.2.2. Consumer Electronic
- 9.2.3. Sports/Fitness
- 9.2.4. Other End User Industries
- 9.1. Market Analysis, Insights and Forecast - by Type
- 10. North America Wearable Health Sensors Industry Analysis, Insights and Forecast, 2019-2031
- 10.1. Market Analysis, Insights and Forecast - by Type
- 10.1.1. Pressure Sensor
- 10.1.2. Temperature Sensor
- 10.1.3. Position Sensor
- 10.1.4. Other Types
- 10.2. Market Analysis, Insights and Forecast - by End User Industry
- 10.2.1. Healthcare
- 10.2.2. Consumer Electronic
- 10.2.3. Sports/Fitness
- 10.2.4. Other End User Industries
- 10.1. Market Analysis, Insights and Forecast - by Type
- 11. Asia Pacific Wearable Health Sensors Industry Analysis, Insights and Forecast, 2019-2031
- 11.1. Market Analysis, Insights and Forecast - By Country/Sub-region
- 11.1.1.
- 12. Europe Wearable Health Sensors Industry Analysis, Insights and Forecast, 2019-2031
- 12.1. Market Analysis, Insights and Forecast - By Country/Sub-region
- 12.1.1.
- 13. Latin America Wearable Health Sensors Industry Analysis, Insights and Forecast, 2019-2031
- 13.1. Market Analysis, Insights and Forecast - By Country/Sub-region
- 13.1.1.
- 14. Middle East and Africa Wearable Health Sensors Industry Analysis, Insights and Forecast, 2019-2031
- 14.1. Market Analysis, Insights and Forecast - By Country/Sub-region
- 14.1.1.
- 15. North America Wearable Health Sensors Industry Analysis, Insights and Forecast, 2019-2031
- 15.1. Market Analysis, Insights and Forecast - By Country/Sub-region
- 15.1.1.
- 16. Competitive Analysis
- 16.1. Global Market Share Analysis 2024
- 16.2. Company Profiles
- 16.2.1 Infineon Technologies AG
- 16.2.1.1. Overview
- 16.2.1.2. Products
- 16.2.1.3. SWOT Analysis
- 16.2.1.4. Recent Developments
- 16.2.1.5. Financials (Based on Availability)
- 16.2.2 mCube Inc *List Not Exhaustive
- 16.2.2.1. Overview
- 16.2.2.2. Products
- 16.2.2.3. SWOT Analysis
- 16.2.2.4. Recent Developments
- 16.2.2.5. Financials (Based on Availability)
- 16.2.3 STMicroelectronics Inc
- 16.2.3.1. Overview
- 16.2.3.2. Products
- 16.2.3.3. SWOT Analysis
- 16.2.3.4. Recent Developments
- 16.2.3.5. Financials (Based on Availability)
- 16.2.4 TE Connectivity Ltd
- 16.2.4.1. Overview
- 16.2.4.2. Products
- 16.2.4.3. SWOT Analysis
- 16.2.4.4. Recent Developments
- 16.2.4.5. Financials (Based on Availability)
- 16.2.5 Texas Instruments Incorporated
- 16.2.5.1. Overview
- 16.2.5.2. Products
- 16.2.5.3. SWOT Analysis
- 16.2.5.4. Recent Developments
- 16.2.5.5. Financials (Based on Availability)
- 16.2.6 Arm Limited
- 16.2.6.1. Overview
- 16.2.6.2. Products
- 16.2.6.3. SWOT Analysis
- 16.2.6.4. Recent Developments
- 16.2.6.5. Financials (Based on Availability)
- 16.2.7 TDK Corporation
- 16.2.7.1. Overview
- 16.2.7.2. Products
- 16.2.7.3. SWOT Analysis
- 16.2.7.4. Recent Developments
- 16.2.7.5. Financials (Based on Availability)
- 16.2.8 Fraunhofer IIS
- 16.2.8.1. Overview
- 16.2.8.2. Products
- 16.2.8.3. SWOT Analysis
- 16.2.8.4. Recent Developments
- 16.2.8.5. Financials (Based on Availability)
- 16.2.9 Analog Devices Inc
- 16.2.9.1. Overview
- 16.2.9.2. Products
- 16.2.9.3. SWOT Analysis
- 16.2.9.4. Recent Developments
- 16.2.9.5. Financials (Based on Availability)
- 16.2.10 Maxim Integrated Products Inc
- 16.2.10.1. Overview
- 16.2.10.2. Products
- 16.2.10.3. SWOT Analysis
- 16.2.10.4. Recent Developments
- 16.2.10.5. Financials (Based on Availability)
- 16.2.1 Infineon Technologies AG
List of Figures
- Figure 1: Global Wearable Health Sensors Industry Revenue Breakdown (Million, %) by Region 2024 & 2032
- Figure 2: Asia Pacific Wearable Health Sensors Industry Revenue (Million), by Country 2024 & 2032
- Figure 3: Asia Pacific Wearable Health Sensors Industry Revenue Share (%), by Country 2024 & 2032
- Figure 4: Europe Wearable Health Sensors Industry Revenue (Million), by Country 2024 & 2032
- Figure 5: Europe Wearable Health Sensors Industry Revenue Share (%), by Country 2024 & 2032
- Figure 6: Latin America Wearable Health Sensors Industry Revenue (Million), by Country 2024 & 2032
- Figure 7: Latin America Wearable Health Sensors Industry Revenue Share (%), by Country 2024 & 2032
- Figure 8: Middle East and Africa Wearable Health Sensors Industry Revenue (Million), by Country 2024 & 2032
- Figure 9: Middle East and Africa Wearable Health Sensors Industry Revenue Share (%), by Country 2024 & 2032
- Figure 10: North America Wearable Health Sensors Industry Revenue (Million), by Country 2024 & 2032
- Figure 11: North America Wearable Health Sensors Industry Revenue Share (%), by Country 2024 & 2032
- Figure 12: Asia Pacific Wearable Health Sensors Industry Revenue (Million), by Type 2024 & 2032
- Figure 13: Asia Pacific Wearable Health Sensors Industry Revenue Share (%), by Type 2024 & 2032
- Figure 14: Asia Pacific Wearable Health Sensors Industry Revenue (Million), by End User Industry 2024 & 2032
- Figure 15: Asia Pacific Wearable Health Sensors Industry Revenue Share (%), by End User Industry 2024 & 2032
- Figure 16: Asia Pacific Wearable Health Sensors Industry Revenue (Million), by Country 2024 & 2032
- Figure 17: Asia Pacific Wearable Health Sensors Industry Revenue Share (%), by Country 2024 & 2032
- Figure 18: Europe Wearable Health Sensors Industry Revenue (Million), by Type 2024 & 2032
- Figure 19: Europe Wearable Health Sensors Industry Revenue Share (%), by Type 2024 & 2032
- Figure 20: Europe Wearable Health Sensors Industry Revenue (Million), by End User Industry 2024 & 2032
- Figure 21: Europe Wearable Health Sensors Industry Revenue Share (%), by End User Industry 2024 & 2032
- Figure 22: Europe Wearable Health Sensors Industry Revenue (Million), by Country 2024 & 2032
- Figure 23: Europe Wearable Health Sensors Industry Revenue Share (%), by Country 2024 & 2032
- Figure 24: Latin America Wearable Health Sensors Industry Revenue (Million), by Type 2024 & 2032
- Figure 25: Latin America Wearable Health Sensors Industry Revenue Share (%), by Type 2024 & 2032
- Figure 26: Latin America Wearable Health Sensors Industry Revenue (Million), by End User Industry 2024 & 2032
- Figure 27: Latin America Wearable Health Sensors Industry Revenue Share (%), by End User Industry 2024 & 2032
- Figure 28: Latin America Wearable Health Sensors Industry Revenue (Million), by Country 2024 & 2032
- Figure 29: Latin America Wearable Health Sensors Industry Revenue Share (%), by Country 2024 & 2032
- Figure 30: Middle East and Africa Wearable Health Sensors Industry Revenue (Million), by Type 2024 & 2032
- Figure 31: Middle East and Africa Wearable Health Sensors Industry Revenue Share (%), by Type 2024 & 2032
- Figure 32: Middle East and Africa Wearable Health Sensors Industry Revenue (Million), by End User Industry 2024 & 2032
- Figure 33: Middle East and Africa Wearable Health Sensors Industry Revenue Share (%), by End User Industry 2024 & 2032
- Figure 34: Middle East and Africa Wearable Health Sensors Industry Revenue (Million), by Country 2024 & 2032
- Figure 35: Middle East and Africa Wearable Health Sensors Industry Revenue Share (%), by Country 2024 & 2032
- Figure 36: North America Wearable Health Sensors Industry Revenue (Million), by Type 2024 & 2032
- Figure 37: North America Wearable Health Sensors Industry Revenue Share (%), by Type 2024 & 2032
- Figure 38: North America Wearable Health Sensors Industry Revenue (Million), by End User Industry 2024 & 2032
- Figure 39: North America Wearable Health Sensors Industry Revenue Share (%), by End User Industry 2024 & 2032
- Figure 40: North America Wearable Health Sensors Industry Revenue (Million), by Country 2024 & 2032
- Figure 41: North America Wearable Health Sensors Industry Revenue Share (%), by Country 2024 & 2032
List of Tables
- Table 1: Global Wearable Health Sensors Industry Revenue Million Forecast, by Region 2019 & 2032
- Table 2: Global Wearable Health Sensors Industry Revenue Million Forecast, by Type 2019 & 2032
- Table 3: Global Wearable Health Sensors Industry Revenue Million Forecast, by End User Industry 2019 & 2032
- Table 4: Global Wearable Health Sensors Industry Revenue Million Forecast, by Region 2019 & 2032
- Table 5: Global Wearable Health Sensors Industry Revenue Million Forecast, by Country 2019 & 2032
- Table 6: Wearable Health Sensors Industry Revenue (Million) Forecast, by Application 2019 & 2032
- Table 7: Global Wearable Health Sensors Industry Revenue Million Forecast, by Country 2019 & 2032
- Table 8: Wearable Health Sensors Industry Revenue (Million) Forecast, by Application 2019 & 2032
- Table 9: Global Wearable Health Sensors Industry Revenue Million Forecast, by Country 2019 & 2032
- Table 10: Wearable Health Sensors Industry Revenue (Million) Forecast, by Application 2019 & 2032
- Table 11: Global Wearable Health Sensors Industry Revenue Million Forecast, by Country 2019 & 2032
- Table 12: Wearable Health Sensors Industry Revenue (Million) Forecast, by Application 2019 & 2032
- Table 13: Global Wearable Health Sensors Industry Revenue Million Forecast, by Country 2019 & 2032
- Table 14: Wearable Health Sensors Industry Revenue (Million) Forecast, by Application 2019 & 2032
- Table 15: Global Wearable Health Sensors Industry Revenue Million Forecast, by Type 2019 & 2032
- Table 16: Global Wearable Health Sensors Industry Revenue Million Forecast, by End User Industry 2019 & 2032
- Table 17: Global Wearable Health Sensors Industry Revenue Million Forecast, by Country 2019 & 2032
- Table 18: Global Wearable Health Sensors Industry Revenue Million Forecast, by Type 2019 & 2032
- Table 19: Global Wearable Health Sensors Industry Revenue Million Forecast, by End User Industry 2019 & 2032
- Table 20: Global Wearable Health Sensors Industry Revenue Million Forecast, by Country 2019 & 2032
- Table 21: Global Wearable Health Sensors Industry Revenue Million Forecast, by Type 2019 & 2032
- Table 22: Global Wearable Health Sensors Industry Revenue Million Forecast, by End User Industry 2019 & 2032
- Table 23: Global Wearable Health Sensors Industry Revenue Million Forecast, by Country 2019 & 2032
- Table 24: Global Wearable Health Sensors Industry Revenue Million Forecast, by Type 2019 & 2032
- Table 25: Global Wearable Health Sensors Industry Revenue Million Forecast, by End User Industry 2019 & 2032
- Table 26: Global Wearable Health Sensors Industry Revenue Million Forecast, by Country 2019 & 2032
- Table 27: Global Wearable Health Sensors Industry Revenue Million Forecast, by Type 2019 & 2032
- Table 28: Global Wearable Health Sensors Industry Revenue Million Forecast, by End User Industry 2019 & 2032
- Table 29: Global Wearable Health Sensors Industry Revenue Million Forecast, by Country 2019 & 2032
Frequently Asked Questions
1. What is the projected Compound Annual Growth Rate (CAGR) of the Wearable Health Sensors Industry?
The projected CAGR is approximately 10.50%.
2. Which companies are prominent players in the Wearable Health Sensors Industry?
Key companies in the market include Infineon Technologies AG, mCube Inc *List Not Exhaustive, STMicroelectronics Inc, TE Connectivity Ltd, Texas Instruments Incorporated, Arm Limited, TDK Corporation, Fraunhofer IIS, Analog Devices Inc, Maxim Integrated Products Inc.
3. What are the main segments of the Wearable Health Sensors Industry?
The market segments include Type, End User Industry.
4. Can you provide details about the market size?
The market size is estimated to be USD XX Million as of 2022.
5. What are some drivers contributing to market growth?
Increasing Need for Continuous Monitoring In Healthcare Services; Rising Growth toward Advanced Functions Sensors in Smart Gadgets; Miniaturization of Physiological Sensors.
6. What are the notable trends driving market growth?
Healthcare Industry Holds a Dominant Share in Wearable Health Sensors Market.
7. Are there any restraints impacting market growth?
Dearth of Common Standards and Interoperability Issues.
8. Can you provide examples of recent developments in the market?
June 2022 : Nitto Denko Corporation agreed to acquire Bend Labs, Inc. In line with this acquisition, Bend merged into the Nitto Group from June 1, 2022 to continue its business operations as Nitto Bend Technologies. As a result of this merger agreement, Bend's sensor device technologies were combined with Nitto's strengths for developing a next-generation technologies and products portfolio and new businesses utilizing sensor-acquired data.
9. What pricing options are available for accessing the report?
Pricing options include single-user, multi-user, and enterprise licenses priced at USD 4750, USD 5250, and USD 8750 respectively.
10. Is the market size provided in terms of value or volume?
The market size is provided in terms of value, measured in Million.
11. Are there any specific market keywords associated with the report?
Yes, the market keyword associated with the report is "Wearable Health Sensors Industry," which aids in identifying and referencing the specific market segment covered.
12. How do I determine which pricing option suits my needs best?
The pricing options vary based on user requirements and access needs. Individual users may opt for single-user licenses, while businesses requiring broader access may choose multi-user or enterprise licenses for cost-effective access to the report.
13. Are there any additional resources or data provided in the Wearable Health Sensors Industry report?
While the report offers comprehensive insights, it's advisable to review the specific contents or supplementary materials provided to ascertain if additional resources or data are available.
14. How can I stay updated on further developments or reports in the Wearable Health Sensors Industry?
To stay informed about further developments, trends, and reports in the Wearable Health Sensors Industry, consider subscribing to industry newsletters, following relevant companies and organizations, or regularly checking reputable industry news sources and publications.
Methodology
Step 1 - Identification of Relevant Samples Size from Population Database


Step 2 - Approaches for Defining Global Market Size (Value, Volume* & Price*)

Note*: In applicable scenarios
Step 3 - Data Sources
Primary Research
- Web Analytics
- Survey Reports
- Research Institute
- Latest Research Reports
- Opinion Leaders
Secondary Research
- Annual Reports
- White Paper
- Latest Press Release
- Industry Association
- Paid Database
- Investor Presentations

Step 4 - Data Triangulation
Involves using different sources of information in order to increase the validity of a study
These sources are likely to be stakeholders in a program - participants, other researchers, program staff, other community members, and so on.
Then we put all data in single framework & apply various statistical tools to find out the dynamic on the market.
During the analysis stage, feedback from the stakeholder groups would be compared to determine areas of agreement as well as areas of divergence


