
Key Insights
The global water-based drilling and completion fluids market is experiencing robust growth, driven by increasing oil and gas exploration and production activities, particularly in unconventional resource plays like shale gas and tight oil. The market's expansion is fueled by stringent environmental regulations favoring environmentally friendly fluids, coupled with the rising demand for efficient and cost-effective drilling operations. The shift towards water-based fluids is also driven by their superior performance characteristics in certain geological formations compared to oil-based alternatives. Within the market segmentation, the onshore application segment is currently the largest, while the HPHT (High Pressure High Temperature) well type is experiencing significant growth due to the increasing exploration and production in challenging environments. Major players like Schlumberger, Halliburton, and Baker Hughes are investing heavily in research and development to improve the performance and efficiency of water-based fluids, leading to innovation in additives and formulations. The Asia-Pacific region is anticipated to witness substantial growth owing to the rapid expansion of the oil and gas industry in the region. However, factors like fluctuating crude oil prices and potential supply chain disruptions could act as restraints on market growth in the coming years.
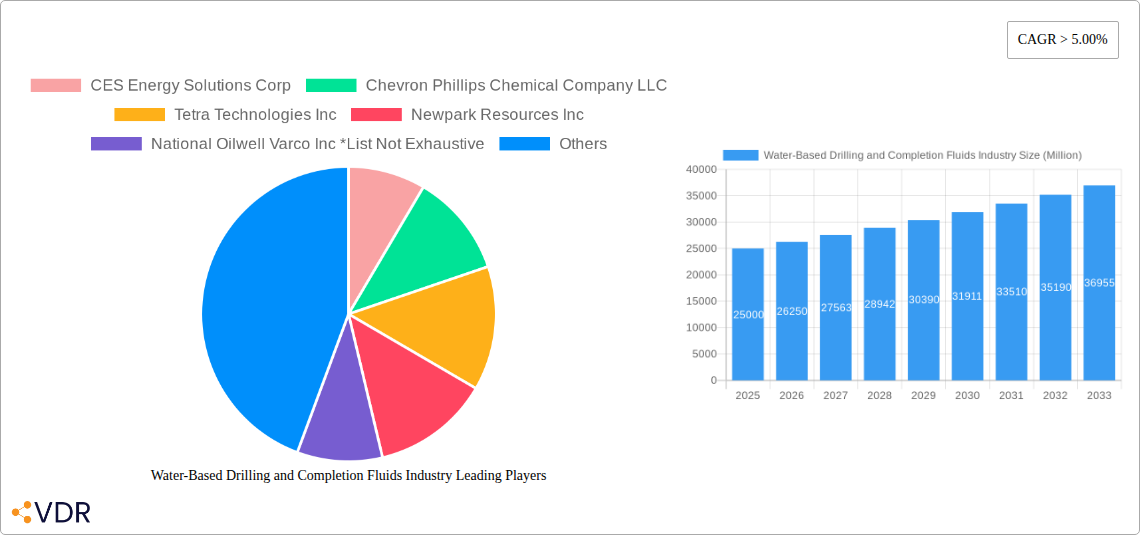
Looking forward, the forecast period (2025-2033) projects continued expansion, with a CAGR exceeding 5%. This growth will be primarily driven by sustained investment in exploration and production, the adoption of advanced drilling technologies, and the ongoing preference for environmentally responsible drilling practices. The offshore segment is expected to witness significant growth, particularly in deepwater projects. Technological advancements in water-based fluid formulations are likely to further enhance performance in challenging environments, creating new opportunities for market participants. Continued focus on sustainability and improving the efficiency of drilling operations will remain key drivers shaping this dynamic market landscape throughout the forecast period. The competitive landscape will remain intense, with existing major players and new entrants vying for market share through innovation and strategic partnerships.
Water-Based Drilling and Completion Fluids Industry Market Report: 2019-2033
This comprehensive report provides an in-depth analysis of the Water-Based Drilling and Completion Fluids market, encompassing historical data (2019-2024), current estimates (2025), and future forecasts (2025-2033). It delves into market dynamics, growth trends, regional dominance, product landscape, key players, and emerging opportunities within the broader drilling fluids market, specifically focusing on the water-based segment. The report is essential for industry professionals, investors, and strategic decision-makers seeking a clear understanding of this crucial sector.
Water-Based Drilling and Completion Fluids Industry Market Dynamics & Structure
The water-based drilling and completion fluids market is characterized by a moderately concentrated landscape, with several major players dominating the global market share. The industry is driven by technological innovation focusing on environmentally friendly formulations and enhanced performance characteristics. Stringent regulatory frameworks, particularly concerning environmental protection and worker safety, significantly influence operations. Competitive pressures stem from alternative fluid types, including oil-based and synthetic fluids. End-user demographics include oil and gas exploration and production companies, spanning both onshore and offshore operations. M&A activity has been robust in recent years, reflecting consolidation within the sector.
- Market Concentration: The top 5 companies hold an estimated xx% market share in 2025.
- Technological Innovation: Focus on reducing environmental impact and improving drilling efficiency drives R&D.
- Regulatory Framework: Stringent environmental regulations and safety standards are key constraints and opportunities for innovation.
- Competitive Substitutes: Oil-based and synthetic fluids present competition, but water-based fluids maintain a large market share due to cost and environmental benefits.
- M&A Trends: The industry has witnessed xx major mergers and acquisitions between 2019 and 2024, with deal value totaling approximately $xx Million. Examples include the Maersk Drilling and Noble Corporation merger.
- Innovation Barriers: High R&D costs and lengthy regulatory approval processes can hinder the introduction of new technologies.
Water-Based Drilling and Completion Fluids Industry Growth Trends & Insights
The global water-based drilling and completion fluids market is experiencing significant growth, driven by the increasing demand for oil and gas across various regions. The market size, valued at $xx Million in 2024, is projected to reach $xx Million by 2033, exhibiting a CAGR of xx% during the forecast period (2025-2033). This growth is primarily fueled by expanding exploration and production activities, particularly in unconventional resource development. The adoption rate of water-based fluids is high, driven by their cost-effectiveness and environmental considerations. However, technological advancements, such as the development of high-performance environmentally friendly fluids, are disrupting the market and further shaping consumer behavior toward sustainable options. Specific advancements include the development of fluids with enhanced rheological properties to improve drilling efficiency and reduce non-productive time. The shift towards environmentally friendly practices is further driving the adoption of improved water-based fluids with reduced environmental footprints.

Dominant Regions, Countries, or Segments in Water-Based Drilling and Completion Fluids Industry
The North American region, specifically the United States and Canada, holds the largest market share within the water-based drilling and completion fluids industry. This dominance stems from significant onshore and offshore drilling activity, robust exploration and production investments, and a well-established infrastructure. However, the Middle East and Asia-Pacific regions are demonstrating rapid growth, fueled by substantial investments in oil and gas exploration and infrastructure development. Within the segments:
- Well Type: The Conventional well type currently accounts for the largest market share, although HPHT wells are showing significant growth.
- Application: Onshore applications currently dominate, but offshore applications are expected to witness faster growth in the coming years.
- Fluid Type: Water-based fluids constitute the largest segment of the market, followed by oil-based and other fluid types.
Key Drivers for Regional Growth:
- North America: Abundant shale gas reserves, supportive regulatory frameworks, and technological advancements.
- Middle East: Large oil reserves, significant investments in oil and gas infrastructure.
- Asia-Pacific: Growing energy demand, rising investments in exploration and production activities.
Water-Based Drilling and Completion Fluids Industry Product Landscape
The water-based drilling and completion fluids market offers a wide array of products tailored to various well conditions and drilling challenges. These fluids are designed to optimize drilling efficiency, minimize formation damage, and ensure wellbore stability. Recent innovations focus on developing environmentally friendly formulations that reduce the environmental impact while maintaining or improving performance. This includes the use of biodegradable polymers and enhanced filtration control technologies. Unique selling propositions (USPs) frequently highlight improved lubricity, reduced friction, and enhanced shale inhibition properties.
Key Drivers, Barriers & Challenges in Water-Based Drilling and Completion Fluids Industry
Key Drivers:
- Increasing oil and gas exploration and production activities globally.
- Growing demand for environmentally friendly drilling fluids.
- Technological advancements leading to improved fluid performance and efficiency.
- Supportive government policies and incentives in several regions.
Key Challenges:
- Fluctuations in oil and gas prices impacting industry investments.
- Stringent environmental regulations and their associated compliance costs.
- Intense competition from other fluid types, such as oil-based and synthetic fluids.
- Supply chain disruptions and the availability of raw materials. These disruptions have impacted the industry by xx% in 2024 resulting in price increases of xx%.
Emerging Opportunities in Water-Based Drilling and Completion Fluids Industry
- Untapped Markets: Exploration and production activities in emerging economies present significant growth potential.
- Innovative Applications: Development of specialized fluids for unconventional resource extraction.
- Evolving Consumer Preferences: Growing demand for sustainable and environmentally friendly fluids.
Growth Accelerators in the Water-Based Drilling and Completion Fluids Industry Industry
Long-term growth in the water-based drilling and completion fluids market will be driven by technological breakthroughs in fluid formulations, leading to improved performance and reduced environmental impact. Strategic partnerships between fluid manufacturers and oil and gas operators will further accelerate growth, along with the expansion into new geographical markets and the development of specialized fluids for challenging well conditions.
Key Players Shaping the Water-Based Drilling and Completion Fluids Market
- CES Energy Solutions Corp
- Chevron Phillips Chemical Company LLC
- Tetra Technologies Inc
- Newpark Resources Inc
- National Oilwell Varco Inc
- Weatherford International PLC
- Baker Hughes Company
- Halliburton Company
- Schlumberger Limited
Notable Milestones in Water-Based Drilling and Completion Fluids Industry Sector
- November 2021: Maersk Drilling and Noble Corporation merge, creating a larger player with expanded capacity.
- October 2021: CWC Energy Services Corp. acquires 10 high-spec drilling rigs, increasing its market presence.
In-Depth Water-Based Drilling and Completion Fluids Industry Market Outlook
The water-based drilling and completion fluids market is poised for continued growth, driven by sustained demand from the oil and gas industry and ongoing technological advancements leading to more environmentally friendly and efficient fluids. Strategic partnerships and expansion into new markets will play a key role in shaping future market dynamics. The focus on sustainability and reduced environmental impact will continue to drive innovation and product development within the sector, presenting significant opportunities for growth and market share gains.
Water-Based Drilling and Completion Fluids Industry Segmentation
-
1. Application
- 1.1. Onshore
- 1.2. Offshore
-
2. Fluid Type
- 2.1. Water-based
- 2.2. Oil-based
- 2.3. Other Fluid Types
-
3. Well Type
- 3.1. Conventional
- 3.2. High Pressure High Temperature (HPHT)
Water-Based Drilling and Completion Fluids Industry Segmentation By Geography
- 1. North America
- 2. Europe
- 3. Asia Pacific
- 4. South America
- 5. Middle East

Water-Based Drilling and Completion Fluids Industry REPORT HIGHLIGHTS
| Aspects | Details |
|---|---|
| Study Period | 2019-2033 |
| Base Year | 2024 |
| Estimated Year | 2025 |
| Forecast Period | 2025-2033 |
| Historical Period | 2019-2024 |
| Growth Rate | CAGR of > 5.00% from 2019-2033 |
| Segmentation |
|
Table of Contents
- 1. Introduction
- 1.1. Research Scope
- 1.2. Market Segmentation
- 1.3. Research Methodology
- 1.4. Definitions and Assumptions
- 2. Executive Summary
- 2.1. Introduction
- 3. Market Dynamics
- 3.1. Introduction
- 3.2. Market Drivers
- 3.2.1. 4.; Rapid Recovery in the Oil and Gas and Mining Industries4.; Surge in the Construction Industry
- 3.3. Market Restrains
- 3.3.1. 4.; High Maintenance and Operation Costs of Submersible Pump Restrain the Market
- 3.4. Market Trends
- 3.4.1. Onshore Segment to Dominate the Market
- 4. Market Factor Analysis
- 4.1. Porters Five Forces
- 4.2. Supply/Value Chain
- 4.3. PESTEL analysis
- 4.4. Market Entropy
- 4.5. Patent/Trademark Analysis
- 5. Global Water-Based Drilling and Completion Fluids Industry Analysis, Insights and Forecast, 2019-2031
- 5.1. Market Analysis, Insights and Forecast - by Application
- 5.1.1. Onshore
- 5.1.2. Offshore
- 5.2. Market Analysis, Insights and Forecast - by Fluid Type
- 5.2.1. Water-based
- 5.2.2. Oil-based
- 5.2.3. Other Fluid Types
- 5.3. Market Analysis, Insights and Forecast - by Well Type
- 5.3.1. Conventional
- 5.3.2. High Pressure High Temperature (HPHT)
- 5.4. Market Analysis, Insights and Forecast - by Region
- 5.4.1. North America
- 5.4.2. Europe
- 5.4.3. Asia Pacific
- 5.4.4. South America
- 5.4.5. Middle East
- 5.1. Market Analysis, Insights and Forecast - by Application
- 6. North America Water-Based Drilling and Completion Fluids Industry Analysis, Insights and Forecast, 2019-2031
- 6.1. Market Analysis, Insights and Forecast - by Application
- 6.1.1. Onshore
- 6.1.2. Offshore
- 6.2. Market Analysis, Insights and Forecast - by Fluid Type
- 6.2.1. Water-based
- 6.2.2. Oil-based
- 6.2.3. Other Fluid Types
- 6.3. Market Analysis, Insights and Forecast - by Well Type
- 6.3.1. Conventional
- 6.3.2. High Pressure High Temperature (HPHT)
- 6.1. Market Analysis, Insights and Forecast - by Application
- 7. Europe Water-Based Drilling and Completion Fluids Industry Analysis, Insights and Forecast, 2019-2031
- 7.1. Market Analysis, Insights and Forecast - by Application
- 7.1.1. Onshore
- 7.1.2. Offshore
- 7.2. Market Analysis, Insights and Forecast - by Fluid Type
- 7.2.1. Water-based
- 7.2.2. Oil-based
- 7.2.3. Other Fluid Types
- 7.3. Market Analysis, Insights and Forecast - by Well Type
- 7.3.1. Conventional
- 7.3.2. High Pressure High Temperature (HPHT)
- 7.1. Market Analysis, Insights and Forecast - by Application
- 8. Asia Pacific Water-Based Drilling and Completion Fluids Industry Analysis, Insights and Forecast, 2019-2031
- 8.1. Market Analysis, Insights and Forecast - by Application
- 8.1.1. Onshore
- 8.1.2. Offshore
- 8.2. Market Analysis, Insights and Forecast - by Fluid Type
- 8.2.1. Water-based
- 8.2.2. Oil-based
- 8.2.3. Other Fluid Types
- 8.3. Market Analysis, Insights and Forecast - by Well Type
- 8.3.1. Conventional
- 8.3.2. High Pressure High Temperature (HPHT)
- 8.1. Market Analysis, Insights and Forecast - by Application
- 9. South America Water-Based Drilling and Completion Fluids Industry Analysis, Insights and Forecast, 2019-2031
- 9.1. Market Analysis, Insights and Forecast - by Application
- 9.1.1. Onshore
- 9.1.2. Offshore
- 9.2. Market Analysis, Insights and Forecast - by Fluid Type
- 9.2.1. Water-based
- 9.2.2. Oil-based
- 9.2.3. Other Fluid Types
- 9.3. Market Analysis, Insights and Forecast - by Well Type
- 9.3.1. Conventional
- 9.3.2. High Pressure High Temperature (HPHT)
- 9.1. Market Analysis, Insights and Forecast - by Application
- 10. Middle East Water-Based Drilling and Completion Fluids Industry Analysis, Insights and Forecast, 2019-2031
- 10.1. Market Analysis, Insights and Forecast - by Application
- 10.1.1. Onshore
- 10.1.2. Offshore
- 10.2. Market Analysis, Insights and Forecast - by Fluid Type
- 10.2.1. Water-based
- 10.2.2. Oil-based
- 10.2.3. Other Fluid Types
- 10.3. Market Analysis, Insights and Forecast - by Well Type
- 10.3.1. Conventional
- 10.3.2. High Pressure High Temperature (HPHT)
- 10.1. Market Analysis, Insights and Forecast - by Application
- 11. North America Water-Based Drilling and Completion Fluids Industry Analysis, Insights and Forecast, 2019-2031
- 11.1. Market Analysis, Insights and Forecast - By Country/Sub-region
- 11.1.1. undefined
- 12. Europe Water-Based Drilling and Completion Fluids Industry Analysis, Insights and Forecast, 2019-2031
- 12.1. Market Analysis, Insights and Forecast - By Country/Sub-region
- 12.1.1. undefined
- 13. Asia Pacific Water-Based Drilling and Completion Fluids Industry Analysis, Insights and Forecast, 2019-2031
- 13.1. Market Analysis, Insights and Forecast - By Country/Sub-region
- 13.1.1. undefined
- 14. South America Water-Based Drilling and Completion Fluids Industry Analysis, Insights and Forecast, 2019-2031
- 14.1. Market Analysis, Insights and Forecast - By Country/Sub-region
- 14.1.1. undefined
- 15. Middle East Water-Based Drilling and Completion Fluids Industry Analysis, Insights and Forecast, 2019-2031
- 15.1. Market Analysis, Insights and Forecast - By Country/Sub-region
- 15.1.1. undefined
- 16. Competitive Analysis
- 16.1. Global Market Share Analysis 2024
- 16.2. Company Profiles
- 16.2.1 CES Energy Solutions Corp
- 16.2.1.1. Overview
- 16.2.1.2. Products
- 16.2.1.3. SWOT Analysis
- 16.2.1.4. Recent Developments
- 16.2.1.5. Financials (Based on Availability)
- 16.2.2 Chevron Phillips Chemical Company LLC
- 16.2.2.1. Overview
- 16.2.2.2. Products
- 16.2.2.3. SWOT Analysis
- 16.2.2.4. Recent Developments
- 16.2.2.5. Financials (Based on Availability)
- 16.2.3 Tetra Technologies Inc
- 16.2.3.1. Overview
- 16.2.3.2. Products
- 16.2.3.3. SWOT Analysis
- 16.2.3.4. Recent Developments
- 16.2.3.5. Financials (Based on Availability)
- 16.2.4 Newpark Resources Inc
- 16.2.4.1. Overview
- 16.2.4.2. Products
- 16.2.4.3. SWOT Analysis
- 16.2.4.4. Recent Developments
- 16.2.4.5. Financials (Based on Availability)
- 16.2.5 National Oilwell Varco Inc *List Not Exhaustive
- 16.2.5.1. Overview
- 16.2.5.2. Products
- 16.2.5.3. SWOT Analysis
- 16.2.5.4. Recent Developments
- 16.2.5.5. Financials (Based on Availability)
- 16.2.6 Weatherford International PLC
- 16.2.6.1. Overview
- 16.2.6.2. Products
- 16.2.6.3. SWOT Analysis
- 16.2.6.4. Recent Developments
- 16.2.6.5. Financials (Based on Availability)
- 16.2.7 Baker Hughes Company
- 16.2.7.1. Overview
- 16.2.7.2. Products
- 16.2.7.3. SWOT Analysis
- 16.2.7.4. Recent Developments
- 16.2.7.5. Financials (Based on Availability)
- 16.2.8 Halliburton Company
- 16.2.8.1. Overview
- 16.2.8.2. Products
- 16.2.8.3. SWOT Analysis
- 16.2.8.4. Recent Developments
- 16.2.8.5. Financials (Based on Availability)
- 16.2.9 Schlumberger Limited
- 16.2.9.1. Overview
- 16.2.9.2. Products
- 16.2.9.3. SWOT Analysis
- 16.2.9.4. Recent Developments
- 16.2.9.5. Financials (Based on Availability)
- 16.2.1 CES Energy Solutions Corp
List of Figures
- Figure 1: Global Water-Based Drilling and Completion Fluids Industry Revenue Breakdown (Million, %) by Region 2024 & 2032
- Figure 2: North America Water-Based Drilling and Completion Fluids Industry Revenue (Million), by Country 2024 & 2032
- Figure 3: North America Water-Based Drilling and Completion Fluids Industry Revenue Share (%), by Country 2024 & 2032
- Figure 4: Europe Water-Based Drilling and Completion Fluids Industry Revenue (Million), by Country 2024 & 2032
- Figure 5: Europe Water-Based Drilling and Completion Fluids Industry Revenue Share (%), by Country 2024 & 2032
- Figure 6: Asia Pacific Water-Based Drilling and Completion Fluids Industry Revenue (Million), by Country 2024 & 2032
- Figure 7: Asia Pacific Water-Based Drilling and Completion Fluids Industry Revenue Share (%), by Country 2024 & 2032
- Figure 8: South America Water-Based Drilling and Completion Fluids Industry Revenue (Million), by Country 2024 & 2032
- Figure 9: South America Water-Based Drilling and Completion Fluids Industry Revenue Share (%), by Country 2024 & 2032
- Figure 10: Middle East Water-Based Drilling and Completion Fluids Industry Revenue (Million), by Country 2024 & 2032
- Figure 11: Middle East Water-Based Drilling and Completion Fluids Industry Revenue Share (%), by Country 2024 & 2032
- Figure 12: North America Water-Based Drilling and Completion Fluids Industry Revenue (Million), by Application 2024 & 2032
- Figure 13: North America Water-Based Drilling and Completion Fluids Industry Revenue Share (%), by Application 2024 & 2032
- Figure 14: North America Water-Based Drilling and Completion Fluids Industry Revenue (Million), by Fluid Type 2024 & 2032
- Figure 15: North America Water-Based Drilling and Completion Fluids Industry Revenue Share (%), by Fluid Type 2024 & 2032
- Figure 16: North America Water-Based Drilling and Completion Fluids Industry Revenue (Million), by Well Type 2024 & 2032
- Figure 17: North America Water-Based Drilling and Completion Fluids Industry Revenue Share (%), by Well Type 2024 & 2032
- Figure 18: North America Water-Based Drilling and Completion Fluids Industry Revenue (Million), by Country 2024 & 2032
- Figure 19: North America Water-Based Drilling and Completion Fluids Industry Revenue Share (%), by Country 2024 & 2032
- Figure 20: Europe Water-Based Drilling and Completion Fluids Industry Revenue (Million), by Application 2024 & 2032
- Figure 21: Europe Water-Based Drilling and Completion Fluids Industry Revenue Share (%), by Application 2024 & 2032
- Figure 22: Europe Water-Based Drilling and Completion Fluids Industry Revenue (Million), by Fluid Type 2024 & 2032
- Figure 23: Europe Water-Based Drilling and Completion Fluids Industry Revenue Share (%), by Fluid Type 2024 & 2032
- Figure 24: Europe Water-Based Drilling and Completion Fluids Industry Revenue (Million), by Well Type 2024 & 2032
- Figure 25: Europe Water-Based Drilling and Completion Fluids Industry Revenue Share (%), by Well Type 2024 & 2032
- Figure 26: Europe Water-Based Drilling and Completion Fluids Industry Revenue (Million), by Country 2024 & 2032
- Figure 27: Europe Water-Based Drilling and Completion Fluids Industry Revenue Share (%), by Country 2024 & 2032
- Figure 28: Asia Pacific Water-Based Drilling and Completion Fluids Industry Revenue (Million), by Application 2024 & 2032
- Figure 29: Asia Pacific Water-Based Drilling and Completion Fluids Industry Revenue Share (%), by Application 2024 & 2032
- Figure 30: Asia Pacific Water-Based Drilling and Completion Fluids Industry Revenue (Million), by Fluid Type 2024 & 2032
- Figure 31: Asia Pacific Water-Based Drilling and Completion Fluids Industry Revenue Share (%), by Fluid Type 2024 & 2032
- Figure 32: Asia Pacific Water-Based Drilling and Completion Fluids Industry Revenue (Million), by Well Type 2024 & 2032
- Figure 33: Asia Pacific Water-Based Drilling and Completion Fluids Industry Revenue Share (%), by Well Type 2024 & 2032
- Figure 34: Asia Pacific Water-Based Drilling and Completion Fluids Industry Revenue (Million), by Country 2024 & 2032
- Figure 35: Asia Pacific Water-Based Drilling and Completion Fluids Industry Revenue Share (%), by Country 2024 & 2032
- Figure 36: South America Water-Based Drilling and Completion Fluids Industry Revenue (Million), by Application 2024 & 2032
- Figure 37: South America Water-Based Drilling and Completion Fluids Industry Revenue Share (%), by Application 2024 & 2032
- Figure 38: South America Water-Based Drilling and Completion Fluids Industry Revenue (Million), by Fluid Type 2024 & 2032
- Figure 39: South America Water-Based Drilling and Completion Fluids Industry Revenue Share (%), by Fluid Type 2024 & 2032
- Figure 40: South America Water-Based Drilling and Completion Fluids Industry Revenue (Million), by Well Type 2024 & 2032
- Figure 41: South America Water-Based Drilling and Completion Fluids Industry Revenue Share (%), by Well Type 2024 & 2032
- Figure 42: South America Water-Based Drilling and Completion Fluids Industry Revenue (Million), by Country 2024 & 2032
- Figure 43: South America Water-Based Drilling and Completion Fluids Industry Revenue Share (%), by Country 2024 & 2032
- Figure 44: Middle East Water-Based Drilling and Completion Fluids Industry Revenue (Million), by Application 2024 & 2032
- Figure 45: Middle East Water-Based Drilling and Completion Fluids Industry Revenue Share (%), by Application 2024 & 2032
- Figure 46: Middle East Water-Based Drilling and Completion Fluids Industry Revenue (Million), by Fluid Type 2024 & 2032
- Figure 47: Middle East Water-Based Drilling and Completion Fluids Industry Revenue Share (%), by Fluid Type 2024 & 2032
- Figure 48: Middle East Water-Based Drilling and Completion Fluids Industry Revenue (Million), by Well Type 2024 & 2032
- Figure 49: Middle East Water-Based Drilling and Completion Fluids Industry Revenue Share (%), by Well Type 2024 & 2032
- Figure 50: Middle East Water-Based Drilling and Completion Fluids Industry Revenue (Million), by Country 2024 & 2032
- Figure 51: Middle East Water-Based Drilling and Completion Fluids Industry Revenue Share (%), by Country 2024 & 2032
List of Tables
- Table 1: Global Water-Based Drilling and Completion Fluids Industry Revenue Million Forecast, by Region 2019 & 2032
- Table 2: Global Water-Based Drilling and Completion Fluids Industry Revenue Million Forecast, by Application 2019 & 2032
- Table 3: Global Water-Based Drilling and Completion Fluids Industry Revenue Million Forecast, by Fluid Type 2019 & 2032
- Table 4: Global Water-Based Drilling and Completion Fluids Industry Revenue Million Forecast, by Well Type 2019 & 2032
- Table 5: Global Water-Based Drilling and Completion Fluids Industry Revenue Million Forecast, by Region 2019 & 2032
- Table 6: Global Water-Based Drilling and Completion Fluids Industry Revenue Million Forecast, by Country 2019 & 2032
- Table 7: Global Water-Based Drilling and Completion Fluids Industry Revenue Million Forecast, by Country 2019 & 2032
- Table 8: Global Water-Based Drilling and Completion Fluids Industry Revenue Million Forecast, by Country 2019 & 2032
- Table 9: Global Water-Based Drilling and Completion Fluids Industry Revenue Million Forecast, by Country 2019 & 2032
- Table 10: Global Water-Based Drilling and Completion Fluids Industry Revenue Million Forecast, by Country 2019 & 2032
- Table 11: Global Water-Based Drilling and Completion Fluids Industry Revenue Million Forecast, by Application 2019 & 2032
- Table 12: Global Water-Based Drilling and Completion Fluids Industry Revenue Million Forecast, by Fluid Type 2019 & 2032
- Table 13: Global Water-Based Drilling and Completion Fluids Industry Revenue Million Forecast, by Well Type 2019 & 2032
- Table 14: Global Water-Based Drilling and Completion Fluids Industry Revenue Million Forecast, by Country 2019 & 2032
- Table 15: Global Water-Based Drilling and Completion Fluids Industry Revenue Million Forecast, by Application 2019 & 2032
- Table 16: Global Water-Based Drilling and Completion Fluids Industry Revenue Million Forecast, by Fluid Type 2019 & 2032
- Table 17: Global Water-Based Drilling and Completion Fluids Industry Revenue Million Forecast, by Well Type 2019 & 2032
- Table 18: Global Water-Based Drilling and Completion Fluids Industry Revenue Million Forecast, by Country 2019 & 2032
- Table 19: Global Water-Based Drilling and Completion Fluids Industry Revenue Million Forecast, by Application 2019 & 2032
- Table 20: Global Water-Based Drilling and Completion Fluids Industry Revenue Million Forecast, by Fluid Type 2019 & 2032
- Table 21: Global Water-Based Drilling and Completion Fluids Industry Revenue Million Forecast, by Well Type 2019 & 2032
- Table 22: Global Water-Based Drilling and Completion Fluids Industry Revenue Million Forecast, by Country 2019 & 2032
- Table 23: Global Water-Based Drilling and Completion Fluids Industry Revenue Million Forecast, by Application 2019 & 2032
- Table 24: Global Water-Based Drilling and Completion Fluids Industry Revenue Million Forecast, by Fluid Type 2019 & 2032
- Table 25: Global Water-Based Drilling and Completion Fluids Industry Revenue Million Forecast, by Well Type 2019 & 2032
- Table 26: Global Water-Based Drilling and Completion Fluids Industry Revenue Million Forecast, by Country 2019 & 2032
- Table 27: Global Water-Based Drilling and Completion Fluids Industry Revenue Million Forecast, by Application 2019 & 2032
- Table 28: Global Water-Based Drilling and Completion Fluids Industry Revenue Million Forecast, by Fluid Type 2019 & 2032
- Table 29: Global Water-Based Drilling and Completion Fluids Industry Revenue Million Forecast, by Well Type 2019 & 2032
- Table 30: Global Water-Based Drilling and Completion Fluids Industry Revenue Million Forecast, by Country 2019 & 2032
Frequently Asked Questions
1. What is the projected Compound Annual Growth Rate (CAGR) of the Water-Based Drilling and Completion Fluids Industry?
The projected CAGR is approximately > 5.00%.
2. Which companies are prominent players in the Water-Based Drilling and Completion Fluids Industry?
Key companies in the market include CES Energy Solutions Corp, Chevron Phillips Chemical Company LLC, Tetra Technologies Inc, Newpark Resources Inc, National Oilwell Varco Inc *List Not Exhaustive, Weatherford International PLC, Baker Hughes Company, Halliburton Company, Schlumberger Limited.
3. What are the main segments of the Water-Based Drilling and Completion Fluids Industry?
The market segments include Application, Fluid Type, Well Type.
4. Can you provide details about the market size?
The market size is estimated to be USD XX Million as of 2022.
5. What are some drivers contributing to market growth?
4.; Rapid Recovery in the Oil and Gas and Mining Industries4.; Surge in the Construction Industry.
6. What are the notable trends driving market growth?
Onshore Segment to Dominate the Market.
7. Are there any restraints impacting market growth?
4.; High Maintenance and Operation Costs of Submersible Pump Restrain the Market.
8. Can you provide examples of recent developments in the market?
In November 2021, Danish offshore drilling contractor Maersk Drilling announced that it had entered a definitive agreement to merge with its US rival Noble Corporation in a primarily all-stock transaction, which will result in the creation of a combined company with a fleet of 20 floaters and 19 jack-up rigs.
9. What pricing options are available for accessing the report?
Pricing options include single-user, multi-user, and enterprise licenses priced at USD 4750, USD 5250, and USD 8750 respectively.
10. Is the market size provided in terms of value or volume?
The market size is provided in terms of value, measured in Million.
11. Are there any specific market keywords associated with the report?
Yes, the market keyword associated with the report is "Water-Based Drilling and Completion Fluids Industry," which aids in identifying and referencing the specific market segment covered.
12. How do I determine which pricing option suits my needs best?
The pricing options vary based on user requirements and access needs. Individual users may opt for single-user licenses, while businesses requiring broader access may choose multi-user or enterprise licenses for cost-effective access to the report.
13. Are there any additional resources or data provided in the Water-Based Drilling and Completion Fluids Industry report?
While the report offers comprehensive insights, it's advisable to review the specific contents or supplementary materials provided to ascertain if additional resources or data are available.
14. How can I stay updated on further developments or reports in the Water-Based Drilling and Completion Fluids Industry?
To stay informed about further developments, trends, and reports in the Water-Based Drilling and Completion Fluids Industry, consider subscribing to industry newsletters, following relevant companies and organizations, or regularly checking reputable industry news sources and publications.
Methodology
Step 1 - Identification of Relevant Samples Size from Population Database


Step 2 - Approaches for Defining Global Market Size (Value, Volume* & Price*)

Note*: In applicable scenarios
Step 3 - Data Sources
Primary Research
- Web Analytics
- Survey Reports
- Research Institute
- Latest Research Reports
- Opinion Leaders
Secondary Research
- Annual Reports
- White Paper
- Latest Press Release
- Industry Association
- Paid Database
- Investor Presentations

Step 4 - Data Triangulation
Involves using different sources of information in order to increase the validity of a study
These sources are likely to be stakeholders in a program - participants, other researchers, program staff, other community members, and so on.
Then we put all data in single framework & apply various statistical tools to find out the dynamic on the market.
During the analysis stage, feedback from the stakeholder groups would be compared to determine areas of agreement as well as areas of divergence


