

Key Insights
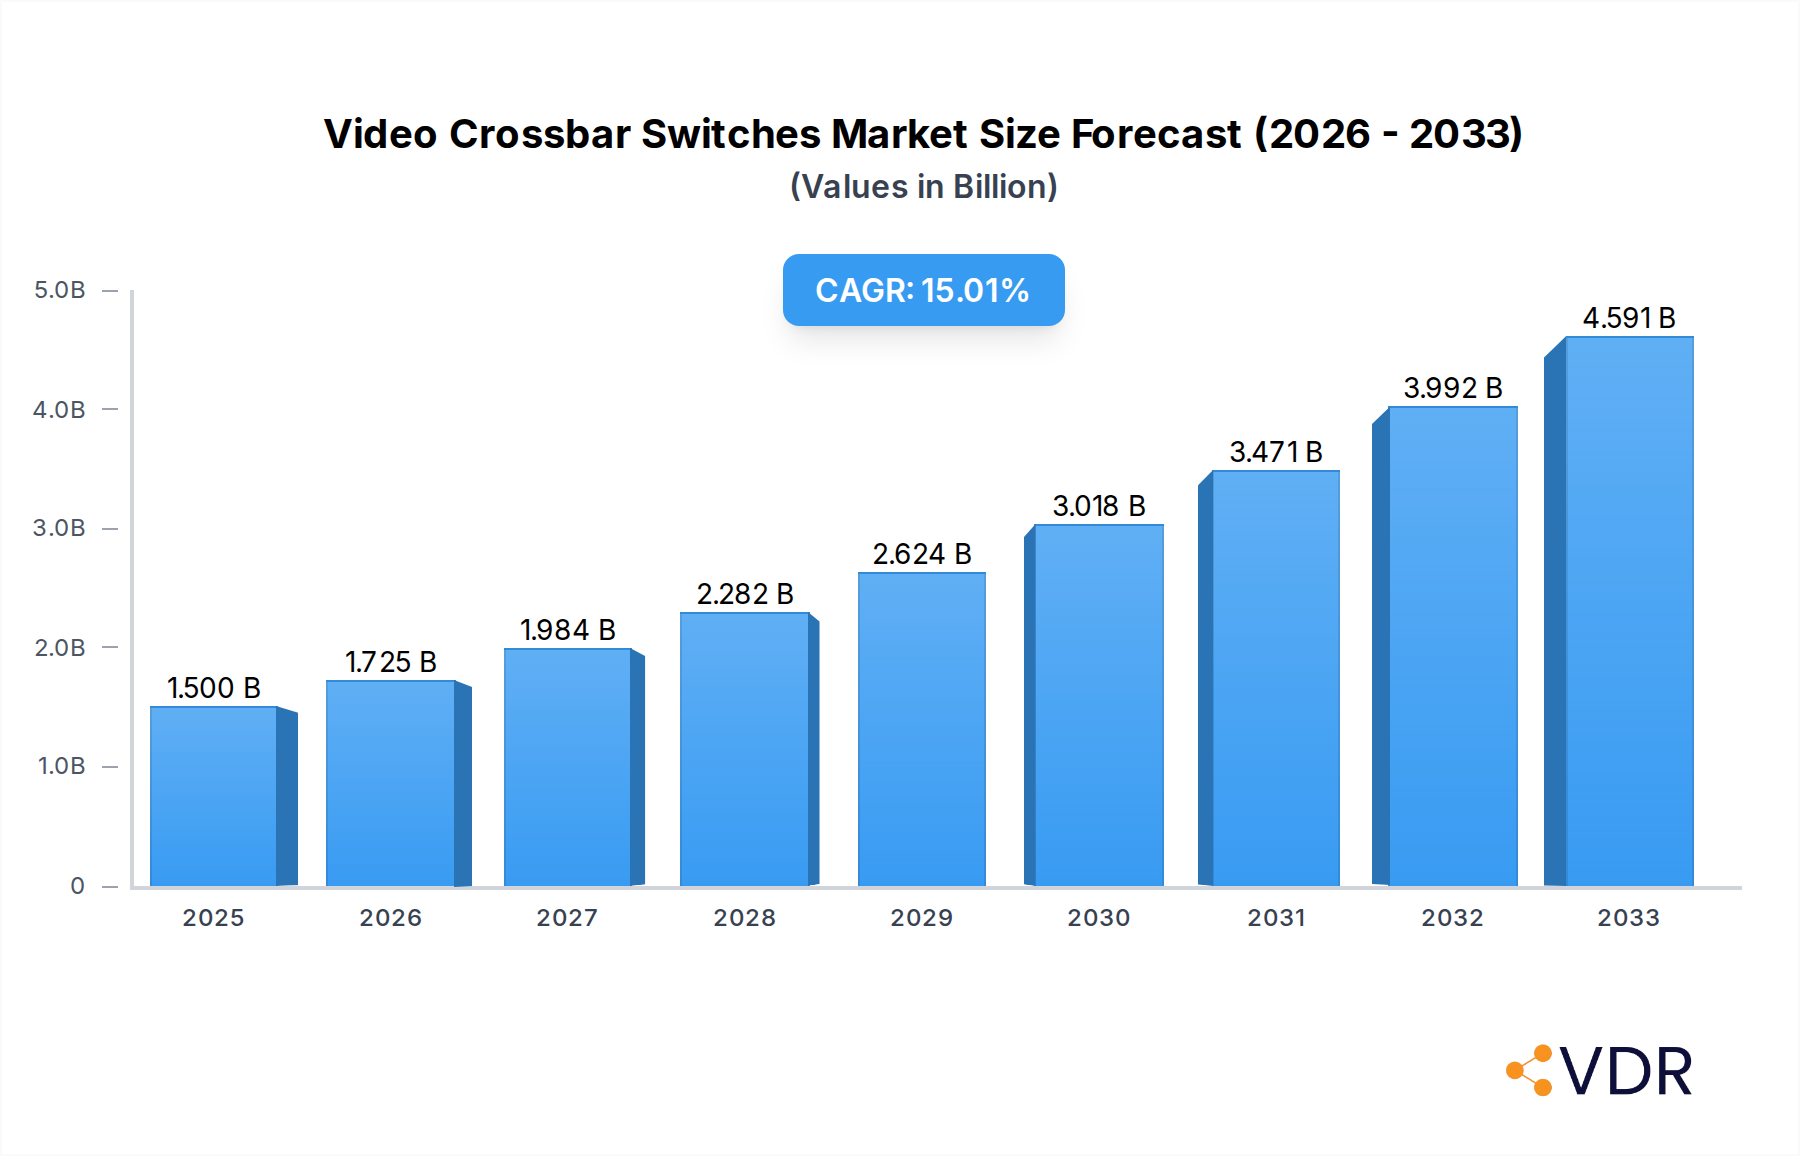
The global Video Crossbar Switches market is poised for robust expansion, with an estimated market size of $1.5 billion in 2025. This growth is fueled by an impressive CAGR of 15% projected over the forecast period of 2025-2033. Key drivers for this surge include the escalating demand for high-bandwidth video processing and distribution across various sectors, most notably within Internet Service Providers and Data Centers. The proliferation of 4K and 8K video content, coupled with the increasing adoption of advanced video analytics and content delivery networks, necessitates sophisticated switching solutions. Furthermore, the continuous evolution of telecommunications infrastructure, including the rollout of 5G networks and the expansion of telecom central offices, creates a significant demand for reliable and high-performance video crossbar switches to manage complex video traffic flows. The expanding adoption of these switches in other emerging applications further solidifies their growth trajectory.

Video Crossbar Switches Market Size (In Billion)
The market's positive outlook is further supported by several key trends. The increasing miniaturization and integration of video crossbar switch components are enabling more compact and power-efficient solutions, catering to space-constrained applications. Advancements in semiconductor technology are leading to higher port densities and enhanced signal integrity, crucial for handling the ever-increasing volume and complexity of video data. While the market is experiencing strong growth, potential restraints such as the high cost of advanced switching solutions and the need for specialized technical expertise for implementation and maintenance could pose challenges. However, these are largely mitigated by the clear benefits of improved video quality, reduced latency, and enhanced network flexibility that video crossbar switches offer. The competitive landscape features prominent players like Analog Devices, MACOM, and Renesas Electronics, who are actively innovating to meet the evolving needs of this dynamic market.
Video Crossbar Switches Company Market Share
Unlocking the Future of Video Connectivity: A Comprehensive Report on Video Crossbar Switches
This in-depth report provides an unparalleled analysis of the global Video Crossbar Switches market, offering critical insights for industry leaders, investors, and technology strategists. Covering a comprehensive study period from 2019–2033, with a base year of 2025, this report dissects market dynamics, growth trajectories, and competitive landscapes. We explore the intricate parent and child market structures, delivering actionable intelligence on the evolution of high-performance video routing solutions.
Video Crossbar Switches Market Dynamics & Structure
The global Video Crossbar Switches market, a critical component within the broader semiconductor and networking infrastructure landscape, exhibits a moderate concentration. Leading players like Analog Devices, MACOM, Renesas Electronics, Onsemi, Frontgrade, and Texas Instruments (TI) dominate key segments, driven by continuous technological innovation in high-bandwidth, low-latency video signal routing. The primary innovation drivers revolve around increasing resolution standards (4K, 8K), higher frame rates, and the integration of advanced features like HDR and AI-driven signal processing. Regulatory frameworks, while generally enabling, primarily focus on interoperability standards and electromagnetic compatibility, influencing product design rather than market access. Competitive product substitutes, such as dedicated matrix switchers or software-defined networking (SDN) solutions for certain applications, present a nuanced competitive pressure, though dedicated crossbar switches excel in dedicated, high-density video environments. End-user demographics are increasingly sophisticated, demanding seamless integration, reliability, and scalability across Internet Service Providers (ISPs), Data Centers, Telecom Central Offices, and other specialized verticals. Merger and acquisition (M&A) activity, while not rampant, has historically focused on acquiring niche technological expertise or expanding product portfolios, with an estimated XX deal volumes in the historical period. Barriers to innovation include the significant R&D investment required for next-generation silicon and the long qualification cycles in demanding enterprise and telecom environments.
Video Crossbar Switches Growth Trends & Insights
The Video Crossbar Switches market is poised for significant expansion, projected to reach substantial billion-dollar valuations by 2033. This growth is fueled by an escalating demand for high-definition and ultra-high-definition video content delivery, coupled with the burgeoning requirements of data centers for efficient internal data flow and communication. The CAGR is estimated to be a robust XX% over the forecast period (2025-2033). Adoption rates for advanced video switching solutions are accelerating, driven by the need for greater bandwidth and lower latency in applications ranging from professional broadcasting and media production to advanced telecommunications and enterprise collaboration. Technological disruptions, including the transition to IP-based video infrastructure and the increasing adoption of software-defined solutions, are reshaping the market, pushing crossbar switch manufacturers to innovate with more intelligent and flexible architectures. Consumer behavior shifts are also indirectly influencing this market, as the demand for immersive and high-quality video experiences from end-users translates into higher performance requirements for the underlying infrastructure. Market penetration of advanced crossbar switch solutions is expected to surge, particularly within the data center and ISP segments, as these sectors grapple with unprecedented video traffic volumes. The historical period (2019-2024) laid the groundwork for this growth, characterized by steady technological advancements and increasing adoption in niche, high-performance applications. The estimated market size for 2025 is xx billion dollars, with projected growth to xx billion dollars by 2033.
Dominant Regions, Countries, or Segments in Video Crossbar Switches
The Data Centers segment stands as a primary growth engine and dominant force within the Video Crossbar Switches market. The insatiable demand for data storage, processing, and rapid retrieval, coupled with the increasing reliance on video-based applications within cloud computing and artificial intelligence workloads, necessitates high-performance, scalable video routing. Data centers require robust solutions capable of handling massive amounts of video data, both for internal operations and for delivering video services to end-users. This translates into a significant market share for crossbar switches designed for high port density and advanced signal integrity. The 160x160 and 288x288 types of video crossbar switches are particularly dominant in this segment, offering the scalability and flexibility required to manage complex internal data flows.
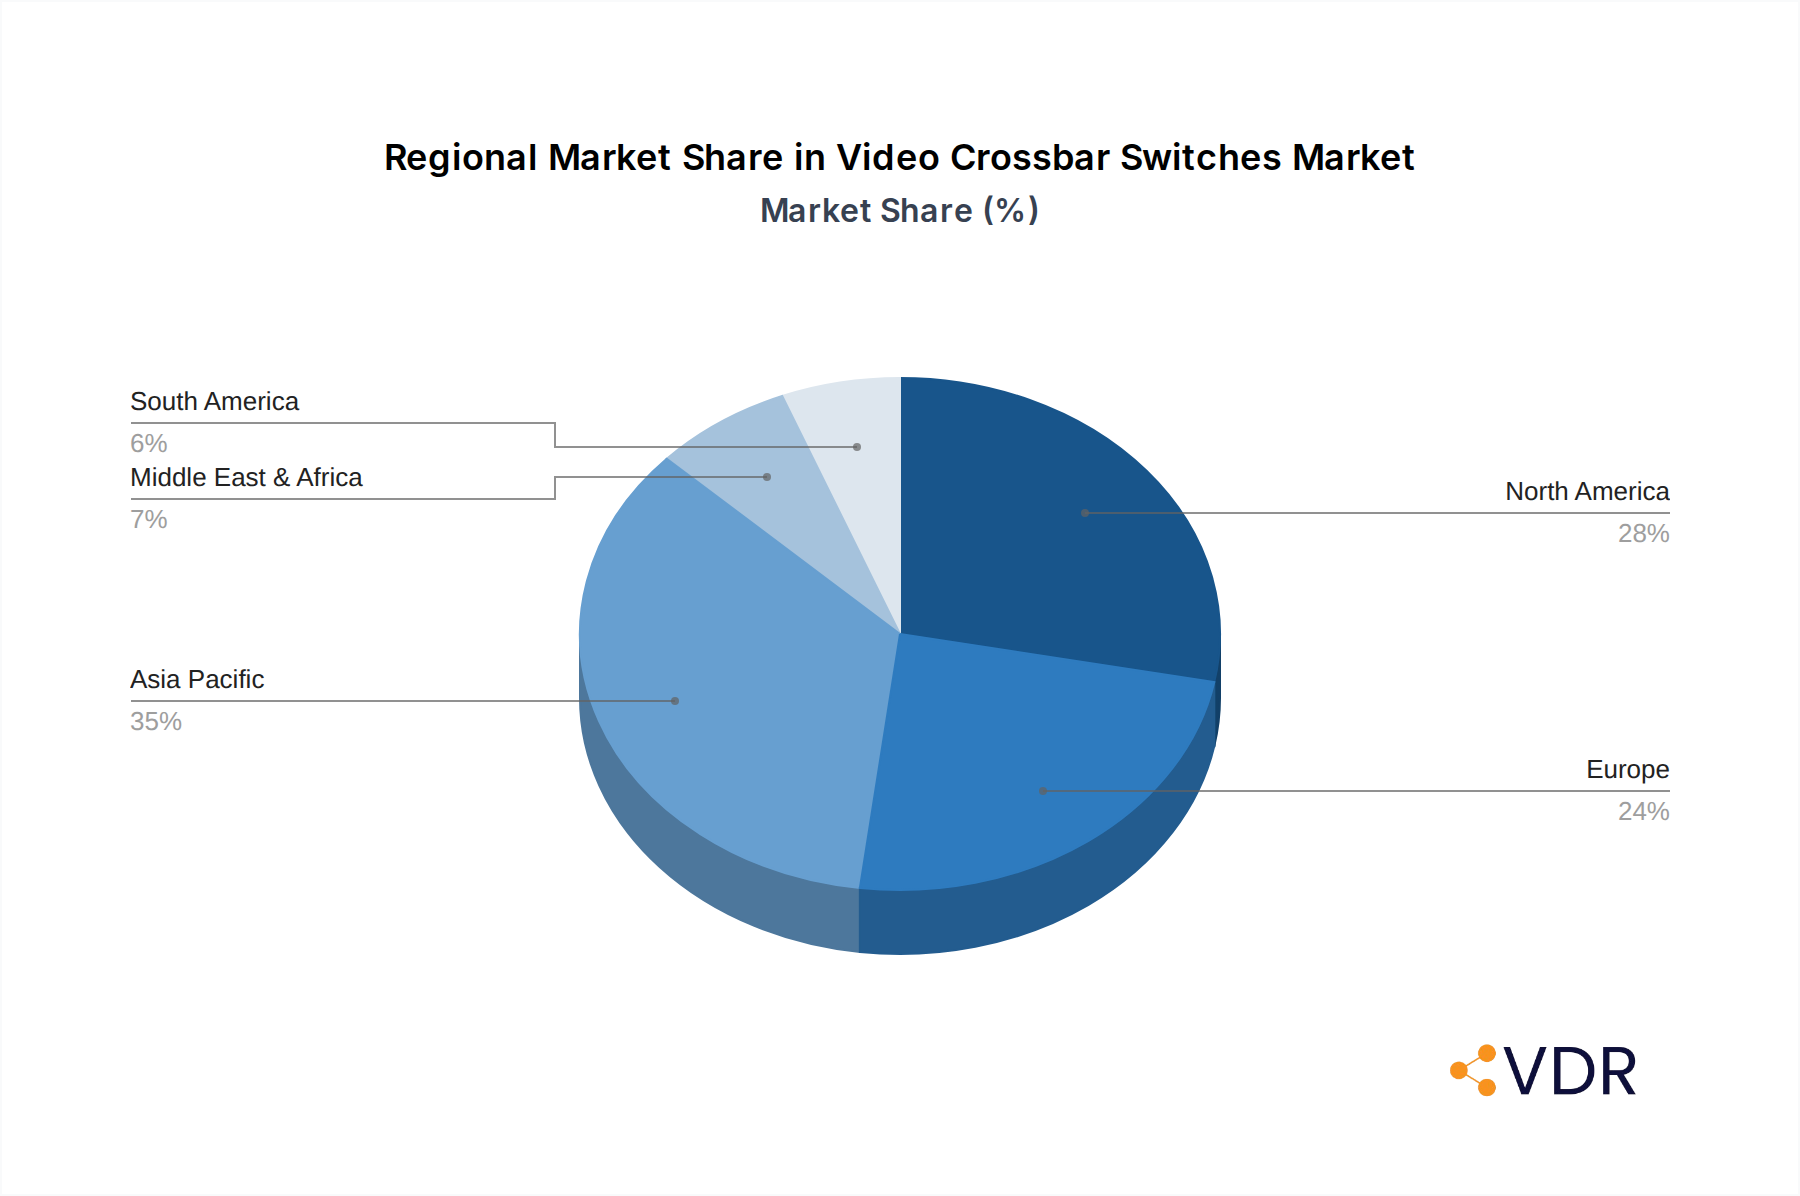
North America, particularly the United States, is a leading region in this market, driven by the concentration of major data center operators, leading internet service providers, and a mature telecommunications infrastructure. Government initiatives promoting digital transformation and investments in high-speed internet infrastructure further bolster the demand for advanced video switching technologies. Economic policies that encourage technological innovation and infrastructure development create a fertile ground for market expansion.
In the Internet Service Providers (ISPs) segment, the increasing adoption of high-definition television (HDTV), 4K streaming, and the growing prevalence of video-on-demand services are directly fueling the need for efficient video signal management at central offices and content delivery networks. ISPs are investing heavily in upgrading their infrastructure to handle the escalating video traffic, making crossbar switches an indispensable part of their network architecture.
The Telecom Central Offices segment also plays a crucial role, as these facilities are the backbone of communication networks. With the convergence of voice, data, and video services, telecom operators require sophisticated switching solutions to manage and route these diverse traffic streams efficiently. The push towards 5G deployment and the increasing use of video conferencing and collaboration tools further amplify the demand for high-density, high-performance video crossbar switches in this sector. The growth potential in these segments is substantial, with ongoing technological advancements and increasing market penetration expected to drive significant revenue streams in the coming years.
Video Crossbar Switches Product Landscape
The Video Crossbar Switches product landscape is characterized by a relentless pursuit of higher bandwidth, lower latency, and enhanced signal integrity. Innovations are focused on supporting emerging video standards like 8K resolution and high dynamic range (HDR) content, while also ensuring backward compatibility with existing infrastructure. Key product differentiators include advanced signal conditioning, built-in error correction, and seamless switching capabilities that minimize signal degradation during transitions. These switches are critical for applications demanding uncompromised video quality and real-time performance, such as live broadcasting, professional video production, medical imaging, and advanced simulation environments. The unique selling propositions lie in their ability to provide flexible, non-blocking routing of multiple high-definition video streams, ensuring optimal performance and reliability in mission-critical environments.
Key Drivers, Barriers & Challenges in Video Crossbar Switches
The Video Crossbar Switches market is propelled by several key drivers, primarily the exponential growth in video content consumption and the increasing demand for high-resolution video across various applications, including broadcasting, data centers, and telecommunications. The ongoing transition to IP-based video infrastructure further necessitates robust switching solutions for efficient signal management. Technological advancements, such as the development of higher bandwidth interfaces and improved signal processing capabilities, are also significant growth accelerators.
Conversely, the market faces several challenges and restraints. High development costs associated with advanced semiconductor fabrication can lead to premium pricing, potentially limiting adoption in cost-sensitive segments. Supply chain complexities and the risk of component shortages, exacerbated by global geopolitical factors, pose a persistent threat to production and delivery timelines, impacting overall market growth. Regulatory hurdles related to electromagnetic interference (EMI) and safety standards, while necessary, can also add to development time and cost. Competitive pressures from alternative switching technologies and the long qualification cycles in enterprise and telecom sectors further present significant restraints.
Emerging Opportunities in Video Crossbar Switches
Emerging opportunities in the Video Crossbar Switches sector are largely driven by the burgeoning adoption of immersive technologies and the expansion of cloud-based video services. The growth of virtual reality (VR) and augmented reality (AR) applications in gaming, entertainment, and enterprise training creates a demand for ultra-low latency, high-resolution video switching. Furthermore, the increasing use of AI and machine learning in video analytics and content moderation within data centers presents new avenues for sophisticated crossbar switch integration. The expansion of edge computing also opens opportunities for compact, high-performance video switching solutions at the network edge, enabling real-time video processing closer to the source.
Growth Accelerators in the Video Crossbar Switches Industry
Long-term growth in the Video Crossbar Switches industry will be significantly accelerated by breakthroughs in advanced packaging technologies, enabling higher port densities and improved thermal management within smaller footprints. Strategic partnerships between semiconductor manufacturers and system integrators are crucial for developing tailored solutions that meet the evolving needs of specific market verticals. The continued expansion of 5G networks and the subsequent proliferation of mobile video consumption will also act as a powerful growth catalyst, driving demand for efficient video routing at the network core and edge. Furthermore, the increasing adoption of Software-Defined Networking (SDN) principles in video infrastructure will lead to more dynamic and intelligent crossbar switch solutions, enhancing flexibility and operational efficiency.
Key Players Shaping the Video Crossbar Switches Market
- Analog Devices
- MACOM
- Renesas Electronics
- Onsemi
- Frontgrade
- Texas Instruments
- Semtech
- Microsemi
- Lattice
- Microchip
- STMicroelectronics
Notable Milestones in Video Crossbar Switches Sector
- 2019: Increased focus on 4K/UHD support and integration of advanced signal integrity features in enterprise-grade switches.
- 2020: Emergence of higher port density solutions (e.g., 160x160 and above) to address growing data center needs.
- 2021: Advancements in low-power consumption designs for energy-efficient data center operations.
- 2022: Introduction of switches with enhanced programmability and support for emerging IP-based video protocols.
- 2023: Growing demand for solutions catering to the expansion of professional broadcast infrastructure and cloud video production.
- 2024: Anticipated introduction of switches with improved AI/ML capabilities for video analytics integration.
In-Depth Video Crossbar Switches Market Outlook
The future outlook for the Video Crossbar Switches market is exceptionally promising, driven by pervasive trends in digital transformation and the escalating importance of high-quality video communication. The increasing demand for immersive experiences in entertainment, gaming, and enterprise collaboration, coupled with the exponential growth of video data within data centers, will continue to fuel market expansion. Strategic investments in next-generation network infrastructure by ISPs and telecom operators will further solidify the need for advanced and scalable video routing solutions. Opportunities arising from the integration of AI-powered video analytics and the development of specialized crossbar switches for edge computing environments represent significant avenues for future growth. The market is expected to witness continuous innovation, focusing on enhanced performance, reduced latency, and greater integration capabilities to meet the evolving demands of a video-centric world.
Video Crossbar Switches Segmentation
-
1. Application
- 1.1. Internet Service Providers
- 1.2. Data Centers
- 1.3. Telecom Central Offices
- 1.4. Others
-
2. Types
- 2.1. 16x16
- 2.2. 80x80
- 2.3. 160x160
- 2.4. 288x288
- 2.5. Others
Video Crossbar Switches Segmentation By Geography
-
1. North America
- 1.1. United States
- 1.2. Canada
- 1.3. Mexico
-
2. South America
- 2.1. Brazil
- 2.2. Argentina
- 2.3. Rest of South America
-
3. Europe
- 3.1. United Kingdom
- 3.2. Germany
- 3.3. France
- 3.4. Italy
- 3.5. Spain
- 3.6. Russia
- 3.7. Benelux
- 3.8. Nordics
- 3.9. Rest of Europe
-
4. Middle East & Africa
- 4.1. Turkey
- 4.2. Israel
- 4.3. GCC
- 4.4. North Africa
- 4.5. South Africa
- 4.6. Rest of Middle East & Africa
-
5. Asia Pacific
- 5.1. China
- 5.2. India
- 5.3. Japan
- 5.4. South Korea
- 5.5. ASEAN
- 5.6. Oceania
- 5.7. Rest of Asia Pacific
Video Crossbar Switches Regional Market Share
Geographic Coverage of Video Crossbar Switches
Video Crossbar Switches REPORT HIGHLIGHTS
| Aspects | Details |
|---|---|
| Study Period | 2020-2034 |
| Base Year | 2025 |
| Estimated Year | 2026 |
| Forecast Period | 2026-2034 |
| Historical Period | 2020-2025 |
| Growth Rate | CAGR of 15% from 2020-2034 |
| Segmentation |
|
Table of Contents
- 1. Introduction
- 1.1. Research Scope
- 1.2. Market Segmentation
- 1.3. Research Objective
- 1.4. Definitions and Assumptions
- 2. Executive Summary
- 2.1. Market Snapshot
- 3. Market Dynamics
- 3.1. Market Drivers
- 3.2. Market Restrains
- 3.3. Market Trends
- 3.4. Market Opportunities
- 4. Market Factor Analysis
- 4.1. Porters Five Forces
- 4.1.1. Bargaining Power of Suppliers
- 4.1.2. Bargaining Power of Buyers
- 4.1.3. Threat of New Entrants
- 4.1.4. Threat of Substitutes
- 4.1.5. Competitive Rivalry
- 4.2. PESTEL analysis
- 4.3. BCG Analysis
- 4.3.1. Stars (High Growth, High Market Share)
- 4.3.2. Cash Cows (Low Growth, High Market Share)
- 4.3.3. Question Mark (High Growth, Low Market Share)
- 4.3.4. Dogs (Low Growth, Low Market Share)
- 4.4. Ansoff Matrix Analysis
- 4.5. Supply Chain Analysis
- 4.6. Regulatory Landscape
- 4.7. Current Market Potential and Opportunity Assessment (TAM–SAM–SOM Framework)
- 4.8. VDR Analyst Note
- 4.1. Porters Five Forces
- 5. Market Analysis, Insights and Forecast 2021-2033
- 5.1. Market Analysis, Insights and Forecast - by Application
- 5.1.1. Internet Service Providers
- 5.1.2. Data Centers
- 5.1.3. Telecom Central Offices
- 5.1.4. Others
- 5.2. Market Analysis, Insights and Forecast - by Types
- 5.2.1. 16x16
- 5.2.2. 80x80
- 5.2.3. 160x160
- 5.2.4. 288x288
- 5.2.5. Others
- 5.3. Market Analysis, Insights and Forecast - by Region
- 5.3.1. North America
- 5.3.2. South America
- 5.3.3. Europe
- 5.3.4. Middle East & Africa
- 5.3.5. Asia Pacific
- 5.1. Market Analysis, Insights and Forecast - by Application
- 6. Global Video Crossbar Switches Analysis, Insights and Forecast, 2021-2033
- 6.1. Market Analysis, Insights and Forecast - by Application
- 6.1.1. Internet Service Providers
- 6.1.2. Data Centers
- 6.1.3. Telecom Central Offices
- 6.1.4. Others
- 6.2. Market Analysis, Insights and Forecast - by Types
- 6.2.1. 16x16
- 6.2.2. 80x80
- 6.2.3. 160x160
- 6.2.4. 288x288
- 6.2.5. Others
- 6.1. Market Analysis, Insights and Forecast - by Application
- 7. North America Video Crossbar Switches Analysis, Insights and Forecast, 2021-2033
- 7.1. Market Analysis, Insights and Forecast - by Application
- 7.1.1. Internet Service Providers
- 7.1.2. Data Centers
- 7.1.3. Telecom Central Offices
- 7.1.4. Others
- 7.2. Market Analysis, Insights and Forecast - by Types
- 7.2.1. 16x16
- 7.2.2. 80x80
- 7.2.3. 160x160
- 7.2.4. 288x288
- 7.2.5. Others
- 7.1. Market Analysis, Insights and Forecast - by Application
- 8. South America Video Crossbar Switches Analysis, Insights and Forecast, 2021-2033
- 8.1. Market Analysis, Insights and Forecast - by Application
- 8.1.1. Internet Service Providers
- 8.1.2. Data Centers
- 8.1.3. Telecom Central Offices
- 8.1.4. Others
- 8.2. Market Analysis, Insights and Forecast - by Types
- 8.2.1. 16x16
- 8.2.2. 80x80
- 8.2.3. 160x160
- 8.2.4. 288x288
- 8.2.5. Others
- 8.1. Market Analysis, Insights and Forecast - by Application
- 9. Europe Video Crossbar Switches Analysis, Insights and Forecast, 2021-2033
- 9.1. Market Analysis, Insights and Forecast - by Application
- 9.1.1. Internet Service Providers
- 9.1.2. Data Centers
- 9.1.3. Telecom Central Offices
- 9.1.4. Others
- 9.2. Market Analysis, Insights and Forecast - by Types
- 9.2.1. 16x16
- 9.2.2. 80x80
- 9.2.3. 160x160
- 9.2.4. 288x288
- 9.2.5. Others
- 9.1. Market Analysis, Insights and Forecast - by Application
- 10. Middle East & Africa Video Crossbar Switches Analysis, Insights and Forecast, 2021-2033
- 10.1. Market Analysis, Insights and Forecast - by Application
- 10.1.1. Internet Service Providers
- 10.1.2. Data Centers
- 10.1.3. Telecom Central Offices
- 10.1.4. Others
- 10.2. Market Analysis, Insights and Forecast - by Types
- 10.2.1. 16x16
- 10.2.2. 80x80
- 10.2.3. 160x160
- 10.2.4. 288x288
- 10.2.5. Others
- 10.1. Market Analysis, Insights and Forecast - by Application
- 11. Asia Pacific Video Crossbar Switches Analysis, Insights and Forecast, 2021-2033
- 11.1. Market Analysis, Insights and Forecast - by Application
- 11.1.1. Internet Service Providers
- 11.1.2. Data Centers
- 11.1.3. Telecom Central Offices
- 11.1.4. Others
- 11.2. Market Analysis, Insights and Forecast - by Types
- 11.2.1. 16x16
- 11.2.2. 80x80
- 11.2.3. 160x160
- 11.2.4. 288x288
- 11.2.5. Others
- 11.1. Market Analysis, Insights and Forecast - by Application
- 12. Competitive Analysis
- 12.1. Company Profiles
- 12.1.1 Analog Devices
- 12.1.1.1. Company Overview
- 12.1.1.2. Products
- 12.1.1.3. Company Financials
- 12.1.1.4. SWOT Analysis
- 12.1.2 MACOM
- 12.1.2.1. Company Overview
- 12.1.2.2. Products
- 12.1.2.3. Company Financials
- 12.1.2.4. SWOT Analysis
- 12.1.3 Renesas Electronics
- 12.1.3.1. Company Overview
- 12.1.3.2. Products
- 12.1.3.3. Company Financials
- 12.1.3.4. SWOT Analysis
- 12.1.4 Onsemi
- 12.1.4.1. Company Overview
- 12.1.4.2. Products
- 12.1.4.3. Company Financials
- 12.1.4.4. SWOT Analysis
- 12.1.5 Frontgrade
- 12.1.5.1. Company Overview
- 12.1.5.2. Products
- 12.1.5.3. Company Financials
- 12.1.5.4. SWOT Analysis
- 12.1.6 TI
- 12.1.6.1. Company Overview
- 12.1.6.2. Products
- 12.1.6.3. Company Financials
- 12.1.6.4. SWOT Analysis
- 12.1.7 Semtech
- 12.1.7.1. Company Overview
- 12.1.7.2. Products
- 12.1.7.3. Company Financials
- 12.1.7.4. SWOT Analysis
- 12.1.8 Microsemi
- 12.1.8.1. Company Overview
- 12.1.8.2. Products
- 12.1.8.3. Company Financials
- 12.1.8.4. SWOT Analysis
- 12.1.9 Lattice
- 12.1.9.1. Company Overview
- 12.1.9.2. Products
- 12.1.9.3. Company Financials
- 12.1.9.4. SWOT Analysis
- 12.1.10 Microchip
- 12.1.10.1. Company Overview
- 12.1.10.2. Products
- 12.1.10.3. Company Financials
- 12.1.10.4. SWOT Analysis
- 12.1.11 STMicroelectronics
- 12.1.11.1. Company Overview
- 12.1.11.2. Products
- 12.1.11.3. Company Financials
- 12.1.11.4. SWOT Analysis
- 12.1.1 Analog Devices
- 12.2. Market Entropy
- 12.2.1 Company's Key Areas Served
- 12.2.2 Recent Developments
- 12.3. Company Market Share Analysis 2025
- 12.3.1 Top 5 Companies Market Share Analysis
- 12.3.2 Top 3 Companies Market Share Analysis
- 12.4. List of Potential Customers
- 13. Research Methodology
List of Figures
- Figure 1: Global Video Crossbar Switches Revenue Breakdown (undefined, %) by Region 2025 & 2033
- Figure 2: Global Video Crossbar Switches Volume Breakdown (K, %) by Region 2025 & 2033
- Figure 3: North America Video Crossbar Switches Revenue (undefined), by Application 2025 & 2033
- Figure 4: North America Video Crossbar Switches Volume (K), by Application 2025 & 2033
- Figure 5: North America Video Crossbar Switches Revenue Share (%), by Application 2025 & 2033
- Figure 6: North America Video Crossbar Switches Volume Share (%), by Application 2025 & 2033
- Figure 7: North America Video Crossbar Switches Revenue (undefined), by Types 2025 & 2033
- Figure 8: North America Video Crossbar Switches Volume (K), by Types 2025 & 2033
- Figure 9: North America Video Crossbar Switches Revenue Share (%), by Types 2025 & 2033
- Figure 10: North America Video Crossbar Switches Volume Share (%), by Types 2025 & 2033
- Figure 11: North America Video Crossbar Switches Revenue (undefined), by Country 2025 & 2033
- Figure 12: North America Video Crossbar Switches Volume (K), by Country 2025 & 2033
- Figure 13: North America Video Crossbar Switches Revenue Share (%), by Country 2025 & 2033
- Figure 14: North America Video Crossbar Switches Volume Share (%), by Country 2025 & 2033
- Figure 15: South America Video Crossbar Switches Revenue (undefined), by Application 2025 & 2033
- Figure 16: South America Video Crossbar Switches Volume (K), by Application 2025 & 2033
- Figure 17: South America Video Crossbar Switches Revenue Share (%), by Application 2025 & 2033
- Figure 18: South America Video Crossbar Switches Volume Share (%), by Application 2025 & 2033
- Figure 19: South America Video Crossbar Switches Revenue (undefined), by Types 2025 & 2033
- Figure 20: South America Video Crossbar Switches Volume (K), by Types 2025 & 2033
- Figure 21: South America Video Crossbar Switches Revenue Share (%), by Types 2025 & 2033
- Figure 22: South America Video Crossbar Switches Volume Share (%), by Types 2025 & 2033
- Figure 23: South America Video Crossbar Switches Revenue (undefined), by Country 2025 & 2033
- Figure 24: South America Video Crossbar Switches Volume (K), by Country 2025 & 2033
- Figure 25: South America Video Crossbar Switches Revenue Share (%), by Country 2025 & 2033
- Figure 26: South America Video Crossbar Switches Volume Share (%), by Country 2025 & 2033
- Figure 27: Europe Video Crossbar Switches Revenue (undefined), by Application 2025 & 2033
- Figure 28: Europe Video Crossbar Switches Volume (K), by Application 2025 & 2033
- Figure 29: Europe Video Crossbar Switches Revenue Share (%), by Application 2025 & 2033
- Figure 30: Europe Video Crossbar Switches Volume Share (%), by Application 2025 & 2033
- Figure 31: Europe Video Crossbar Switches Revenue (undefined), by Types 2025 & 2033
- Figure 32: Europe Video Crossbar Switches Volume (K), by Types 2025 & 2033
- Figure 33: Europe Video Crossbar Switches Revenue Share (%), by Types 2025 & 2033
- Figure 34: Europe Video Crossbar Switches Volume Share (%), by Types 2025 & 2033
- Figure 35: Europe Video Crossbar Switches Revenue (undefined), by Country 2025 & 2033
- Figure 36: Europe Video Crossbar Switches Volume (K), by Country 2025 & 2033
- Figure 37: Europe Video Crossbar Switches Revenue Share (%), by Country 2025 & 2033
- Figure 38: Europe Video Crossbar Switches Volume Share (%), by Country 2025 & 2033
- Figure 39: Middle East & Africa Video Crossbar Switches Revenue (undefined), by Application 2025 & 2033
- Figure 40: Middle East & Africa Video Crossbar Switches Volume (K), by Application 2025 & 2033
- Figure 41: Middle East & Africa Video Crossbar Switches Revenue Share (%), by Application 2025 & 2033
- Figure 42: Middle East & Africa Video Crossbar Switches Volume Share (%), by Application 2025 & 2033
- Figure 43: Middle East & Africa Video Crossbar Switches Revenue (undefined), by Types 2025 & 2033
- Figure 44: Middle East & Africa Video Crossbar Switches Volume (K), by Types 2025 & 2033
- Figure 45: Middle East & Africa Video Crossbar Switches Revenue Share (%), by Types 2025 & 2033
- Figure 46: Middle East & Africa Video Crossbar Switches Volume Share (%), by Types 2025 & 2033
- Figure 47: Middle East & Africa Video Crossbar Switches Revenue (undefined), by Country 2025 & 2033
- Figure 48: Middle East & Africa Video Crossbar Switches Volume (K), by Country 2025 & 2033
- Figure 49: Middle East & Africa Video Crossbar Switches Revenue Share (%), by Country 2025 & 2033
- Figure 50: Middle East & Africa Video Crossbar Switches Volume Share (%), by Country 2025 & 2033
- Figure 51: Asia Pacific Video Crossbar Switches Revenue (undefined), by Application 2025 & 2033
- Figure 52: Asia Pacific Video Crossbar Switches Volume (K), by Application 2025 & 2033
- Figure 53: Asia Pacific Video Crossbar Switches Revenue Share (%), by Application 2025 & 2033
- Figure 54: Asia Pacific Video Crossbar Switches Volume Share (%), by Application 2025 & 2033
- Figure 55: Asia Pacific Video Crossbar Switches Revenue (undefined), by Types 2025 & 2033
- Figure 56: Asia Pacific Video Crossbar Switches Volume (K), by Types 2025 & 2033
- Figure 57: Asia Pacific Video Crossbar Switches Revenue Share (%), by Types 2025 & 2033
- Figure 58: Asia Pacific Video Crossbar Switches Volume Share (%), by Types 2025 & 2033
- Figure 59: Asia Pacific Video Crossbar Switches Revenue (undefined), by Country 2025 & 2033
- Figure 60: Asia Pacific Video Crossbar Switches Volume (K), by Country 2025 & 2033
- Figure 61: Asia Pacific Video Crossbar Switches Revenue Share (%), by Country 2025 & 2033
- Figure 62: Asia Pacific Video Crossbar Switches Volume Share (%), by Country 2025 & 2033
List of Tables
- Table 1: Global Video Crossbar Switches Revenue undefined Forecast, by Application 2020 & 2033
- Table 2: Global Video Crossbar Switches Volume K Forecast, by Application 2020 & 2033
- Table 3: Global Video Crossbar Switches Revenue undefined Forecast, by Types 2020 & 2033
- Table 4: Global Video Crossbar Switches Volume K Forecast, by Types 2020 & 2033
- Table 5: Global Video Crossbar Switches Revenue undefined Forecast, by Region 2020 & 2033
- Table 6: Global Video Crossbar Switches Volume K Forecast, by Region 2020 & 2033
- Table 7: Global Video Crossbar Switches Revenue undefined Forecast, by Application 2020 & 2033
- Table 8: Global Video Crossbar Switches Volume K Forecast, by Application 2020 & 2033
- Table 9: Global Video Crossbar Switches Revenue undefined Forecast, by Types 2020 & 2033
- Table 10: Global Video Crossbar Switches Volume K Forecast, by Types 2020 & 2033
- Table 11: Global Video Crossbar Switches Revenue undefined Forecast, by Country 2020 & 2033
- Table 12: Global Video Crossbar Switches Volume K Forecast, by Country 2020 & 2033
- Table 13: United States Video Crossbar Switches Revenue (undefined) Forecast, by Application 2020 & 2033
- Table 14: United States Video Crossbar Switches Volume (K) Forecast, by Application 2020 & 2033
- Table 15: Canada Video Crossbar Switches Revenue (undefined) Forecast, by Application 2020 & 2033
- Table 16: Canada Video Crossbar Switches Volume (K) Forecast, by Application 2020 & 2033
- Table 17: Mexico Video Crossbar Switches Revenue (undefined) Forecast, by Application 2020 & 2033
- Table 18: Mexico Video Crossbar Switches Volume (K) Forecast, by Application 2020 & 2033
- Table 19: Global Video Crossbar Switches Revenue undefined Forecast, by Application 2020 & 2033
- Table 20: Global Video Crossbar Switches Volume K Forecast, by Application 2020 & 2033
- Table 21: Global Video Crossbar Switches Revenue undefined Forecast, by Types 2020 & 2033
- Table 22: Global Video Crossbar Switches Volume K Forecast, by Types 2020 & 2033
- Table 23: Global Video Crossbar Switches Revenue undefined Forecast, by Country 2020 & 2033
- Table 24: Global Video Crossbar Switches Volume K Forecast, by Country 2020 & 2033
- Table 25: Brazil Video Crossbar Switches Revenue (undefined) Forecast, by Application 2020 & 2033
- Table 26: Brazil Video Crossbar Switches Volume (K) Forecast, by Application 2020 & 2033
- Table 27: Argentina Video Crossbar Switches Revenue (undefined) Forecast, by Application 2020 & 2033
- Table 28: Argentina Video Crossbar Switches Volume (K) Forecast, by Application 2020 & 2033
- Table 29: Rest of South America Video Crossbar Switches Revenue (undefined) Forecast, by Application 2020 & 2033
- Table 30: Rest of South America Video Crossbar Switches Volume (K) Forecast, by Application 2020 & 2033
- Table 31: Global Video Crossbar Switches Revenue undefined Forecast, by Application 2020 & 2033
- Table 32: Global Video Crossbar Switches Volume K Forecast, by Application 2020 & 2033
- Table 33: Global Video Crossbar Switches Revenue undefined Forecast, by Types 2020 & 2033
- Table 34: Global Video Crossbar Switches Volume K Forecast, by Types 2020 & 2033
- Table 35: Global Video Crossbar Switches Revenue undefined Forecast, by Country 2020 & 2033
- Table 36: Global Video Crossbar Switches Volume K Forecast, by Country 2020 & 2033
- Table 37: United Kingdom Video Crossbar Switches Revenue (undefined) Forecast, by Application 2020 & 2033
- Table 38: United Kingdom Video Crossbar Switches Volume (K) Forecast, by Application 2020 & 2033
- Table 39: Germany Video Crossbar Switches Revenue (undefined) Forecast, by Application 2020 & 2033
- Table 40: Germany Video Crossbar Switches Volume (K) Forecast, by Application 2020 & 2033
- Table 41: France Video Crossbar Switches Revenue (undefined) Forecast, by Application 2020 & 2033
- Table 42: France Video Crossbar Switches Volume (K) Forecast, by Application 2020 & 2033
- Table 43: Italy Video Crossbar Switches Revenue (undefined) Forecast, by Application 2020 & 2033
- Table 44: Italy Video Crossbar Switches Volume (K) Forecast, by Application 2020 & 2033
- Table 45: Spain Video Crossbar Switches Revenue (undefined) Forecast, by Application 2020 & 2033
- Table 46: Spain Video Crossbar Switches Volume (K) Forecast, by Application 2020 & 2033
- Table 47: Russia Video Crossbar Switches Revenue (undefined) Forecast, by Application 2020 & 2033
- Table 48: Russia Video Crossbar Switches Volume (K) Forecast, by Application 2020 & 2033
- Table 49: Benelux Video Crossbar Switches Revenue (undefined) Forecast, by Application 2020 & 2033
- Table 50: Benelux Video Crossbar Switches Volume (K) Forecast, by Application 2020 & 2033
- Table 51: Nordics Video Crossbar Switches Revenue (undefined) Forecast, by Application 2020 & 2033
- Table 52: Nordics Video Crossbar Switches Volume (K) Forecast, by Application 2020 & 2033
- Table 53: Rest of Europe Video Crossbar Switches Revenue (undefined) Forecast, by Application 2020 & 2033
- Table 54: Rest of Europe Video Crossbar Switches Volume (K) Forecast, by Application 2020 & 2033
- Table 55: Global Video Crossbar Switches Revenue undefined Forecast, by Application 2020 & 2033
- Table 56: Global Video Crossbar Switches Volume K Forecast, by Application 2020 & 2033
- Table 57: Global Video Crossbar Switches Revenue undefined Forecast, by Types 2020 & 2033
- Table 58: Global Video Crossbar Switches Volume K Forecast, by Types 2020 & 2033
- Table 59: Global Video Crossbar Switches Revenue undefined Forecast, by Country 2020 & 2033
- Table 60: Global Video Crossbar Switches Volume K Forecast, by Country 2020 & 2033
- Table 61: Turkey Video Crossbar Switches Revenue (undefined) Forecast, by Application 2020 & 2033
- Table 62: Turkey Video Crossbar Switches Volume (K) Forecast, by Application 2020 & 2033
- Table 63: Israel Video Crossbar Switches Revenue (undefined) Forecast, by Application 2020 & 2033
- Table 64: Israel Video Crossbar Switches Volume (K) Forecast, by Application 2020 & 2033
- Table 65: GCC Video Crossbar Switches Revenue (undefined) Forecast, by Application 2020 & 2033
- Table 66: GCC Video Crossbar Switches Volume (K) Forecast, by Application 2020 & 2033
- Table 67: North Africa Video Crossbar Switches Revenue (undefined) Forecast, by Application 2020 & 2033
- Table 68: North Africa Video Crossbar Switches Volume (K) Forecast, by Application 2020 & 2033
- Table 69: South Africa Video Crossbar Switches Revenue (undefined) Forecast, by Application 2020 & 2033
- Table 70: South Africa Video Crossbar Switches Volume (K) Forecast, by Application 2020 & 2033
- Table 71: Rest of Middle East & Africa Video Crossbar Switches Revenue (undefined) Forecast, by Application 2020 & 2033
- Table 72: Rest of Middle East & Africa Video Crossbar Switches Volume (K) Forecast, by Application 2020 & 2033
- Table 73: Global Video Crossbar Switches Revenue undefined Forecast, by Application 2020 & 2033
- Table 74: Global Video Crossbar Switches Volume K Forecast, by Application 2020 & 2033
- Table 75: Global Video Crossbar Switches Revenue undefined Forecast, by Types 2020 & 2033
- Table 76: Global Video Crossbar Switches Volume K Forecast, by Types 2020 & 2033
- Table 77: Global Video Crossbar Switches Revenue undefined Forecast, by Country 2020 & 2033
- Table 78: Global Video Crossbar Switches Volume K Forecast, by Country 2020 & 2033
- Table 79: China Video Crossbar Switches Revenue (undefined) Forecast, by Application 2020 & 2033
- Table 80: China Video Crossbar Switches Volume (K) Forecast, by Application 2020 & 2033
- Table 81: India Video Crossbar Switches Revenue (undefined) Forecast, by Application 2020 & 2033
- Table 82: India Video Crossbar Switches Volume (K) Forecast, by Application 2020 & 2033
- Table 83: Japan Video Crossbar Switches Revenue (undefined) Forecast, by Application 2020 & 2033
- Table 84: Japan Video Crossbar Switches Volume (K) Forecast, by Application 2020 & 2033
- Table 85: South Korea Video Crossbar Switches Revenue (undefined) Forecast, by Application 2020 & 2033
- Table 86: South Korea Video Crossbar Switches Volume (K) Forecast, by Application 2020 & 2033
- Table 87: ASEAN Video Crossbar Switches Revenue (undefined) Forecast, by Application 2020 & 2033
- Table 88: ASEAN Video Crossbar Switches Volume (K) Forecast, by Application 2020 & 2033
- Table 89: Oceania Video Crossbar Switches Revenue (undefined) Forecast, by Application 2020 & 2033
- Table 90: Oceania Video Crossbar Switches Volume (K) Forecast, by Application 2020 & 2033
- Table 91: Rest of Asia Pacific Video Crossbar Switches Revenue (undefined) Forecast, by Application 2020 & 2033
- Table 92: Rest of Asia Pacific Video Crossbar Switches Volume (K) Forecast, by Application 2020 & 2033
Frequently Asked Questions
1. What is the projected Compound Annual Growth Rate (CAGR) of the Video Crossbar Switches?
The projected CAGR is approximately 15%.
2. Which companies are prominent players in the Video Crossbar Switches?
Key companies in the market include Analog Devices, MACOM, Renesas Electronics, Onsemi, Frontgrade, TI, Semtech, Microsemi, Lattice, Microchip, STMicroelectronics.
3. What are the main segments of the Video Crossbar Switches?
The market segments include Application, Types.
4. Can you provide details about the market size?
The market size is estimated to be USD XXX N/A as of 2022.
5. What are some drivers contributing to market growth?
N/A
6. What are the notable trends driving market growth?
N/A
7. Are there any restraints impacting market growth?
N/A
8. Can you provide examples of recent developments in the market?
N/A
9. What pricing options are available for accessing the report?
Pricing options include single-user, multi-user, and enterprise licenses priced at USD 3950.00, USD 5925.00, and USD 7900.00 respectively.
10. Is the market size provided in terms of value or volume?
The market size is provided in terms of value, measured in N/A and volume, measured in K.
11. Are there any specific market keywords associated with the report?
Yes, the market keyword associated with the report is "Video Crossbar Switches," which aids in identifying and referencing the specific market segment covered.
12. How do I determine which pricing option suits my needs best?
The pricing options vary based on user requirements and access needs. Individual users may opt for single-user licenses, while businesses requiring broader access may choose multi-user or enterprise licenses for cost-effective access to the report.
13. Are there any additional resources or data provided in the Video Crossbar Switches report?
While the report offers comprehensive insights, it's advisable to review the specific contents or supplementary materials provided to ascertain if additional resources or data are available.
14. How can I stay updated on further developments or reports in the Video Crossbar Switches?
To stay informed about further developments, trends, and reports in the Video Crossbar Switches, consider subscribing to industry newsletters, following relevant companies and organizations, or regularly checking reputable industry news sources and publications.
Methodology
Step 1 - Identification of Relevant Samples Size from Population Database


Step 2 - Approaches for Defining Global Market Size (Value, Volume* & Price*)

Note*: In applicable scenarios
Step 3 - Data Sources
Primary Research
- Web Analytics
- Survey Reports
- Research Institute
- Latest Research Reports
- Opinion Leaders
Secondary Research
- Annual Reports
- White Paper
- Latest Press Release
- Industry Association
- Paid Database
- Investor Presentations

Step 4 - Data Triangulation
Involves using different sources of information in order to increase the validity of a study
These sources are likely to be stakeholders in a program - participants, other researchers, program staff, other community members, and so on.
Then we put all data in single framework & apply various statistical tools to find out the dynamic on the market.
During the analysis stage, feedback from the stakeholder groups would be compared to determine areas of agreement as well as areas of divergence