
Key Insights
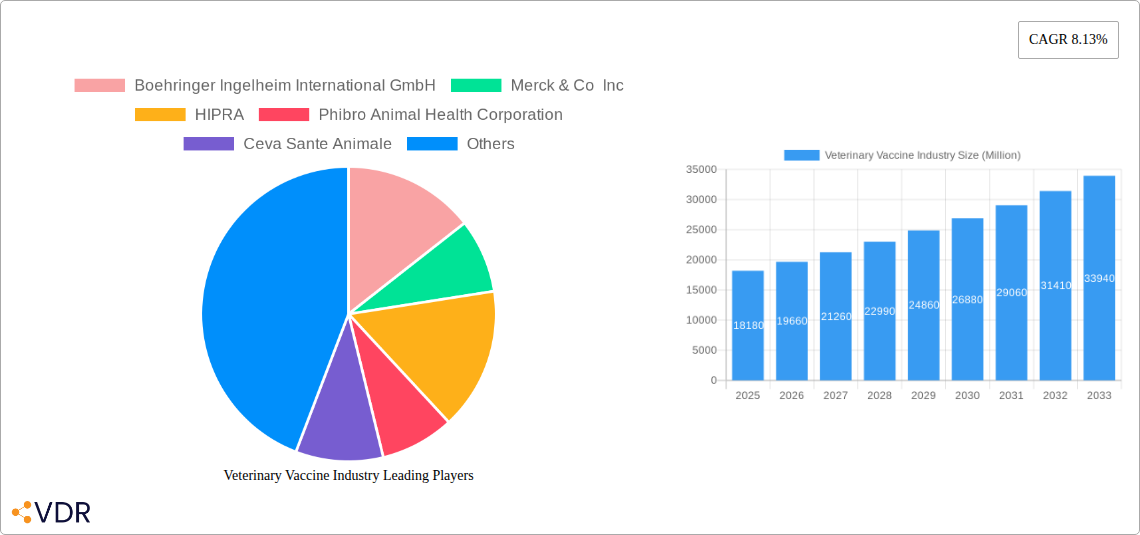
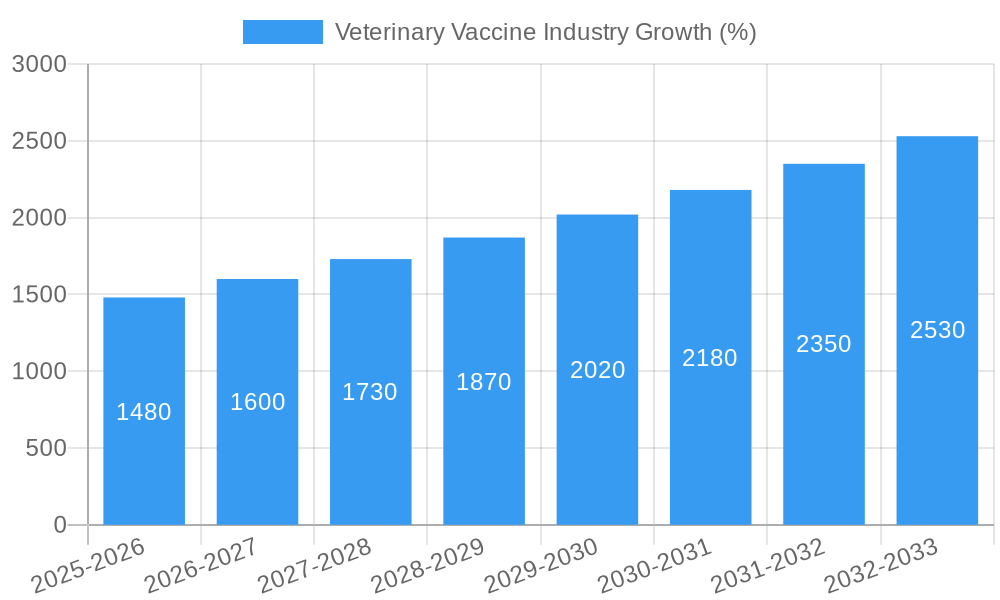
The global veterinary vaccine market, valued at $18.18 billion in 2025, is projected to experience robust growth, exhibiting a compound annual growth rate (CAGR) of 8.13% from 2025 to 2033. This expansion is driven by several key factors. Increasing pet ownership worldwide, coupled with rising awareness of animal health and welfare, fuels demand for preventative vaccines. Furthermore, the growing prevalence of zoonotic diseases – illnesses transferable between animals and humans – necessitates proactive vaccination strategies to protect both animal and public health. Advancements in vaccine technology, such as the development of more effective and safer recombinant and subunit vaccines, contribute to market growth. The livestock sector's expansion, particularly in developing economies, also significantly impacts market size. Governments' increasing investment in animal health infrastructure and disease surveillance programs further supports market expansion. However, challenges remain, including stringent regulatory approvals, high research and development costs associated with new vaccine development, and variations in vaccination practices across different regions.
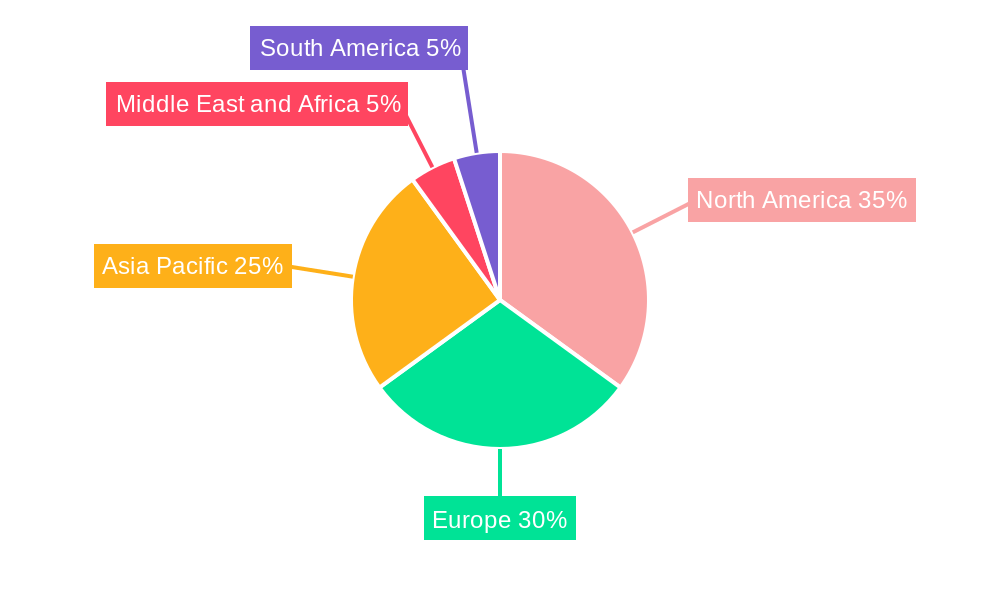
Segment-wise, the livestock vaccines segment currently dominates the market, owing to the large-scale vaccination programs implemented in the agricultural sector. However, the companion animal vaccines segment is projected to experience faster growth due to rising pet ownership and increased veterinary care expenditure. Technologically, live attenuated vaccines hold a significant share, but the inactivated and recombinant vaccine segments are gaining traction owing to their enhanced safety profiles and efficacy. Geographically, North America and Europe currently represent major markets, characterized by high per capita animal health spending and advanced veterinary infrastructure. However, Asia-Pacific is expected to demonstrate significant growth potential in the coming years, driven by rising disposable incomes, expanding livestock populations, and improving veterinary care access. The market's future trajectory hinges on continued innovation in vaccine technology, greater investment in animal health infrastructure in emerging markets, and effective strategies to address regulatory hurdles.
Veterinary Vaccine Industry Market Report: 2019-2033
This comprehensive report provides an in-depth analysis of the Veterinary Vaccine Industry, encompassing market dynamics, growth trends, regional dominance, product landscape, challenges, opportunities, and key players. The study period covers 2019-2033, with a base year of 2025 and a forecast period of 2025-2033. The report segments the market by vaccine type (Livestock Vaccines, Companion Animal Vaccines) and technology (Live Attenuated Vaccines, Inactivated Vaccines, Toxoid Vaccines, Recombinant Vaccines, Other Technologies). The global market size is valued at xx Million units in 2025, exhibiting a robust CAGR of xx% during the forecast period.
Veterinary Vaccine Industry Market Dynamics & Structure
The veterinary vaccine market is characterized by moderate concentration, with several key players holding significant market share. Technological innovation, driven by advancements in genetic engineering and delivery systems, is a key growth driver. Stringent regulatory frameworks, varying across different geographies, influence market access and product development. The market faces competition from alternative disease control methods, such as improved sanitation and biosecurity practices. The increasing human-animal bond and growing pet ownership significantly influence the companion animal vaccine segment. Mergers and acquisitions (M&A) activity is prevalent, with larger companies consolidating their positions through strategic acquisitions of smaller players and expanding their product portfolios.
- Market Concentration: Moderately concentrated, with top 5 players holding approximately xx% of the market share in 2025.
- Technological Innovation: Focus on novel vaccine platforms like mRNA and viral vector vaccines, improved delivery systems (e.g., intranasal, oral), and personalized vaccines.
- Regulatory Frameworks: Stringent regulatory approvals (e.g., USDA, EMA) impact market entry and timelines.
- Competitive Substitutes: Improved biosecurity measures, alternative disease control strategies compete with vaccines.
- End-User Demographics: Growth driven by increasing pet ownership and livestock farming.
- M&A Trends: Consolidation through acquisitions to gain market share and expand product portfolios. An estimated xx M&A deals were recorded during the historical period.
Veterinary Vaccine Industry Growth Trends & Insights
The veterinary vaccine market exhibits strong growth, fueled by several factors. The increasing prevalence of zoonotic diseases and the rising awareness of animal health among pet owners and farmers are key drivers. Technological advancements, such as the development of more effective and safer vaccines, have significantly contributed to market expansion. Shifting consumer preferences towards preventative healthcare for animals and increasing disposable income have also positively influenced market growth. Furthermore, supportive government initiatives and investments in animal health infrastructure contribute to market expansion in developing economies. The adoption rate of newer vaccine technologies is increasing steadily, particularly in developed markets.
- Market Size: xx Million units in 2025, projected to reach xx Million units by 2033.
- CAGR (2025-2033): xx%
- Market Penetration: xx% in developed countries, xx% in developing countries in 2025.
- Technological Disruptions: Adoption of novel vaccine technologies, including mRNA vaccines and personalized medicine approaches.
- Consumer Behavior: Increased willingness to invest in pet and animal healthcare.
Dominant Regions, Countries, or Segments in Veterinary Vaccine Industry
North America and Europe currently dominate the veterinary vaccine market, driven by high pet ownership rates, advanced healthcare infrastructure, and strong regulatory frameworks. However, Asia-Pacific is projected to experience the highest growth rate during the forecast period due to expanding livestock farming, increasing animal healthcare awareness, and rising disposable incomes. Within vaccine types, Companion Animal Vaccines hold a larger market share due to higher pet ownership and consumer spending on animal healthcare. Live attenuated vaccines dominate the technology segment owing to their efficacy and cost-effectiveness.
- Leading Region: North America
- Fastest-Growing Region: Asia-Pacific
- Dominant Vaccine Type: Companion Animal Vaccines
- Dominant Technology: Live Attenuated Vaccines
- Key Drivers: High pet ownership (North America, Europe); Expanding livestock farming (Asia-Pacific); Rising disposable incomes; Increasing government investments in animal health infrastructure; Growing awareness of animal health.
Veterinary Vaccine Industry Product Landscape
The veterinary vaccine market offers a diverse range of products tailored to specific animal species and diseases. Innovations focus on improved efficacy, safety, and ease of administration. Multivalent vaccines offering protection against multiple pathogens are gaining popularity, alongside vaccines with enhanced shelf life and stability. Technological advancements such as the use of adjuvants and novel delivery systems enhance vaccine performance. Unique selling propositions include superior efficacy, reduced side effects, and convenient administration methods.
Key Drivers, Barriers & Challenges in Veterinary Vaccine Industry
Key Drivers:
- Rising pet ownership and increasing awareness of animal health.
- Growing livestock production and demand for disease prevention.
- Technological advancements leading to improved vaccine efficacy and safety.
- Supportive government policies and investments in animal health infrastructure.
Key Barriers and Challenges:
- Stringent regulatory requirements and lengthy approval processes.
- High research and development costs associated with vaccine development.
- Potential for adverse reactions and vaccine efficacy variability.
- Competition from alternative disease control methods.
- Supply chain disruptions impacting vaccine availability. Estimated xx% disruption during the historical period.
Emerging Opportunities in Veterinary Vaccine Industry
- Development of vaccines for emerging infectious diseases.
- Expansion into underserved markets, particularly in developing countries.
- Focus on personalized vaccines tailored to individual animal needs.
- Development of novel vaccine delivery systems (e.g., intranasal, oral).
- Growing interest in vaccines for companion animals against non-infectious diseases.
Growth Accelerators in the Veterinary Vaccine Industry
Strategic partnerships between pharmaceutical companies and research institutions are accelerating innovation and product development. Investments in advanced manufacturing technologies are improving vaccine production efficiency and reducing costs. Expansion into new geographical markets and the development of novel vaccine formulations are driving market growth.
Key Players Shaping the Veterinary Vaccine Industry Market
- Boehringer Ingelheim International GmbH
- Merck & Co Inc
- HIPRA
- Phibro Animal Health Corporation
- Ceva Sante Animale
- Virbac
- Elanco Animal Health
- Zoetis Inc
- Hester Biosciences Limited
Notable Milestones in Veterinary Vaccine Industry Sector
- September 2022: Merck Animal Health launched Nobivac Intra-Trac Oral BbPi for canine respiratory pathogens.
- August 2022: ICAR-NRCE and ICAR-IVRI developed Lumpi-ProVacInd, a live-attenuated Lumpy Skin Disease vaccine.
In-Depth Veterinary Vaccine Industry Market Outlook
The veterinary vaccine market is poised for continued growth driven by technological advancements, increasing animal healthcare awareness, and supportive government initiatives. Strategic partnerships, market expansion into developing countries, and the development of innovative vaccine technologies represent significant strategic opportunities for market players. The focus on personalized medicine approaches and the development of vaccines for emerging and neglected diseases presents lucrative avenues for growth in the coming years.
Veterinary Vaccine Industry Segmentation
-
1. Vaccine Type
-
1.1. Livestock Vaccines
- 1.1.1. Bovine Vaccines
- 1.1.2. Poultry Vaccines
- 1.1.3. Porcine Vaccines
- 1.1.4. Other Livestock Vaccines
-
1.2. By Companion Animal Vaccines
- 1.2.1. Canine Vaccines
- 1.2.2. Feline Vaccines
- 1.2.3. Equine Vaccines
-
1.1. Livestock Vaccines
-
2. Technology
- 2.1. Live Attenuated Vaccines
- 2.2. Inactivated Vaccines
- 2.3. Toxoid Vaccines
- 2.4. Recombinant Vaccines
- 2.5. Other Technologies
Veterinary Vaccine Industry Segmentation By Geography
-
1. North America
- 1.1. United States
- 1.2. Canada
- 1.3. Mexico
-
2. Europe
- 2.1. Germany
- 2.2. United Kingdom
- 2.3. France
- 2.4. Italy
- 2.5. Spain
- 2.6. Rest of Europe
-
3. Asia Pacific
- 3.1. China
- 3.2. Japan
- 3.3. India
- 3.4. Australia
- 3.5. South Korea
- 3.6. Rest of Asia Pacific
-
4. Middle East and Africa
- 4.1. GCC
- 4.2. South Africa
- 4.3. Rest of Middle East and Africa
-
5. South America
- 5.1. Brazil
- 5.2. Argentina
- 5.3. Rest of South America
Veterinary Vaccine Industry REPORT HIGHLIGHTS
| Aspects | Details |
|---|---|
| Study Period | 2019-2033 |
| Base Year | 2024 |
| Estimated Year | 2025 |
| Forecast Period | 2025-2033 |
| Historical Period | 2019-2024 |
| Growth Rate | CAGR of 8.13% from 2019-2033 |
| Segmentation |
|
Table of Contents
- 1. Introduction
- 1.1. Research Scope
- 1.2. Market Segmentation
- 1.3. Research Methodology
- 1.4. Definitions and Assumptions
- 2. Executive Summary
- 2.1. Introduction
- 3. Market Dynamics
- 3.1. Introduction
- 3.2. Market Drivers
- 3.2.1 Increasing Incidence of Livestock Diseases; Increasing Pet Adoption Globally; Initiatives by Government Agencies
- 3.2.2 Animal Associations
- 3.2.3 and Leading Players
- 3.3. Market Restrains
- 3.3.1. High Storage Costs for Vaccines; Shortage of Veterinarians and Skilled Farm Workers
- 3.4. Market Trends
- 3.4.1. The Canine Vaccines Segment is Expected to Hold a Significant Market Share Over the Forecast Period
- 4. Market Factor Analysis
- 4.1. Porters Five Forces
- 4.2. Supply/Value Chain
- 4.3. PESTEL analysis
- 4.4. Market Entropy
- 4.5. Patent/Trademark Analysis
- 5. Global Veterinary Vaccine Industry Analysis, Insights and Forecast, 2019-2031
- 5.1. Market Analysis, Insights and Forecast - by Vaccine Type
- 5.1.1. Livestock Vaccines
- 5.1.1.1. Bovine Vaccines
- 5.1.1.2. Poultry Vaccines
- 5.1.1.3. Porcine Vaccines
- 5.1.1.4. Other Livestock Vaccines
- 5.1.2. By Companion Animal Vaccines
- 5.1.2.1. Canine Vaccines
- 5.1.2.2. Feline Vaccines
- 5.1.2.3. Equine Vaccines
- 5.1.1. Livestock Vaccines
- 5.2. Market Analysis, Insights and Forecast - by Technology
- 5.2.1. Live Attenuated Vaccines
- 5.2.2. Inactivated Vaccines
- 5.2.3. Toxoid Vaccines
- 5.2.4. Recombinant Vaccines
- 5.2.5. Other Technologies
- 5.3. Market Analysis, Insights and Forecast - by Region
- 5.3.1. North America
- 5.3.2. Europe
- 5.3.3. Asia Pacific
- 5.3.4. Middle East and Africa
- 5.3.5. South America
- 5.1. Market Analysis, Insights and Forecast - by Vaccine Type
- 6. North America Veterinary Vaccine Industry Analysis, Insights and Forecast, 2019-2031
- 6.1. Market Analysis, Insights and Forecast - by Vaccine Type
- 6.1.1. Livestock Vaccines
- 6.1.1.1. Bovine Vaccines
- 6.1.1.2. Poultry Vaccines
- 6.1.1.3. Porcine Vaccines
- 6.1.1.4. Other Livestock Vaccines
- 6.1.2. By Companion Animal Vaccines
- 6.1.2.1. Canine Vaccines
- 6.1.2.2. Feline Vaccines
- 6.1.2.3. Equine Vaccines
- 6.1.1. Livestock Vaccines
- 6.2. Market Analysis, Insights and Forecast - by Technology
- 6.2.1. Live Attenuated Vaccines
- 6.2.2. Inactivated Vaccines
- 6.2.3. Toxoid Vaccines
- 6.2.4. Recombinant Vaccines
- 6.2.5. Other Technologies
- 6.1. Market Analysis, Insights and Forecast - by Vaccine Type
- 7. Europe Veterinary Vaccine Industry Analysis, Insights and Forecast, 2019-2031
- 7.1. Market Analysis, Insights and Forecast - by Vaccine Type
- 7.1.1. Livestock Vaccines
- 7.1.1.1. Bovine Vaccines
- 7.1.1.2. Poultry Vaccines
- 7.1.1.3. Porcine Vaccines
- 7.1.1.4. Other Livestock Vaccines
- 7.1.2. By Companion Animal Vaccines
- 7.1.2.1. Canine Vaccines
- 7.1.2.2. Feline Vaccines
- 7.1.2.3. Equine Vaccines
- 7.1.1. Livestock Vaccines
- 7.2. Market Analysis, Insights and Forecast - by Technology
- 7.2.1. Live Attenuated Vaccines
- 7.2.2. Inactivated Vaccines
- 7.2.3. Toxoid Vaccines
- 7.2.4. Recombinant Vaccines
- 7.2.5. Other Technologies
- 7.1. Market Analysis, Insights and Forecast - by Vaccine Type
- 8. Asia Pacific Veterinary Vaccine Industry Analysis, Insights and Forecast, 2019-2031
- 8.1. Market Analysis, Insights and Forecast - by Vaccine Type
- 8.1.1. Livestock Vaccines
- 8.1.1.1. Bovine Vaccines
- 8.1.1.2. Poultry Vaccines
- 8.1.1.3. Porcine Vaccines
- 8.1.1.4. Other Livestock Vaccines
- 8.1.2. By Companion Animal Vaccines
- 8.1.2.1. Canine Vaccines
- 8.1.2.2. Feline Vaccines
- 8.1.2.3. Equine Vaccines
- 8.1.1. Livestock Vaccines
- 8.2. Market Analysis, Insights and Forecast - by Technology
- 8.2.1. Live Attenuated Vaccines
- 8.2.2. Inactivated Vaccines
- 8.2.3. Toxoid Vaccines
- 8.2.4. Recombinant Vaccines
- 8.2.5. Other Technologies
- 8.1. Market Analysis, Insights and Forecast - by Vaccine Type
- 9. Middle East and Africa Veterinary Vaccine Industry Analysis, Insights and Forecast, 2019-2031
- 9.1. Market Analysis, Insights and Forecast - by Vaccine Type
- 9.1.1. Livestock Vaccines
- 9.1.1.1. Bovine Vaccines
- 9.1.1.2. Poultry Vaccines
- 9.1.1.3. Porcine Vaccines
- 9.1.1.4. Other Livestock Vaccines
- 9.1.2. By Companion Animal Vaccines
- 9.1.2.1. Canine Vaccines
- 9.1.2.2. Feline Vaccines
- 9.1.2.3. Equine Vaccines
- 9.1.1. Livestock Vaccines
- 9.2. Market Analysis, Insights and Forecast - by Technology
- 9.2.1. Live Attenuated Vaccines
- 9.2.2. Inactivated Vaccines
- 9.2.3. Toxoid Vaccines
- 9.2.4. Recombinant Vaccines
- 9.2.5. Other Technologies
- 9.1. Market Analysis, Insights and Forecast - by Vaccine Type
- 10. South America Veterinary Vaccine Industry Analysis, Insights and Forecast, 2019-2031
- 10.1. Market Analysis, Insights and Forecast - by Vaccine Type
- 10.1.1. Livestock Vaccines
- 10.1.1.1. Bovine Vaccines
- 10.1.1.2. Poultry Vaccines
- 10.1.1.3. Porcine Vaccines
- 10.1.1.4. Other Livestock Vaccines
- 10.1.2. By Companion Animal Vaccines
- 10.1.2.1. Canine Vaccines
- 10.1.2.2. Feline Vaccines
- 10.1.2.3. Equine Vaccines
- 10.1.1. Livestock Vaccines
- 10.2. Market Analysis, Insights and Forecast - by Technology
- 10.2.1. Live Attenuated Vaccines
- 10.2.2. Inactivated Vaccines
- 10.2.3. Toxoid Vaccines
- 10.2.4. Recombinant Vaccines
- 10.2.5. Other Technologies
- 10.1. Market Analysis, Insights and Forecast - by Vaccine Type
- 11. North America Veterinary Vaccine Industry Analysis, Insights and Forecast, 2019-2031
- 11.1. Market Analysis, Insights and Forecast - By Country/Sub-region
- 11.1.1 United States
- 11.1.2 Canada
- 11.1.3 Mexico
- 12. Europe Veterinary Vaccine Industry Analysis, Insights and Forecast, 2019-2031
- 12.1. Market Analysis, Insights and Forecast - By Country/Sub-region
- 12.1.1 Germany
- 12.1.2 United Kingdom
- 12.1.3 France
- 12.1.4 Italy
- 12.1.5 Spain
- 12.1.6 Rest of Europe
- 13. Asia Pacific Veterinary Vaccine Industry Analysis, Insights and Forecast, 2019-2031
- 13.1. Market Analysis, Insights and Forecast - By Country/Sub-region
- 13.1.1 China
- 13.1.2 Japan
- 13.1.3 India
- 13.1.4 Australia
- 13.1.5 South Korea
- 13.1.6 Rest of Asia Pacific
- 14. Middle East and Africa Veterinary Vaccine Industry Analysis, Insights and Forecast, 2019-2031
- 14.1. Market Analysis, Insights and Forecast - By Country/Sub-region
- 14.1.1 GCC
- 14.1.2 South Africa
- 14.1.3 Rest of Middle East and Africa
- 15. South America Veterinary Vaccine Industry Analysis, Insights and Forecast, 2019-2031
- 15.1. Market Analysis, Insights and Forecast - By Country/Sub-region
- 15.1.1 Brazil
- 15.1.2 Argentina
- 15.1.3 Rest of South America
- 16. Competitive Analysis
- 16.1. Global Market Share Analysis 2024
- 16.2. Company Profiles
- 16.2.1 Boehringer Ingelheim International GmbH
- 16.2.1.1. Overview
- 16.2.1.2. Products
- 16.2.1.3. SWOT Analysis
- 16.2.1.4. Recent Developments
- 16.2.1.5. Financials (Based on Availability)
- 16.2.2 Merck & Co Inc
- 16.2.2.1. Overview
- 16.2.2.2. Products
- 16.2.2.3. SWOT Analysis
- 16.2.2.4. Recent Developments
- 16.2.2.5. Financials (Based on Availability)
- 16.2.3 HIPRA
- 16.2.3.1. Overview
- 16.2.3.2. Products
- 16.2.3.3. SWOT Analysis
- 16.2.3.4. Recent Developments
- 16.2.3.5. Financials (Based on Availability)
- 16.2.4 Phibro Animal Health Corporation
- 16.2.4.1. Overview
- 16.2.4.2. Products
- 16.2.4.3. SWOT Analysis
- 16.2.4.4. Recent Developments
- 16.2.4.5. Financials (Based on Availability)
- 16.2.5 Ceva Sante Animale
- 16.2.5.1. Overview
- 16.2.5.2. Products
- 16.2.5.3. SWOT Analysis
- 16.2.5.4. Recent Developments
- 16.2.5.5. Financials (Based on Availability)
- 16.2.6 Virbac
- 16.2.6.1. Overview
- 16.2.6.2. Products
- 16.2.6.3. SWOT Analysis
- 16.2.6.4. Recent Developments
- 16.2.6.5. Financials (Based on Availability)
- 16.2.7 Elanco Animal Health
- 16.2.7.1. Overview
- 16.2.7.2. Products
- 16.2.7.3. SWOT Analysis
- 16.2.7.4. Recent Developments
- 16.2.7.5. Financials (Based on Availability)
- 16.2.8 Zoetis Inc
- 16.2.8.1. Overview
- 16.2.8.2. Products
- 16.2.8.3. SWOT Analysis
- 16.2.8.4. Recent Developments
- 16.2.8.5. Financials (Based on Availability)
- 16.2.9 Hester Biosciences Limited
- 16.2.9.1. Overview
- 16.2.9.2. Products
- 16.2.9.3. SWOT Analysis
- 16.2.9.4. Recent Developments
- 16.2.9.5. Financials (Based on Availability)
- 16.2.1 Boehringer Ingelheim International GmbH
List of Figures
- Figure 1: Global Veterinary Vaccine Industry Revenue Breakdown (Million, %) by Region 2024 & 2032
- Figure 2: Global Veterinary Vaccine Industry Volume Breakdown (K Unit, %) by Region 2024 & 2032
- Figure 3: North America Veterinary Vaccine Industry Revenue (Million), by Country 2024 & 2032
- Figure 4: North America Veterinary Vaccine Industry Volume (K Unit), by Country 2024 & 2032
- Figure 5: North America Veterinary Vaccine Industry Revenue Share (%), by Country 2024 & 2032
- Figure 6: North America Veterinary Vaccine Industry Volume Share (%), by Country 2024 & 2032
- Figure 7: Europe Veterinary Vaccine Industry Revenue (Million), by Country 2024 & 2032
- Figure 8: Europe Veterinary Vaccine Industry Volume (K Unit), by Country 2024 & 2032
- Figure 9: Europe Veterinary Vaccine Industry Revenue Share (%), by Country 2024 & 2032
- Figure 10: Europe Veterinary Vaccine Industry Volume Share (%), by Country 2024 & 2032
- Figure 11: Asia Pacific Veterinary Vaccine Industry Revenue (Million), by Country 2024 & 2032
- Figure 12: Asia Pacific Veterinary Vaccine Industry Volume (K Unit), by Country 2024 & 2032
- Figure 13: Asia Pacific Veterinary Vaccine Industry Revenue Share (%), by Country 2024 & 2032
- Figure 14: Asia Pacific Veterinary Vaccine Industry Volume Share (%), by Country 2024 & 2032
- Figure 15: Middle East and Africa Veterinary Vaccine Industry Revenue (Million), by Country 2024 & 2032
- Figure 16: Middle East and Africa Veterinary Vaccine Industry Volume (K Unit), by Country 2024 & 2032
- Figure 17: Middle East and Africa Veterinary Vaccine Industry Revenue Share (%), by Country 2024 & 2032
- Figure 18: Middle East and Africa Veterinary Vaccine Industry Volume Share (%), by Country 2024 & 2032
- Figure 19: South America Veterinary Vaccine Industry Revenue (Million), by Country 2024 & 2032
- Figure 20: South America Veterinary Vaccine Industry Volume (K Unit), by Country 2024 & 2032
- Figure 21: South America Veterinary Vaccine Industry Revenue Share (%), by Country 2024 & 2032
- Figure 22: South America Veterinary Vaccine Industry Volume Share (%), by Country 2024 & 2032
- Figure 23: North America Veterinary Vaccine Industry Revenue (Million), by Vaccine Type 2024 & 2032
- Figure 24: North America Veterinary Vaccine Industry Volume (K Unit), by Vaccine Type 2024 & 2032
- Figure 25: North America Veterinary Vaccine Industry Revenue Share (%), by Vaccine Type 2024 & 2032
- Figure 26: North America Veterinary Vaccine Industry Volume Share (%), by Vaccine Type 2024 & 2032
- Figure 27: North America Veterinary Vaccine Industry Revenue (Million), by Technology 2024 & 2032
- Figure 28: North America Veterinary Vaccine Industry Volume (K Unit), by Technology 2024 & 2032
- Figure 29: North America Veterinary Vaccine Industry Revenue Share (%), by Technology 2024 & 2032
- Figure 30: North America Veterinary Vaccine Industry Volume Share (%), by Technology 2024 & 2032
- Figure 31: North America Veterinary Vaccine Industry Revenue (Million), by Country 2024 & 2032
- Figure 32: North America Veterinary Vaccine Industry Volume (K Unit), by Country 2024 & 2032
- Figure 33: North America Veterinary Vaccine Industry Revenue Share (%), by Country 2024 & 2032
- Figure 34: North America Veterinary Vaccine Industry Volume Share (%), by Country 2024 & 2032
- Figure 35: Europe Veterinary Vaccine Industry Revenue (Million), by Vaccine Type 2024 & 2032
- Figure 36: Europe Veterinary Vaccine Industry Volume (K Unit), by Vaccine Type 2024 & 2032
- Figure 37: Europe Veterinary Vaccine Industry Revenue Share (%), by Vaccine Type 2024 & 2032
- Figure 38: Europe Veterinary Vaccine Industry Volume Share (%), by Vaccine Type 2024 & 2032
- Figure 39: Europe Veterinary Vaccine Industry Revenue (Million), by Technology 2024 & 2032
- Figure 40: Europe Veterinary Vaccine Industry Volume (K Unit), by Technology 2024 & 2032
- Figure 41: Europe Veterinary Vaccine Industry Revenue Share (%), by Technology 2024 & 2032
- Figure 42: Europe Veterinary Vaccine Industry Volume Share (%), by Technology 2024 & 2032
- Figure 43: Europe Veterinary Vaccine Industry Revenue (Million), by Country 2024 & 2032
- Figure 44: Europe Veterinary Vaccine Industry Volume (K Unit), by Country 2024 & 2032
- Figure 45: Europe Veterinary Vaccine Industry Revenue Share (%), by Country 2024 & 2032
- Figure 46: Europe Veterinary Vaccine Industry Volume Share (%), by Country 2024 & 2032
- Figure 47: Asia Pacific Veterinary Vaccine Industry Revenue (Million), by Vaccine Type 2024 & 2032
- Figure 48: Asia Pacific Veterinary Vaccine Industry Volume (K Unit), by Vaccine Type 2024 & 2032
- Figure 49: Asia Pacific Veterinary Vaccine Industry Revenue Share (%), by Vaccine Type 2024 & 2032
- Figure 50: Asia Pacific Veterinary Vaccine Industry Volume Share (%), by Vaccine Type 2024 & 2032
- Figure 51: Asia Pacific Veterinary Vaccine Industry Revenue (Million), by Technology 2024 & 2032
- Figure 52: Asia Pacific Veterinary Vaccine Industry Volume (K Unit), by Technology 2024 & 2032
- Figure 53: Asia Pacific Veterinary Vaccine Industry Revenue Share (%), by Technology 2024 & 2032
- Figure 54: Asia Pacific Veterinary Vaccine Industry Volume Share (%), by Technology 2024 & 2032
- Figure 55: Asia Pacific Veterinary Vaccine Industry Revenue (Million), by Country 2024 & 2032
- Figure 56: Asia Pacific Veterinary Vaccine Industry Volume (K Unit), by Country 2024 & 2032
- Figure 57: Asia Pacific Veterinary Vaccine Industry Revenue Share (%), by Country 2024 & 2032
- Figure 58: Asia Pacific Veterinary Vaccine Industry Volume Share (%), by Country 2024 & 2032
- Figure 59: Middle East and Africa Veterinary Vaccine Industry Revenue (Million), by Vaccine Type 2024 & 2032
- Figure 60: Middle East and Africa Veterinary Vaccine Industry Volume (K Unit), by Vaccine Type 2024 & 2032
- Figure 61: Middle East and Africa Veterinary Vaccine Industry Revenue Share (%), by Vaccine Type 2024 & 2032
- Figure 62: Middle East and Africa Veterinary Vaccine Industry Volume Share (%), by Vaccine Type 2024 & 2032
- Figure 63: Middle East and Africa Veterinary Vaccine Industry Revenue (Million), by Technology 2024 & 2032
- Figure 64: Middle East and Africa Veterinary Vaccine Industry Volume (K Unit), by Technology 2024 & 2032
- Figure 65: Middle East and Africa Veterinary Vaccine Industry Revenue Share (%), by Technology 2024 & 2032
- Figure 66: Middle East and Africa Veterinary Vaccine Industry Volume Share (%), by Technology 2024 & 2032
- Figure 67: Middle East and Africa Veterinary Vaccine Industry Revenue (Million), by Country 2024 & 2032
- Figure 68: Middle East and Africa Veterinary Vaccine Industry Volume (K Unit), by Country 2024 & 2032
- Figure 69: Middle East and Africa Veterinary Vaccine Industry Revenue Share (%), by Country 2024 & 2032
- Figure 70: Middle East and Africa Veterinary Vaccine Industry Volume Share (%), by Country 2024 & 2032
- Figure 71: South America Veterinary Vaccine Industry Revenue (Million), by Vaccine Type 2024 & 2032
- Figure 72: South America Veterinary Vaccine Industry Volume (K Unit), by Vaccine Type 2024 & 2032
- Figure 73: South America Veterinary Vaccine Industry Revenue Share (%), by Vaccine Type 2024 & 2032
- Figure 74: South America Veterinary Vaccine Industry Volume Share (%), by Vaccine Type 2024 & 2032
- Figure 75: South America Veterinary Vaccine Industry Revenue (Million), by Technology 2024 & 2032
- Figure 76: South America Veterinary Vaccine Industry Volume (K Unit), by Technology 2024 & 2032
- Figure 77: South America Veterinary Vaccine Industry Revenue Share (%), by Technology 2024 & 2032
- Figure 78: South America Veterinary Vaccine Industry Volume Share (%), by Technology 2024 & 2032
- Figure 79: South America Veterinary Vaccine Industry Revenue (Million), by Country 2024 & 2032
- Figure 80: South America Veterinary Vaccine Industry Volume (K Unit), by Country 2024 & 2032
- Figure 81: South America Veterinary Vaccine Industry Revenue Share (%), by Country 2024 & 2032
- Figure 82: South America Veterinary Vaccine Industry Volume Share (%), by Country 2024 & 2032
List of Tables
- Table 1: Global Veterinary Vaccine Industry Revenue Million Forecast, by Region 2019 & 2032
- Table 2: Global Veterinary Vaccine Industry Volume K Unit Forecast, by Region 2019 & 2032
- Table 3: Global Veterinary Vaccine Industry Revenue Million Forecast, by Vaccine Type 2019 & 2032
- Table 4: Global Veterinary Vaccine Industry Volume K Unit Forecast, by Vaccine Type 2019 & 2032
- Table 5: Global Veterinary Vaccine Industry Revenue Million Forecast, by Technology 2019 & 2032
- Table 6: Global Veterinary Vaccine Industry Volume K Unit Forecast, by Technology 2019 & 2032
- Table 7: Global Veterinary Vaccine Industry Revenue Million Forecast, by Region 2019 & 2032
- Table 8: Global Veterinary Vaccine Industry Volume K Unit Forecast, by Region 2019 & 2032
- Table 9: Global Veterinary Vaccine Industry Revenue Million Forecast, by Country 2019 & 2032
- Table 10: Global Veterinary Vaccine Industry Volume K Unit Forecast, by Country 2019 & 2032
- Table 11: United States Veterinary Vaccine Industry Revenue (Million) Forecast, by Application 2019 & 2032
- Table 12: United States Veterinary Vaccine Industry Volume (K Unit) Forecast, by Application 2019 & 2032
- Table 13: Canada Veterinary Vaccine Industry Revenue (Million) Forecast, by Application 2019 & 2032
- Table 14: Canada Veterinary Vaccine Industry Volume (K Unit) Forecast, by Application 2019 & 2032
- Table 15: Mexico Veterinary Vaccine Industry Revenue (Million) Forecast, by Application 2019 & 2032
- Table 16: Mexico Veterinary Vaccine Industry Volume (K Unit) Forecast, by Application 2019 & 2032
- Table 17: Global Veterinary Vaccine Industry Revenue Million Forecast, by Country 2019 & 2032
- Table 18: Global Veterinary Vaccine Industry Volume K Unit Forecast, by Country 2019 & 2032
- Table 19: Germany Veterinary Vaccine Industry Revenue (Million) Forecast, by Application 2019 & 2032
- Table 20: Germany Veterinary Vaccine Industry Volume (K Unit) Forecast, by Application 2019 & 2032
- Table 21: United Kingdom Veterinary Vaccine Industry Revenue (Million) Forecast, by Application 2019 & 2032
- Table 22: United Kingdom Veterinary Vaccine Industry Volume (K Unit) Forecast, by Application 2019 & 2032
- Table 23: France Veterinary Vaccine Industry Revenue (Million) Forecast, by Application 2019 & 2032
- Table 24: France Veterinary Vaccine Industry Volume (K Unit) Forecast, by Application 2019 & 2032
- Table 25: Italy Veterinary Vaccine Industry Revenue (Million) Forecast, by Application 2019 & 2032
- Table 26: Italy Veterinary Vaccine Industry Volume (K Unit) Forecast, by Application 2019 & 2032
- Table 27: Spain Veterinary Vaccine Industry Revenue (Million) Forecast, by Application 2019 & 2032
- Table 28: Spain Veterinary Vaccine Industry Volume (K Unit) Forecast, by Application 2019 & 2032
- Table 29: Rest of Europe Veterinary Vaccine Industry Revenue (Million) Forecast, by Application 2019 & 2032
- Table 30: Rest of Europe Veterinary Vaccine Industry Volume (K Unit) Forecast, by Application 2019 & 2032
- Table 31: Global Veterinary Vaccine Industry Revenue Million Forecast, by Country 2019 & 2032
- Table 32: Global Veterinary Vaccine Industry Volume K Unit Forecast, by Country 2019 & 2032
- Table 33: China Veterinary Vaccine Industry Revenue (Million) Forecast, by Application 2019 & 2032
- Table 34: China Veterinary Vaccine Industry Volume (K Unit) Forecast, by Application 2019 & 2032
- Table 35: Japan Veterinary Vaccine Industry Revenue (Million) Forecast, by Application 2019 & 2032
- Table 36: Japan Veterinary Vaccine Industry Volume (K Unit) Forecast, by Application 2019 & 2032
- Table 37: India Veterinary Vaccine Industry Revenue (Million) Forecast, by Application 2019 & 2032
- Table 38: India Veterinary Vaccine Industry Volume (K Unit) Forecast, by Application 2019 & 2032
- Table 39: Australia Veterinary Vaccine Industry Revenue (Million) Forecast, by Application 2019 & 2032
- Table 40: Australia Veterinary Vaccine Industry Volume (K Unit) Forecast, by Application 2019 & 2032
- Table 41: South Korea Veterinary Vaccine Industry Revenue (Million) Forecast, by Application 2019 & 2032
- Table 42: South Korea Veterinary Vaccine Industry Volume (K Unit) Forecast, by Application 2019 & 2032
- Table 43: Rest of Asia Pacific Veterinary Vaccine Industry Revenue (Million) Forecast, by Application 2019 & 2032
- Table 44: Rest of Asia Pacific Veterinary Vaccine Industry Volume (K Unit) Forecast, by Application 2019 & 2032
- Table 45: Global Veterinary Vaccine Industry Revenue Million Forecast, by Country 2019 & 2032
- Table 46: Global Veterinary Vaccine Industry Volume K Unit Forecast, by Country 2019 & 2032
- Table 47: GCC Veterinary Vaccine Industry Revenue (Million) Forecast, by Application 2019 & 2032
- Table 48: GCC Veterinary Vaccine Industry Volume (K Unit) Forecast, by Application 2019 & 2032
- Table 49: South Africa Veterinary Vaccine Industry Revenue (Million) Forecast, by Application 2019 & 2032
- Table 50: South Africa Veterinary Vaccine Industry Volume (K Unit) Forecast, by Application 2019 & 2032
- Table 51: Rest of Middle East and Africa Veterinary Vaccine Industry Revenue (Million) Forecast, by Application 2019 & 2032
- Table 52: Rest of Middle East and Africa Veterinary Vaccine Industry Volume (K Unit) Forecast, by Application 2019 & 2032
- Table 53: Global Veterinary Vaccine Industry Revenue Million Forecast, by Country 2019 & 2032
- Table 54: Global Veterinary Vaccine Industry Volume K Unit Forecast, by Country 2019 & 2032
- Table 55: Brazil Veterinary Vaccine Industry Revenue (Million) Forecast, by Application 2019 & 2032
- Table 56: Brazil Veterinary Vaccine Industry Volume (K Unit) Forecast, by Application 2019 & 2032
- Table 57: Argentina Veterinary Vaccine Industry Revenue (Million) Forecast, by Application 2019 & 2032
- Table 58: Argentina Veterinary Vaccine Industry Volume (K Unit) Forecast, by Application 2019 & 2032
- Table 59: Rest of South America Veterinary Vaccine Industry Revenue (Million) Forecast, by Application 2019 & 2032
- Table 60: Rest of South America Veterinary Vaccine Industry Volume (K Unit) Forecast, by Application 2019 & 2032
- Table 61: Global Veterinary Vaccine Industry Revenue Million Forecast, by Vaccine Type 2019 & 2032
- Table 62: Global Veterinary Vaccine Industry Volume K Unit Forecast, by Vaccine Type 2019 & 2032
- Table 63: Global Veterinary Vaccine Industry Revenue Million Forecast, by Technology 2019 & 2032
- Table 64: Global Veterinary Vaccine Industry Volume K Unit Forecast, by Technology 2019 & 2032
- Table 65: Global Veterinary Vaccine Industry Revenue Million Forecast, by Country 2019 & 2032
- Table 66: Global Veterinary Vaccine Industry Volume K Unit Forecast, by Country 2019 & 2032
- Table 67: United States Veterinary Vaccine Industry Revenue (Million) Forecast, by Application 2019 & 2032
- Table 68: United States Veterinary Vaccine Industry Volume (K Unit) Forecast, by Application 2019 & 2032
- Table 69: Canada Veterinary Vaccine Industry Revenue (Million) Forecast, by Application 2019 & 2032
- Table 70: Canada Veterinary Vaccine Industry Volume (K Unit) Forecast, by Application 2019 & 2032
- Table 71: Mexico Veterinary Vaccine Industry Revenue (Million) Forecast, by Application 2019 & 2032
- Table 72: Mexico Veterinary Vaccine Industry Volume (K Unit) Forecast, by Application 2019 & 2032
- Table 73: Global Veterinary Vaccine Industry Revenue Million Forecast, by Vaccine Type 2019 & 2032
- Table 74: Global Veterinary Vaccine Industry Volume K Unit Forecast, by Vaccine Type 2019 & 2032
- Table 75: Global Veterinary Vaccine Industry Revenue Million Forecast, by Technology 2019 & 2032
- Table 76: Global Veterinary Vaccine Industry Volume K Unit Forecast, by Technology 2019 & 2032
- Table 77: Global Veterinary Vaccine Industry Revenue Million Forecast, by Country 2019 & 2032
- Table 78: Global Veterinary Vaccine Industry Volume K Unit Forecast, by Country 2019 & 2032
- Table 79: Germany Veterinary Vaccine Industry Revenue (Million) Forecast, by Application 2019 & 2032
- Table 80: Germany Veterinary Vaccine Industry Volume (K Unit) Forecast, by Application 2019 & 2032
- Table 81: United Kingdom Veterinary Vaccine Industry Revenue (Million) Forecast, by Application 2019 & 2032
- Table 82: United Kingdom Veterinary Vaccine Industry Volume (K Unit) Forecast, by Application 2019 & 2032
- Table 83: France Veterinary Vaccine Industry Revenue (Million) Forecast, by Application 2019 & 2032
- Table 84: France Veterinary Vaccine Industry Volume (K Unit) Forecast, by Application 2019 & 2032
- Table 85: Italy Veterinary Vaccine Industry Revenue (Million) Forecast, by Application 2019 & 2032
- Table 86: Italy Veterinary Vaccine Industry Volume (K Unit) Forecast, by Application 2019 & 2032
- Table 87: Spain Veterinary Vaccine Industry Revenue (Million) Forecast, by Application 2019 & 2032
- Table 88: Spain Veterinary Vaccine Industry Volume (K Unit) Forecast, by Application 2019 & 2032
- Table 89: Rest of Europe Veterinary Vaccine Industry Revenue (Million) Forecast, by Application 2019 & 2032
- Table 90: Rest of Europe Veterinary Vaccine Industry Volume (K Unit) Forecast, by Application 2019 & 2032
- Table 91: Global Veterinary Vaccine Industry Revenue Million Forecast, by Vaccine Type 2019 & 2032
- Table 92: Global Veterinary Vaccine Industry Volume K Unit Forecast, by Vaccine Type 2019 & 2032
- Table 93: Global Veterinary Vaccine Industry Revenue Million Forecast, by Technology 2019 & 2032
- Table 94: Global Veterinary Vaccine Industry Volume K Unit Forecast, by Technology 2019 & 2032
- Table 95: Global Veterinary Vaccine Industry Revenue Million Forecast, by Country 2019 & 2032
- Table 96: Global Veterinary Vaccine Industry Volume K Unit Forecast, by Country 2019 & 2032
- Table 97: China Veterinary Vaccine Industry Revenue (Million) Forecast, by Application 2019 & 2032
- Table 98: China Veterinary Vaccine Industry Volume (K Unit) Forecast, by Application 2019 & 2032
- Table 99: Japan Veterinary Vaccine Industry Revenue (Million) Forecast, by Application 2019 & 2032
- Table 100: Japan Veterinary Vaccine Industry Volume (K Unit) Forecast, by Application 2019 & 2032
- Table 101: India Veterinary Vaccine Industry Revenue (Million) Forecast, by Application 2019 & 2032
- Table 102: India Veterinary Vaccine Industry Volume (K Unit) Forecast, by Application 2019 & 2032
- Table 103: Australia Veterinary Vaccine Industry Revenue (Million) Forecast, by Application 2019 & 2032
- Table 104: Australia Veterinary Vaccine Industry Volume (K Unit) Forecast, by Application 2019 & 2032
- Table 105: South Korea Veterinary Vaccine Industry Revenue (Million) Forecast, by Application 2019 & 2032
- Table 106: South Korea Veterinary Vaccine Industry Volume (K Unit) Forecast, by Application 2019 & 2032
- Table 107: Rest of Asia Pacific Veterinary Vaccine Industry Revenue (Million) Forecast, by Application 2019 & 2032
- Table 108: Rest of Asia Pacific Veterinary Vaccine Industry Volume (K Unit) Forecast, by Application 2019 & 2032
- Table 109: Global Veterinary Vaccine Industry Revenue Million Forecast, by Vaccine Type 2019 & 2032
- Table 110: Global Veterinary Vaccine Industry Volume K Unit Forecast, by Vaccine Type 2019 & 2032
- Table 111: Global Veterinary Vaccine Industry Revenue Million Forecast, by Technology 2019 & 2032
- Table 112: Global Veterinary Vaccine Industry Volume K Unit Forecast, by Technology 2019 & 2032
- Table 113: Global Veterinary Vaccine Industry Revenue Million Forecast, by Country 2019 & 2032
- Table 114: Global Veterinary Vaccine Industry Volume K Unit Forecast, by Country 2019 & 2032
- Table 115: GCC Veterinary Vaccine Industry Revenue (Million) Forecast, by Application 2019 & 2032
- Table 116: GCC Veterinary Vaccine Industry Volume (K Unit) Forecast, by Application 2019 & 2032
- Table 117: South Africa Veterinary Vaccine Industry Revenue (Million) Forecast, by Application 2019 & 2032
- Table 118: South Africa Veterinary Vaccine Industry Volume (K Unit) Forecast, by Application 2019 & 2032
- Table 119: Rest of Middle East and Africa Veterinary Vaccine Industry Revenue (Million) Forecast, by Application 2019 & 2032
- Table 120: Rest of Middle East and Africa Veterinary Vaccine Industry Volume (K Unit) Forecast, by Application 2019 & 2032
- Table 121: Global Veterinary Vaccine Industry Revenue Million Forecast, by Vaccine Type 2019 & 2032
- Table 122: Global Veterinary Vaccine Industry Volume K Unit Forecast, by Vaccine Type 2019 & 2032
- Table 123: Global Veterinary Vaccine Industry Revenue Million Forecast, by Technology 2019 & 2032
- Table 124: Global Veterinary Vaccine Industry Volume K Unit Forecast, by Technology 2019 & 2032
- Table 125: Global Veterinary Vaccine Industry Revenue Million Forecast, by Country 2019 & 2032
- Table 126: Global Veterinary Vaccine Industry Volume K Unit Forecast, by Country 2019 & 2032
- Table 127: Brazil Veterinary Vaccine Industry Revenue (Million) Forecast, by Application 2019 & 2032
- Table 128: Brazil Veterinary Vaccine Industry Volume (K Unit) Forecast, by Application 2019 & 2032
- Table 129: Argentina Veterinary Vaccine Industry Revenue (Million) Forecast, by Application 2019 & 2032
- Table 130: Argentina Veterinary Vaccine Industry Volume (K Unit) Forecast, by Application 2019 & 2032
- Table 131: Rest of South America Veterinary Vaccine Industry Revenue (Million) Forecast, by Application 2019 & 2032
- Table 132: Rest of South America Veterinary Vaccine Industry Volume (K Unit) Forecast, by Application 2019 & 2032
Frequently Asked Questions
1. What is the projected Compound Annual Growth Rate (CAGR) of the Veterinary Vaccine Industry?
The projected CAGR is approximately 8.13%.
2. Which companies are prominent players in the Veterinary Vaccine Industry?
Key companies in the market include Boehringer Ingelheim International GmbH, Merck & Co Inc, HIPRA, Phibro Animal Health Corporation, Ceva Sante Animale, Virbac, Elanco Animal Health, Zoetis Inc, Hester Biosciences Limited.
3. What are the main segments of the Veterinary Vaccine Industry?
The market segments include Vaccine Type, Technology.
4. Can you provide details about the market size?
The market size is estimated to be USD 18.18 Million as of 2022.
5. What are some drivers contributing to market growth?
Increasing Incidence of Livestock Diseases; Increasing Pet Adoption Globally; Initiatives by Government Agencies. Animal Associations. and Leading Players.
6. What are the notable trends driving market growth?
The Canine Vaccines Segment is Expected to Hold a Significant Market Share Over the Forecast Period.
7. Are there any restraints impacting market growth?
High Storage Costs for Vaccines; Shortage of Veterinarians and Skilled Farm Workers.
8. Can you provide examples of recent developments in the market?
In September 2022, Merck Animal Health launched NobivacIntra-Trac Oral BbPi for the dual prevention of two major canine respiratory pathogens.
9. What pricing options are available for accessing the report?
Pricing options include single-user, multi-user, and enterprise licenses priced at USD 4750, USD 5250, and USD 8750 respectively.
10. Is the market size provided in terms of value or volume?
The market size is provided in terms of value, measured in Million and volume, measured in K Unit.
11. Are there any specific market keywords associated with the report?
Yes, the market keyword associated with the report is "Veterinary Vaccine Industry," which aids in identifying and referencing the specific market segment covered.
12. How do I determine which pricing option suits my needs best?
The pricing options vary based on user requirements and access needs. Individual users may opt for single-user licenses, while businesses requiring broader access may choose multi-user or enterprise licenses for cost-effective access to the report.
13. Are there any additional resources or data provided in the Veterinary Vaccine Industry report?
While the report offers comprehensive insights, it's advisable to review the specific contents or supplementary materials provided to ascertain if additional resources or data are available.
14. How can I stay updated on further developments or reports in the Veterinary Vaccine Industry?
To stay informed about further developments, trends, and reports in the Veterinary Vaccine Industry, consider subscribing to industry newsletters, following relevant companies and organizations, or regularly checking reputable industry news sources and publications.
Methodology
Step 1 - Identification of Relevant Samples Size from Population Database


Step 2 - Approaches for Defining Global Market Size (Value, Volume* & Price*)

Note*: In applicable scenarios
Step 3 - Data Sources
Primary Research
- Web Analytics
- Survey Reports
- Research Institute
- Latest Research Reports
- Opinion Leaders
Secondary Research
- Annual Reports
- White Paper
- Latest Press Release
- Industry Association
- Paid Database
- Investor Presentations

Step 4 - Data Triangulation
Involves using different sources of information in order to increase the validity of a study
These sources are likely to be stakeholders in a program - participants, other researchers, program staff, other community members, and so on.
Then we put all data in single framework & apply various statistical tools to find out the dynamic on the market.
During the analysis stage, feedback from the stakeholder groups would be compared to determine areas of agreement as well as areas of divergence


