
Key Insights
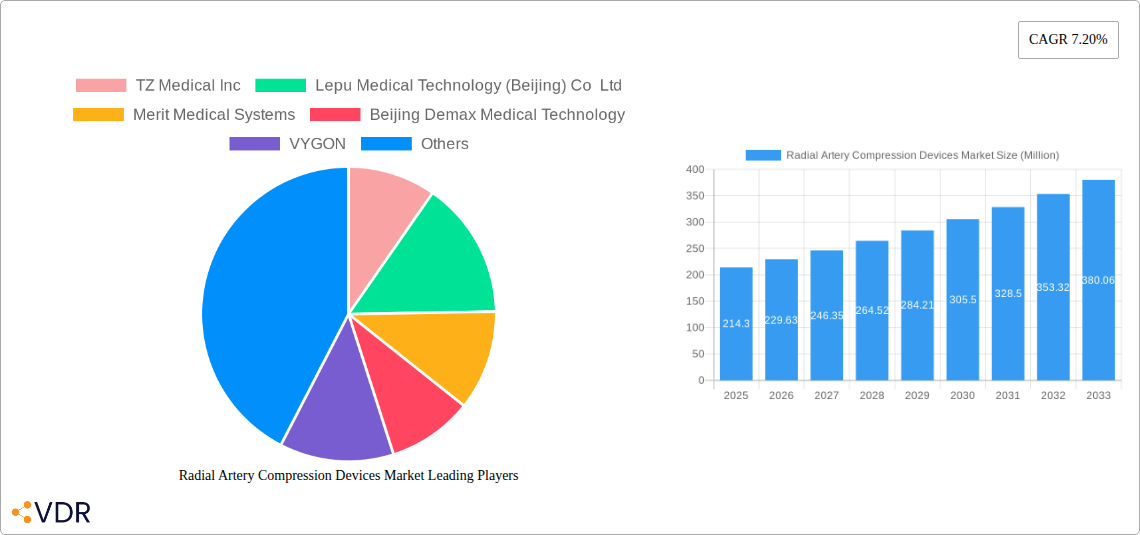
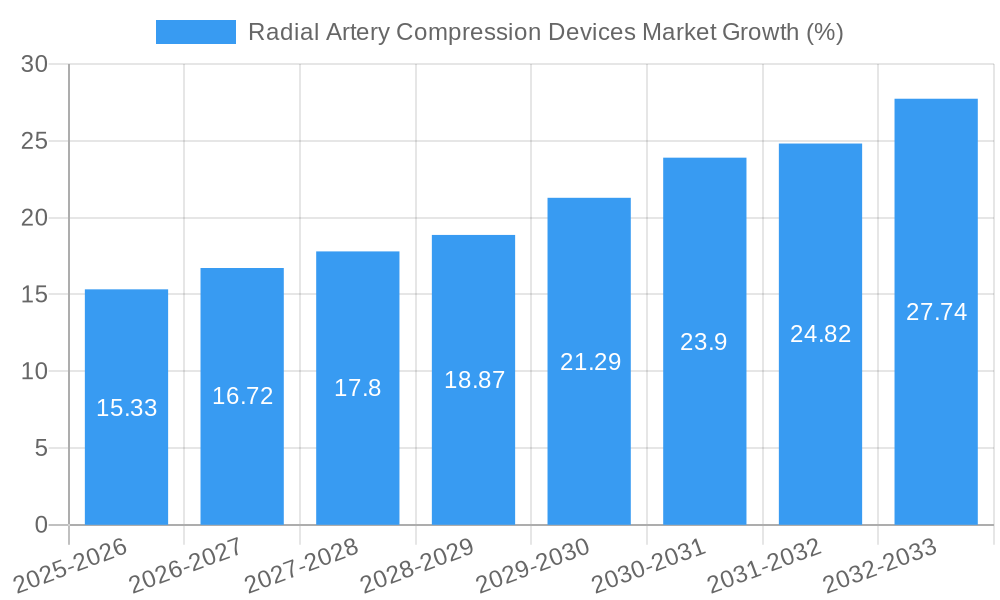
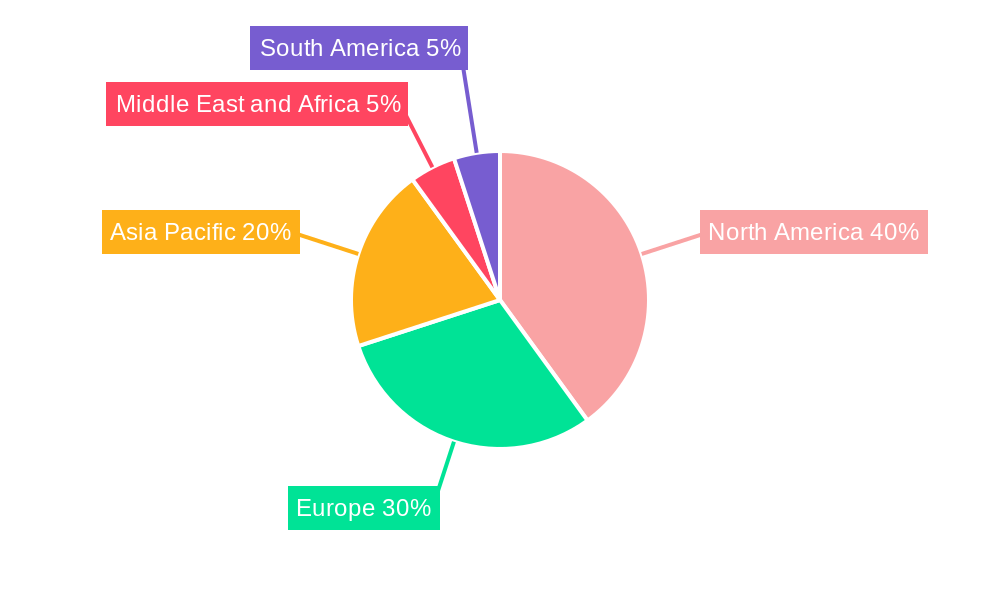
The global radial artery compression devices market, valued at $214.30 million in 2025, is projected to experience robust growth, driven by a Compound Annual Growth Rate (CAGR) of 7.20% from 2025 to 2033. This expansion is fueled by several key factors. The increasing prevalence of cardiovascular diseases necessitates more frequent radial artery access procedures, boosting demand for reliable and efficient compression devices. Technological advancements, such as the development of more comfortable and user-friendly devices with improved hemostasis capabilities, are further propelling market growth. The rising adoption of minimally invasive surgical procedures and the growing preference for radial artery access over femoral artery access in cardiac catheterization contribute significantly to market expansion. Furthermore, the increasing number of ambulatory surgical centers and the rising geriatric population, susceptible to cardiovascular complications, are expected to fuel demand. The market segmentation reveals a preference for band/strap-based devices, driven by their ease of use and cost-effectiveness. Reusable devices are also gaining traction, offering a cost-effective alternative to single-use products. Geographically, North America and Europe currently hold significant market shares, but the Asia-Pacific region is poised for substantial growth due to increasing healthcare infrastructure development and rising disposable incomes.
Competitive rivalry is intense, with key players such as TZ Medical Inc., Lepu Medical Technology, Merit Medical Systems, and others continuously innovating to improve their product offerings. The market faces certain restraints, including potential complications associated with radial artery compression, such as hematoma formation and arteriospasm. However, ongoing research and development efforts are focused on mitigating these risks. The future trajectory of the market will likely be influenced by advancements in material science leading to the development of more biocompatible and durable compression devices, as well as the adoption of telehealth and remote patient monitoring solutions. The focus on improving patient comfort and reducing post-procedure complications will also drive the market's future growth. Strategic partnerships and mergers & acquisitions amongst industry players are anticipated to further shape the market landscape.
Radial Artery Compression Devices Market: A Comprehensive Market Report (2019-2033)
This in-depth report provides a comprehensive analysis of the Radial Artery Compression Devices market, encompassing market dynamics, growth trends, regional insights, competitive landscape, and future outlook. The study period covers 2019-2033, with 2025 as the base and estimated year. This report is essential for industry professionals, investors, and stakeholders seeking to understand and capitalize on opportunities within this dynamic market segment. The total market size is projected to reach xx Million units by 2033.
Radial Artery Compression Devices Market Market Dynamics & Structure
The Radial Artery Compression Devices market is characterized by moderate concentration, with key players like TZ Medical Inc, Lepu Medical Technology, and Merit Medical Systems holding significant market share. Technological innovation, particularly in materials science and device design, is a key driver. Stringent regulatory frameworks governing medical devices influence market entry and product approvals. Competitive substitutes include manual compression techniques, however, the advantages of radial artery compression devices in terms of consistent pressure and ease of use drive market growth. The end-user demographic is primarily hospitals and ambulatory surgical centers, with a growing demand from other end-users. Mergers and acquisitions (M&A) activity is moderate, with occasional strategic partnerships shaping the competitive landscape.
- Market Concentration: Moderately concentrated, with top 5 players holding approximately xx% market share in 2025.
- Technological Innovation: Focus on improved hemostasis, ease of use, and reduced post-procedure complications.
- Regulatory Landscape: Stringent regulatory approvals (e.g., FDA 510(k) clearance) impacting market entry.
- Competitive Substitutes: Manual compression techniques, but devices offer superior control and efficiency.
- M&A Activity: Moderate, with xx M&A deals observed in the historical period (2019-2024).
- Innovation Barriers: High regulatory hurdles, significant R&D investment, and competition from established players.
Radial Artery Compression Devices Market Growth Trends & Insights
The Radial Artery Compression Devices market experienced steady growth during the historical period (2019-2024), driven by increasing adoption rates in cardiovascular procedures and a preference for minimally invasive techniques. The market size was valued at xx Million units in 2024 and is projected to register a CAGR of xx% during the forecast period (2025-2033), reaching xx Million units by 2033. This growth is fueled by technological advancements leading to improved device performance and patient outcomes. Increased awareness among healthcare professionals regarding the benefits of radial artery access further enhances market adoption. Consumer behavior shifts towards minimally invasive procedures are also contributing factors.
Dominant Regions, Countries, or Segments in Radial Artery Compression Devices Market
North America currently dominates the Radial Artery Compression Devices market, owing to high healthcare expenditure, advanced medical infrastructure, and early adoption of innovative technologies. Within product segments, Band/Strap based devices hold the largest market share, followed by Knob-based and Plate-based devices. Replaceable devices are more prevalent than reusable devices due to hygiene concerns and cost-effectiveness in the long run. Surgical interventions contribute significantly to the application segment.
- Leading Region: North America, followed by Europe and Asia-Pacific.
- Key Drivers: High healthcare spending, advanced medical infrastructure, increasing prevalence of cardiovascular diseases.
- Market Share: North America holds approximately xx% of the global market share in 2025.
- Growth Potential: Asia-Pacific region is expected to exhibit significant growth due to rising healthcare awareness and increasing disposable incomes.
- Dominant Segment (by Product): Band/Strap based devices, accounting for xx% of the market in 2025.
- Dominant Segment (by Usage): Replaceable devices, due to hygienic advantages and cost efficiency.
- Dominant Segment (by Application): Surgical interventions, driven by the increasing number of cardiovascular procedures.
Radial Artery Compression Devices Market Product Landscape
The Radial Artery Compression Devices market offers a diverse range of products, including band/strap-based, knob-based, and plate-based devices. Recent innovations focus on improved hemostasis, ease of use, and patient comfort. Key features include adjustable compression levels, ergonomic designs, and materials that minimize skin irritation. Unique selling propositions include enhanced patency rates, reduced bleeding complications, and faster patient recovery times. Technological advancements such as integrated pressure monitoring systems are gaining traction.
Key Drivers, Barriers & Challenges in Radial Artery Compression Devices Market
Key Drivers:
- Rising prevalence of cardiovascular diseases driving the demand for radial artery access procedures.
- Technological advancements resulting in improved device efficacy and patient outcomes.
- Growing preference for minimally invasive surgical procedures.
Challenges & Restraints:
- Stringent regulatory requirements increasing the cost and time to market.
- High initial investment costs associated with adopting new devices.
- Competition from established players and emerging market entrants.
Emerging Opportunities in Radial Artery Compression Devices Market
- Expanding into untapped markets, particularly in developing economies.
- Development of innovative devices with advanced features like integrated pressure monitoring and automated compression control.
- Focus on improving patient comfort and reducing post-procedure complications.
Growth Accelerators in the Radial Artery Compression Devices Market Industry
Technological breakthroughs in materials science and device design are key growth accelerators. Strategic partnerships between device manufacturers and healthcare providers can enhance market penetration. Expansion into emerging markets and development of new applications for radial artery compression devices further contribute to long-term growth.
Key Players Shaping the Radial Artery Compression Devices Market Market
- TZ Medical Inc
- Lepu Medical Technology (Beijing) Co Ltd
- Merit Medical Systems
- Beijing Demax Medical Technology
- VYGON
- Forge Medical
- Terumo Corporation
- Abbott
- Semler Technologies Inc
- Teleflex Incorporated
- Advin Health Care
Notable Milestones in Radial Artery Compression Devices Market Sector
- June 2023: TZ Medical introduced Roc Band, a new radial hemostasis band.
- November 2022: Merit Medical Systems launched PreludeSYNC EZ Radial Compression Device.
In-Depth Radial Artery Compression Devices Market Market Outlook
The Radial Artery Compression Devices market is poised for continued growth, driven by technological advancements, expanding applications, and increasing awareness among healthcare professionals. Strategic partnerships and market expansion into developing countries represent significant opportunities for growth. The focus on improving device performance and patient outcomes will shape the future of this market.
Radial Artery Compression Devices Market Segmentation
-
1. Product
- 1.1. Band/Strap Based
- 1.2. Knob-based
- 1.3. Plate-based
-
2. Usage
- 2.1. Replaceable Device
- 2.2. Resuable Device
-
3. Application
- 3.1. Surgical Intervention
- 3.2. Diagnostics
-
4. End User
- 4.1. Hospitals
- 4.2. Ambulatory Surgical Centers
- 4.3. Other End Users
Radial Artery Compression Devices Market Segmentation By Geography
-
1. North America
- 1.1. United States
- 1.2. Canada
- 1.3. Mexico
-
2. Europe
- 2.1. Germany
- 2.2. United Kingdom
- 2.3. France
- 2.4. Italy
- 2.5. Spain
- 2.6. Rest of Europe
-
3. Asia Pacific
- 3.1. China
- 3.2. Japan
- 3.3. India
- 3.4. Australia
- 3.5. South Korea
- 3.6. Rest of Asia Pacific
-
4. Middle East and Africa
- 4.1. GCC
- 4.2. South Africa
- 4.3. Rest of Middle East and Africa
-
5. South America
- 5.1. Brazil
- 5.2. Argentina
- 5.3. Rest of South America
Radial Artery Compression Devices Market REPORT HIGHLIGHTS
| Aspects | Details |
|---|---|
| Study Period | 2019-2033 |
| Base Year | 2024 |
| Estimated Year | 2025 |
| Forecast Period | 2025-2033 |
| Historical Period | 2019-2024 |
| Growth Rate | CAGR of 7.20% from 2019-2033 |
| Segmentation |
|
Table of Contents
- 1. Introduction
- 1.1. Research Scope
- 1.2. Market Segmentation
- 1.3. Research Methodology
- 1.4. Definitions and Assumptions
- 2. Executive Summary
- 2.1. Introduction
- 3. Market Dynamics
- 3.1. Introduction
- 3.2. Market Drivers
- 3.2.1. Increasing Prevelance of Cardiovascular Diseases; Growing Preference for Radial Artery Access
- 3.3. Market Restrains
- 3.3.1. Variability in Reimbursement Policies; Potential Complications at the Access Site
- 3.4. Market Trends
- 3.4.1. Surgical Intervention Application is Expected to Have Significant Growth
- 4. Market Factor Analysis
- 4.1. Porters Five Forces
- 4.2. Supply/Value Chain
- 4.3. PESTEL analysis
- 4.4. Market Entropy
- 4.5. Patent/Trademark Analysis
- 5. Global Radial Artery Compression Devices Market Analysis, Insights and Forecast, 2019-2031
- 5.1. Market Analysis, Insights and Forecast - by Product
- 5.1.1. Band/Strap Based
- 5.1.2. Knob-based
- 5.1.3. Plate-based
- 5.2. Market Analysis, Insights and Forecast - by Usage
- 5.2.1. Replaceable Device
- 5.2.2. Resuable Device
- 5.3. Market Analysis, Insights and Forecast - by Application
- 5.3.1. Surgical Intervention
- 5.3.2. Diagnostics
- 5.4. Market Analysis, Insights and Forecast - by End User
- 5.4.1. Hospitals
- 5.4.2. Ambulatory Surgical Centers
- 5.4.3. Other End Users
- 5.5. Market Analysis, Insights and Forecast - by Region
- 5.5.1. North America
- 5.5.2. Europe
- 5.5.3. Asia Pacific
- 5.5.4. Middle East and Africa
- 5.5.5. South America
- 5.1. Market Analysis, Insights and Forecast - by Product
- 6. North America Radial Artery Compression Devices Market Analysis, Insights and Forecast, 2019-2031
- 6.1. Market Analysis, Insights and Forecast - by Product
- 6.1.1. Band/Strap Based
- 6.1.2. Knob-based
- 6.1.3. Plate-based
- 6.2. Market Analysis, Insights and Forecast - by Usage
- 6.2.1. Replaceable Device
- 6.2.2. Resuable Device
- 6.3. Market Analysis, Insights and Forecast - by Application
- 6.3.1. Surgical Intervention
- 6.3.2. Diagnostics
- 6.4. Market Analysis, Insights and Forecast - by End User
- 6.4.1. Hospitals
- 6.4.2. Ambulatory Surgical Centers
- 6.4.3. Other End Users
- 6.1. Market Analysis, Insights and Forecast - by Product
- 7. Europe Radial Artery Compression Devices Market Analysis, Insights and Forecast, 2019-2031
- 7.1. Market Analysis, Insights and Forecast - by Product
- 7.1.1. Band/Strap Based
- 7.1.2. Knob-based
- 7.1.3. Plate-based
- 7.2. Market Analysis, Insights and Forecast - by Usage
- 7.2.1. Replaceable Device
- 7.2.2. Resuable Device
- 7.3. Market Analysis, Insights and Forecast - by Application
- 7.3.1. Surgical Intervention
- 7.3.2. Diagnostics
- 7.4. Market Analysis, Insights and Forecast - by End User
- 7.4.1. Hospitals
- 7.4.2. Ambulatory Surgical Centers
- 7.4.3. Other End Users
- 7.1. Market Analysis, Insights and Forecast - by Product
- 8. Asia Pacific Radial Artery Compression Devices Market Analysis, Insights and Forecast, 2019-2031
- 8.1. Market Analysis, Insights and Forecast - by Product
- 8.1.1. Band/Strap Based
- 8.1.2. Knob-based
- 8.1.3. Plate-based
- 8.2. Market Analysis, Insights and Forecast - by Usage
- 8.2.1. Replaceable Device
- 8.2.2. Resuable Device
- 8.3. Market Analysis, Insights and Forecast - by Application
- 8.3.1. Surgical Intervention
- 8.3.2. Diagnostics
- 8.4. Market Analysis, Insights and Forecast - by End User
- 8.4.1. Hospitals
- 8.4.2. Ambulatory Surgical Centers
- 8.4.3. Other End Users
- 8.1. Market Analysis, Insights and Forecast - by Product
- 9. Middle East and Africa Radial Artery Compression Devices Market Analysis, Insights and Forecast, 2019-2031
- 9.1. Market Analysis, Insights and Forecast - by Product
- 9.1.1. Band/Strap Based
- 9.1.2. Knob-based
- 9.1.3. Plate-based
- 9.2. Market Analysis, Insights and Forecast - by Usage
- 9.2.1. Replaceable Device
- 9.2.2. Resuable Device
- 9.3. Market Analysis, Insights and Forecast - by Application
- 9.3.1. Surgical Intervention
- 9.3.2. Diagnostics
- 9.4. Market Analysis, Insights and Forecast - by End User
- 9.4.1. Hospitals
- 9.4.2. Ambulatory Surgical Centers
- 9.4.3. Other End Users
- 9.1. Market Analysis, Insights and Forecast - by Product
- 10. South America Radial Artery Compression Devices Market Analysis, Insights and Forecast, 2019-2031
- 10.1. Market Analysis, Insights and Forecast - by Product
- 10.1.1. Band/Strap Based
- 10.1.2. Knob-based
- 10.1.3. Plate-based
- 10.2. Market Analysis, Insights and Forecast - by Usage
- 10.2.1. Replaceable Device
- 10.2.2. Resuable Device
- 10.3. Market Analysis, Insights and Forecast - by Application
- 10.3.1. Surgical Intervention
- 10.3.2. Diagnostics
- 10.4. Market Analysis, Insights and Forecast - by End User
- 10.4.1. Hospitals
- 10.4.2. Ambulatory Surgical Centers
- 10.4.3. Other End Users
- 10.1. Market Analysis, Insights and Forecast - by Product
- 11. North America Radial Artery Compression Devices Market Analysis, Insights and Forecast, 2019-2031
- 11.1. Market Analysis, Insights and Forecast - By Country/Sub-region
- 11.1.1 United States
- 11.1.2 Canada
- 11.1.3 Mexico
- 12. Europe Radial Artery Compression Devices Market Analysis, Insights and Forecast, 2019-2031
- 12.1. Market Analysis, Insights and Forecast - By Country/Sub-region
- 12.1.1 Germany
- 12.1.2 United Kingdom
- 12.1.3 France
- 12.1.4 Italy
- 12.1.5 Spain
- 12.1.6 Rest of Europe
- 13. Asia Pacific Radial Artery Compression Devices Market Analysis, Insights and Forecast, 2019-2031
- 13.1. Market Analysis, Insights and Forecast - By Country/Sub-region
- 13.1.1 China
- 13.1.2 Japan
- 13.1.3 India
- 13.1.4 Australia
- 13.1.5 South Korea
- 13.1.6 Rest of Asia Pacific
- 14. Middle East and Africa Radial Artery Compression Devices Market Analysis, Insights and Forecast, 2019-2031
- 14.1. Market Analysis, Insights and Forecast - By Country/Sub-region
- 14.1.1 GCC
- 14.1.2 South Africa
- 14.1.3 Rest of Middle East and Africa
- 15. South America Radial Artery Compression Devices Market Analysis, Insights and Forecast, 2019-2031
- 15.1. Market Analysis, Insights and Forecast - By Country/Sub-region
- 15.1.1 Brazil
- 15.1.2 Argentina
- 15.1.3 Rest of South America
- 16. Competitive Analysis
- 16.1. Global Market Share Analysis 2024
- 16.2. Company Profiles
- 16.2.1 TZ Medical Inc
- 16.2.1.1. Overview
- 16.2.1.2. Products
- 16.2.1.3. SWOT Analysis
- 16.2.1.4. Recent Developments
- 16.2.1.5. Financials (Based on Availability)
- 16.2.2 Lepu Medical Technology (Beijing) Co Ltd
- 16.2.2.1. Overview
- 16.2.2.2. Products
- 16.2.2.3. SWOT Analysis
- 16.2.2.4. Recent Developments
- 16.2.2.5. Financials (Based on Availability)
- 16.2.3 Merit Medical Systems
- 16.2.3.1. Overview
- 16.2.3.2. Products
- 16.2.3.3. SWOT Analysis
- 16.2.3.4. Recent Developments
- 16.2.3.5. Financials (Based on Availability)
- 16.2.4 Beijing Demax Medical Technology
- 16.2.4.1. Overview
- 16.2.4.2. Products
- 16.2.4.3. SWOT Analysis
- 16.2.4.4. Recent Developments
- 16.2.4.5. Financials (Based on Availability)
- 16.2.5 VYGON
- 16.2.5.1. Overview
- 16.2.5.2. Products
- 16.2.5.3. SWOT Analysis
- 16.2.5.4. Recent Developments
- 16.2.5.5. Financials (Based on Availability)
- 16.2.6 Forge Medical
- 16.2.6.1. Overview
- 16.2.6.2. Products
- 16.2.6.3. SWOT Analysis
- 16.2.6.4. Recent Developments
- 16.2.6.5. Financials (Based on Availability)
- 16.2.7 Terumo Corporation
- 16.2.7.1. Overview
- 16.2.7.2. Products
- 16.2.7.3. SWOT Analysis
- 16.2.7.4. Recent Developments
- 16.2.7.5. Financials (Based on Availability)
- 16.2.8 Abbott
- 16.2.8.1. Overview
- 16.2.8.2. Products
- 16.2.8.3. SWOT Analysis
- 16.2.8.4. Recent Developments
- 16.2.8.5. Financials (Based on Availability)
- 16.2.9 Semler Technologies Inc
- 16.2.9.1. Overview
- 16.2.9.2. Products
- 16.2.9.3. SWOT Analysis
- 16.2.9.4. Recent Developments
- 16.2.9.5. Financials (Based on Availability)
- 16.2.10 Teleflex Incorporated
- 16.2.10.1. Overview
- 16.2.10.2. Products
- 16.2.10.3. SWOT Analysis
- 16.2.10.4. Recent Developments
- 16.2.10.5. Financials (Based on Availability)
- 16.2.11 Advin Health Care
- 16.2.11.1. Overview
- 16.2.11.2. Products
- 16.2.11.3. SWOT Analysis
- 16.2.11.4. Recent Developments
- 16.2.11.5. Financials (Based on Availability)
- 16.2.1 TZ Medical Inc
List of Figures
- Figure 1: Global Radial Artery Compression Devices Market Revenue Breakdown (Million, %) by Region 2024 & 2032
- Figure 2: Global Radial Artery Compression Devices Market Volume Breakdown (K Unit, %) by Region 2024 & 2032
- Figure 3: North America Radial Artery Compression Devices Market Revenue (Million), by Country 2024 & 2032
- Figure 4: North America Radial Artery Compression Devices Market Volume (K Unit), by Country 2024 & 2032
- Figure 5: North America Radial Artery Compression Devices Market Revenue Share (%), by Country 2024 & 2032
- Figure 6: North America Radial Artery Compression Devices Market Volume Share (%), by Country 2024 & 2032
- Figure 7: Europe Radial Artery Compression Devices Market Revenue (Million), by Country 2024 & 2032
- Figure 8: Europe Radial Artery Compression Devices Market Volume (K Unit), by Country 2024 & 2032
- Figure 9: Europe Radial Artery Compression Devices Market Revenue Share (%), by Country 2024 & 2032
- Figure 10: Europe Radial Artery Compression Devices Market Volume Share (%), by Country 2024 & 2032
- Figure 11: Asia Pacific Radial Artery Compression Devices Market Revenue (Million), by Country 2024 & 2032
- Figure 12: Asia Pacific Radial Artery Compression Devices Market Volume (K Unit), by Country 2024 & 2032
- Figure 13: Asia Pacific Radial Artery Compression Devices Market Revenue Share (%), by Country 2024 & 2032
- Figure 14: Asia Pacific Radial Artery Compression Devices Market Volume Share (%), by Country 2024 & 2032
- Figure 15: Middle East and Africa Radial Artery Compression Devices Market Revenue (Million), by Country 2024 & 2032
- Figure 16: Middle East and Africa Radial Artery Compression Devices Market Volume (K Unit), by Country 2024 & 2032
- Figure 17: Middle East and Africa Radial Artery Compression Devices Market Revenue Share (%), by Country 2024 & 2032
- Figure 18: Middle East and Africa Radial Artery Compression Devices Market Volume Share (%), by Country 2024 & 2032
- Figure 19: South America Radial Artery Compression Devices Market Revenue (Million), by Country 2024 & 2032
- Figure 20: South America Radial Artery Compression Devices Market Volume (K Unit), by Country 2024 & 2032
- Figure 21: South America Radial Artery Compression Devices Market Revenue Share (%), by Country 2024 & 2032
- Figure 22: South America Radial Artery Compression Devices Market Volume Share (%), by Country 2024 & 2032
- Figure 23: North America Radial Artery Compression Devices Market Revenue (Million), by Product 2024 & 2032
- Figure 24: North America Radial Artery Compression Devices Market Volume (K Unit), by Product 2024 & 2032
- Figure 25: North America Radial Artery Compression Devices Market Revenue Share (%), by Product 2024 & 2032
- Figure 26: North America Radial Artery Compression Devices Market Volume Share (%), by Product 2024 & 2032
- Figure 27: North America Radial Artery Compression Devices Market Revenue (Million), by Usage 2024 & 2032
- Figure 28: North America Radial Artery Compression Devices Market Volume (K Unit), by Usage 2024 & 2032
- Figure 29: North America Radial Artery Compression Devices Market Revenue Share (%), by Usage 2024 & 2032
- Figure 30: North America Radial Artery Compression Devices Market Volume Share (%), by Usage 2024 & 2032
- Figure 31: North America Radial Artery Compression Devices Market Revenue (Million), by Application 2024 & 2032
- Figure 32: North America Radial Artery Compression Devices Market Volume (K Unit), by Application 2024 & 2032
- Figure 33: North America Radial Artery Compression Devices Market Revenue Share (%), by Application 2024 & 2032
- Figure 34: North America Radial Artery Compression Devices Market Volume Share (%), by Application 2024 & 2032
- Figure 35: North America Radial Artery Compression Devices Market Revenue (Million), by End User 2024 & 2032
- Figure 36: North America Radial Artery Compression Devices Market Volume (K Unit), by End User 2024 & 2032
- Figure 37: North America Radial Artery Compression Devices Market Revenue Share (%), by End User 2024 & 2032
- Figure 38: North America Radial Artery Compression Devices Market Volume Share (%), by End User 2024 & 2032
- Figure 39: North America Radial Artery Compression Devices Market Revenue (Million), by Country 2024 & 2032
- Figure 40: North America Radial Artery Compression Devices Market Volume (K Unit), by Country 2024 & 2032
- Figure 41: North America Radial Artery Compression Devices Market Revenue Share (%), by Country 2024 & 2032
- Figure 42: North America Radial Artery Compression Devices Market Volume Share (%), by Country 2024 & 2032
- Figure 43: Europe Radial Artery Compression Devices Market Revenue (Million), by Product 2024 & 2032
- Figure 44: Europe Radial Artery Compression Devices Market Volume (K Unit), by Product 2024 & 2032
- Figure 45: Europe Radial Artery Compression Devices Market Revenue Share (%), by Product 2024 & 2032
- Figure 46: Europe Radial Artery Compression Devices Market Volume Share (%), by Product 2024 & 2032
- Figure 47: Europe Radial Artery Compression Devices Market Revenue (Million), by Usage 2024 & 2032
- Figure 48: Europe Radial Artery Compression Devices Market Volume (K Unit), by Usage 2024 & 2032
- Figure 49: Europe Radial Artery Compression Devices Market Revenue Share (%), by Usage 2024 & 2032
- Figure 50: Europe Radial Artery Compression Devices Market Volume Share (%), by Usage 2024 & 2032
- Figure 51: Europe Radial Artery Compression Devices Market Revenue (Million), by Application 2024 & 2032
- Figure 52: Europe Radial Artery Compression Devices Market Volume (K Unit), by Application 2024 & 2032
- Figure 53: Europe Radial Artery Compression Devices Market Revenue Share (%), by Application 2024 & 2032
- Figure 54: Europe Radial Artery Compression Devices Market Volume Share (%), by Application 2024 & 2032
- Figure 55: Europe Radial Artery Compression Devices Market Revenue (Million), by End User 2024 & 2032
- Figure 56: Europe Radial Artery Compression Devices Market Volume (K Unit), by End User 2024 & 2032
- Figure 57: Europe Radial Artery Compression Devices Market Revenue Share (%), by End User 2024 & 2032
- Figure 58: Europe Radial Artery Compression Devices Market Volume Share (%), by End User 2024 & 2032
- Figure 59: Europe Radial Artery Compression Devices Market Revenue (Million), by Country 2024 & 2032
- Figure 60: Europe Radial Artery Compression Devices Market Volume (K Unit), by Country 2024 & 2032
- Figure 61: Europe Radial Artery Compression Devices Market Revenue Share (%), by Country 2024 & 2032
- Figure 62: Europe Radial Artery Compression Devices Market Volume Share (%), by Country 2024 & 2032
- Figure 63: Asia Pacific Radial Artery Compression Devices Market Revenue (Million), by Product 2024 & 2032
- Figure 64: Asia Pacific Radial Artery Compression Devices Market Volume (K Unit), by Product 2024 & 2032
- Figure 65: Asia Pacific Radial Artery Compression Devices Market Revenue Share (%), by Product 2024 & 2032
- Figure 66: Asia Pacific Radial Artery Compression Devices Market Volume Share (%), by Product 2024 & 2032
- Figure 67: Asia Pacific Radial Artery Compression Devices Market Revenue (Million), by Usage 2024 & 2032
- Figure 68: Asia Pacific Radial Artery Compression Devices Market Volume (K Unit), by Usage 2024 & 2032
- Figure 69: Asia Pacific Radial Artery Compression Devices Market Revenue Share (%), by Usage 2024 & 2032
- Figure 70: Asia Pacific Radial Artery Compression Devices Market Volume Share (%), by Usage 2024 & 2032
- Figure 71: Asia Pacific Radial Artery Compression Devices Market Revenue (Million), by Application 2024 & 2032
- Figure 72: Asia Pacific Radial Artery Compression Devices Market Volume (K Unit), by Application 2024 & 2032
- Figure 73: Asia Pacific Radial Artery Compression Devices Market Revenue Share (%), by Application 2024 & 2032
- Figure 74: Asia Pacific Radial Artery Compression Devices Market Volume Share (%), by Application 2024 & 2032
- Figure 75: Asia Pacific Radial Artery Compression Devices Market Revenue (Million), by End User 2024 & 2032
- Figure 76: Asia Pacific Radial Artery Compression Devices Market Volume (K Unit), by End User 2024 & 2032
- Figure 77: Asia Pacific Radial Artery Compression Devices Market Revenue Share (%), by End User 2024 & 2032
- Figure 78: Asia Pacific Radial Artery Compression Devices Market Volume Share (%), by End User 2024 & 2032
- Figure 79: Asia Pacific Radial Artery Compression Devices Market Revenue (Million), by Country 2024 & 2032
- Figure 80: Asia Pacific Radial Artery Compression Devices Market Volume (K Unit), by Country 2024 & 2032
- Figure 81: Asia Pacific Radial Artery Compression Devices Market Revenue Share (%), by Country 2024 & 2032
- Figure 82: Asia Pacific Radial Artery Compression Devices Market Volume Share (%), by Country 2024 & 2032
- Figure 83: Middle East and Africa Radial Artery Compression Devices Market Revenue (Million), by Product 2024 & 2032
- Figure 84: Middle East and Africa Radial Artery Compression Devices Market Volume (K Unit), by Product 2024 & 2032
- Figure 85: Middle East and Africa Radial Artery Compression Devices Market Revenue Share (%), by Product 2024 & 2032
- Figure 86: Middle East and Africa Radial Artery Compression Devices Market Volume Share (%), by Product 2024 & 2032
- Figure 87: Middle East and Africa Radial Artery Compression Devices Market Revenue (Million), by Usage 2024 & 2032
- Figure 88: Middle East and Africa Radial Artery Compression Devices Market Volume (K Unit), by Usage 2024 & 2032
- Figure 89: Middle East and Africa Radial Artery Compression Devices Market Revenue Share (%), by Usage 2024 & 2032
- Figure 90: Middle East and Africa Radial Artery Compression Devices Market Volume Share (%), by Usage 2024 & 2032
- Figure 91: Middle East and Africa Radial Artery Compression Devices Market Revenue (Million), by Application 2024 & 2032
- Figure 92: Middle East and Africa Radial Artery Compression Devices Market Volume (K Unit), by Application 2024 & 2032
- Figure 93: Middle East and Africa Radial Artery Compression Devices Market Revenue Share (%), by Application 2024 & 2032
- Figure 94: Middle East and Africa Radial Artery Compression Devices Market Volume Share (%), by Application 2024 & 2032
- Figure 95: Middle East and Africa Radial Artery Compression Devices Market Revenue (Million), by End User 2024 & 2032
- Figure 96: Middle East and Africa Radial Artery Compression Devices Market Volume (K Unit), by End User 2024 & 2032
- Figure 97: Middle East and Africa Radial Artery Compression Devices Market Revenue Share (%), by End User 2024 & 2032
- Figure 98: Middle East and Africa Radial Artery Compression Devices Market Volume Share (%), by End User 2024 & 2032
- Figure 99: Middle East and Africa Radial Artery Compression Devices Market Revenue (Million), by Country 2024 & 2032
- Figure 100: Middle East and Africa Radial Artery Compression Devices Market Volume (K Unit), by Country 2024 & 2032
- Figure 101: Middle East and Africa Radial Artery Compression Devices Market Revenue Share (%), by Country 2024 & 2032
- Figure 102: Middle East and Africa Radial Artery Compression Devices Market Volume Share (%), by Country 2024 & 2032
- Figure 103: South America Radial Artery Compression Devices Market Revenue (Million), by Product 2024 & 2032
- Figure 104: South America Radial Artery Compression Devices Market Volume (K Unit), by Product 2024 & 2032
- Figure 105: South America Radial Artery Compression Devices Market Revenue Share (%), by Product 2024 & 2032
- Figure 106: South America Radial Artery Compression Devices Market Volume Share (%), by Product 2024 & 2032
- Figure 107: South America Radial Artery Compression Devices Market Revenue (Million), by Usage 2024 & 2032
- Figure 108: South America Radial Artery Compression Devices Market Volume (K Unit), by Usage 2024 & 2032
- Figure 109: South America Radial Artery Compression Devices Market Revenue Share (%), by Usage 2024 & 2032
- Figure 110: South America Radial Artery Compression Devices Market Volume Share (%), by Usage 2024 & 2032
- Figure 111: South America Radial Artery Compression Devices Market Revenue (Million), by Application 2024 & 2032
- Figure 112: South America Radial Artery Compression Devices Market Volume (K Unit), by Application 2024 & 2032
- Figure 113: South America Radial Artery Compression Devices Market Revenue Share (%), by Application 2024 & 2032
- Figure 114: South America Radial Artery Compression Devices Market Volume Share (%), by Application 2024 & 2032
- Figure 115: South America Radial Artery Compression Devices Market Revenue (Million), by End User 2024 & 2032
- Figure 116: South America Radial Artery Compression Devices Market Volume (K Unit), by End User 2024 & 2032
- Figure 117: South America Radial Artery Compression Devices Market Revenue Share (%), by End User 2024 & 2032
- Figure 118: South America Radial Artery Compression Devices Market Volume Share (%), by End User 2024 & 2032
- Figure 119: South America Radial Artery Compression Devices Market Revenue (Million), by Country 2024 & 2032
- Figure 120: South America Radial Artery Compression Devices Market Volume (K Unit), by Country 2024 & 2032
- Figure 121: South America Radial Artery Compression Devices Market Revenue Share (%), by Country 2024 & 2032
- Figure 122: South America Radial Artery Compression Devices Market Volume Share (%), by Country 2024 & 2032
List of Tables
- Table 1: Global Radial Artery Compression Devices Market Revenue Million Forecast, by Region 2019 & 2032
- Table 2: Global Radial Artery Compression Devices Market Volume K Unit Forecast, by Region 2019 & 2032
- Table 3: Global Radial Artery Compression Devices Market Revenue Million Forecast, by Product 2019 & 2032
- Table 4: Global Radial Artery Compression Devices Market Volume K Unit Forecast, by Product 2019 & 2032
- Table 5: Global Radial Artery Compression Devices Market Revenue Million Forecast, by Usage 2019 & 2032
- Table 6: Global Radial Artery Compression Devices Market Volume K Unit Forecast, by Usage 2019 & 2032
- Table 7: Global Radial Artery Compression Devices Market Revenue Million Forecast, by Application 2019 & 2032
- Table 8: Global Radial Artery Compression Devices Market Volume K Unit Forecast, by Application 2019 & 2032
- Table 9: Global Radial Artery Compression Devices Market Revenue Million Forecast, by End User 2019 & 2032
- Table 10: Global Radial Artery Compression Devices Market Volume K Unit Forecast, by End User 2019 & 2032
- Table 11: Global Radial Artery Compression Devices Market Revenue Million Forecast, by Region 2019 & 2032
- Table 12: Global Radial Artery Compression Devices Market Volume K Unit Forecast, by Region 2019 & 2032
- Table 13: Global Radial Artery Compression Devices Market Revenue Million Forecast, by Country 2019 & 2032
- Table 14: Global Radial Artery Compression Devices Market Volume K Unit Forecast, by Country 2019 & 2032
- Table 15: United States Radial Artery Compression Devices Market Revenue (Million) Forecast, by Application 2019 & 2032
- Table 16: United States Radial Artery Compression Devices Market Volume (K Unit) Forecast, by Application 2019 & 2032
- Table 17: Canada Radial Artery Compression Devices Market Revenue (Million) Forecast, by Application 2019 & 2032
- Table 18: Canada Radial Artery Compression Devices Market Volume (K Unit) Forecast, by Application 2019 & 2032
- Table 19: Mexico Radial Artery Compression Devices Market Revenue (Million) Forecast, by Application 2019 & 2032
- Table 20: Mexico Radial Artery Compression Devices Market Volume (K Unit) Forecast, by Application 2019 & 2032
- Table 21: Global Radial Artery Compression Devices Market Revenue Million Forecast, by Country 2019 & 2032
- Table 22: Global Radial Artery Compression Devices Market Volume K Unit Forecast, by Country 2019 & 2032
- Table 23: Germany Radial Artery Compression Devices Market Revenue (Million) Forecast, by Application 2019 & 2032
- Table 24: Germany Radial Artery Compression Devices Market Volume (K Unit) Forecast, by Application 2019 & 2032
- Table 25: United Kingdom Radial Artery Compression Devices Market Revenue (Million) Forecast, by Application 2019 & 2032
- Table 26: United Kingdom Radial Artery Compression Devices Market Volume (K Unit) Forecast, by Application 2019 & 2032
- Table 27: France Radial Artery Compression Devices Market Revenue (Million) Forecast, by Application 2019 & 2032
- Table 28: France Radial Artery Compression Devices Market Volume (K Unit) Forecast, by Application 2019 & 2032
- Table 29: Italy Radial Artery Compression Devices Market Revenue (Million) Forecast, by Application 2019 & 2032
- Table 30: Italy Radial Artery Compression Devices Market Volume (K Unit) Forecast, by Application 2019 & 2032
- Table 31: Spain Radial Artery Compression Devices Market Revenue (Million) Forecast, by Application 2019 & 2032
- Table 32: Spain Radial Artery Compression Devices Market Volume (K Unit) Forecast, by Application 2019 & 2032
- Table 33: Rest of Europe Radial Artery Compression Devices Market Revenue (Million) Forecast, by Application 2019 & 2032
- Table 34: Rest of Europe Radial Artery Compression Devices Market Volume (K Unit) Forecast, by Application 2019 & 2032
- Table 35: Global Radial Artery Compression Devices Market Revenue Million Forecast, by Country 2019 & 2032
- Table 36: Global Radial Artery Compression Devices Market Volume K Unit Forecast, by Country 2019 & 2032
- Table 37: China Radial Artery Compression Devices Market Revenue (Million) Forecast, by Application 2019 & 2032
- Table 38: China Radial Artery Compression Devices Market Volume (K Unit) Forecast, by Application 2019 & 2032
- Table 39: Japan Radial Artery Compression Devices Market Revenue (Million) Forecast, by Application 2019 & 2032
- Table 40: Japan Radial Artery Compression Devices Market Volume (K Unit) Forecast, by Application 2019 & 2032
- Table 41: India Radial Artery Compression Devices Market Revenue (Million) Forecast, by Application 2019 & 2032
- Table 42: India Radial Artery Compression Devices Market Volume (K Unit) Forecast, by Application 2019 & 2032
- Table 43: Australia Radial Artery Compression Devices Market Revenue (Million) Forecast, by Application 2019 & 2032
- Table 44: Australia Radial Artery Compression Devices Market Volume (K Unit) Forecast, by Application 2019 & 2032
- Table 45: South Korea Radial Artery Compression Devices Market Revenue (Million) Forecast, by Application 2019 & 2032
- Table 46: South Korea Radial Artery Compression Devices Market Volume (K Unit) Forecast, by Application 2019 & 2032
- Table 47: Rest of Asia Pacific Radial Artery Compression Devices Market Revenue (Million) Forecast, by Application 2019 & 2032
- Table 48: Rest of Asia Pacific Radial Artery Compression Devices Market Volume (K Unit) Forecast, by Application 2019 & 2032
- Table 49: Global Radial Artery Compression Devices Market Revenue Million Forecast, by Country 2019 & 2032
- Table 50: Global Radial Artery Compression Devices Market Volume K Unit Forecast, by Country 2019 & 2032
- Table 51: GCC Radial Artery Compression Devices Market Revenue (Million) Forecast, by Application 2019 & 2032
- Table 52: GCC Radial Artery Compression Devices Market Volume (K Unit) Forecast, by Application 2019 & 2032
- Table 53: South Africa Radial Artery Compression Devices Market Revenue (Million) Forecast, by Application 2019 & 2032
- Table 54: South Africa Radial Artery Compression Devices Market Volume (K Unit) Forecast, by Application 2019 & 2032
- Table 55: Rest of Middle East and Africa Radial Artery Compression Devices Market Revenue (Million) Forecast, by Application 2019 & 2032
- Table 56: Rest of Middle East and Africa Radial Artery Compression Devices Market Volume (K Unit) Forecast, by Application 2019 & 2032
- Table 57: Global Radial Artery Compression Devices Market Revenue Million Forecast, by Country 2019 & 2032
- Table 58: Global Radial Artery Compression Devices Market Volume K Unit Forecast, by Country 2019 & 2032
- Table 59: Brazil Radial Artery Compression Devices Market Revenue (Million) Forecast, by Application 2019 & 2032
- Table 60: Brazil Radial Artery Compression Devices Market Volume (K Unit) Forecast, by Application 2019 & 2032
- Table 61: Argentina Radial Artery Compression Devices Market Revenue (Million) Forecast, by Application 2019 & 2032
- Table 62: Argentina Radial Artery Compression Devices Market Volume (K Unit) Forecast, by Application 2019 & 2032
- Table 63: Rest of South America Radial Artery Compression Devices Market Revenue (Million) Forecast, by Application 2019 & 2032
- Table 64: Rest of South America Radial Artery Compression Devices Market Volume (K Unit) Forecast, by Application 2019 & 2032
- Table 65: Global Radial Artery Compression Devices Market Revenue Million Forecast, by Product 2019 & 2032
- Table 66: Global Radial Artery Compression Devices Market Volume K Unit Forecast, by Product 2019 & 2032
- Table 67: Global Radial Artery Compression Devices Market Revenue Million Forecast, by Usage 2019 & 2032
- Table 68: Global Radial Artery Compression Devices Market Volume K Unit Forecast, by Usage 2019 & 2032
- Table 69: Global Radial Artery Compression Devices Market Revenue Million Forecast, by Application 2019 & 2032
- Table 70: Global Radial Artery Compression Devices Market Volume K Unit Forecast, by Application 2019 & 2032
- Table 71: Global Radial Artery Compression Devices Market Revenue Million Forecast, by End User 2019 & 2032
- Table 72: Global Radial Artery Compression Devices Market Volume K Unit Forecast, by End User 2019 & 2032
- Table 73: Global Radial Artery Compression Devices Market Revenue Million Forecast, by Country 2019 & 2032
- Table 74: Global Radial Artery Compression Devices Market Volume K Unit Forecast, by Country 2019 & 2032
- Table 75: United States Radial Artery Compression Devices Market Revenue (Million) Forecast, by Application 2019 & 2032
- Table 76: United States Radial Artery Compression Devices Market Volume (K Unit) Forecast, by Application 2019 & 2032
- Table 77: Canada Radial Artery Compression Devices Market Revenue (Million) Forecast, by Application 2019 & 2032
- Table 78: Canada Radial Artery Compression Devices Market Volume (K Unit) Forecast, by Application 2019 & 2032
- Table 79: Mexico Radial Artery Compression Devices Market Revenue (Million) Forecast, by Application 2019 & 2032
- Table 80: Mexico Radial Artery Compression Devices Market Volume (K Unit) Forecast, by Application 2019 & 2032
- Table 81: Global Radial Artery Compression Devices Market Revenue Million Forecast, by Product 2019 & 2032
- Table 82: Global Radial Artery Compression Devices Market Volume K Unit Forecast, by Product 2019 & 2032
- Table 83: Global Radial Artery Compression Devices Market Revenue Million Forecast, by Usage 2019 & 2032
- Table 84: Global Radial Artery Compression Devices Market Volume K Unit Forecast, by Usage 2019 & 2032
- Table 85: Global Radial Artery Compression Devices Market Revenue Million Forecast, by Application 2019 & 2032
- Table 86: Global Radial Artery Compression Devices Market Volume K Unit Forecast, by Application 2019 & 2032
- Table 87: Global Radial Artery Compression Devices Market Revenue Million Forecast, by End User 2019 & 2032
- Table 88: Global Radial Artery Compression Devices Market Volume K Unit Forecast, by End User 2019 & 2032
- Table 89: Global Radial Artery Compression Devices Market Revenue Million Forecast, by Country 2019 & 2032
- Table 90: Global Radial Artery Compression Devices Market Volume K Unit Forecast, by Country 2019 & 2032
- Table 91: Germany Radial Artery Compression Devices Market Revenue (Million) Forecast, by Application 2019 & 2032
- Table 92: Germany Radial Artery Compression Devices Market Volume (K Unit) Forecast, by Application 2019 & 2032
- Table 93: United Kingdom Radial Artery Compression Devices Market Revenue (Million) Forecast, by Application 2019 & 2032
- Table 94: United Kingdom Radial Artery Compression Devices Market Volume (K Unit) Forecast, by Application 2019 & 2032
- Table 95: France Radial Artery Compression Devices Market Revenue (Million) Forecast, by Application 2019 & 2032
- Table 96: France Radial Artery Compression Devices Market Volume (K Unit) Forecast, by Application 2019 & 2032
- Table 97: Italy Radial Artery Compression Devices Market Revenue (Million) Forecast, by Application 2019 & 2032
- Table 98: Italy Radial Artery Compression Devices Market Volume (K Unit) Forecast, by Application 2019 & 2032
- Table 99: Spain Radial Artery Compression Devices Market Revenue (Million) Forecast, by Application 2019 & 2032
- Table 100: Spain Radial Artery Compression Devices Market Volume (K Unit) Forecast, by Application 2019 & 2032
- Table 101: Rest of Europe Radial Artery Compression Devices Market Revenue (Million) Forecast, by Application 2019 & 2032
- Table 102: Rest of Europe Radial Artery Compression Devices Market Volume (K Unit) Forecast, by Application 2019 & 2032
- Table 103: Global Radial Artery Compression Devices Market Revenue Million Forecast, by Product 2019 & 2032
- Table 104: Global Radial Artery Compression Devices Market Volume K Unit Forecast, by Product 2019 & 2032
- Table 105: Global Radial Artery Compression Devices Market Revenue Million Forecast, by Usage 2019 & 2032
- Table 106: Global Radial Artery Compression Devices Market Volume K Unit Forecast, by Usage 2019 & 2032
- Table 107: Global Radial Artery Compression Devices Market Revenue Million Forecast, by Application 2019 & 2032
- Table 108: Global Radial Artery Compression Devices Market Volume K Unit Forecast, by Application 2019 & 2032
- Table 109: Global Radial Artery Compression Devices Market Revenue Million Forecast, by End User 2019 & 2032
- Table 110: Global Radial Artery Compression Devices Market Volume K Unit Forecast, by End User 2019 & 2032
- Table 111: Global Radial Artery Compression Devices Market Revenue Million Forecast, by Country 2019 & 2032
- Table 112: Global Radial Artery Compression Devices Market Volume K Unit Forecast, by Country 2019 & 2032
- Table 113: China Radial Artery Compression Devices Market Revenue (Million) Forecast, by Application 2019 & 2032
- Table 114: China Radial Artery Compression Devices Market Volume (K Unit) Forecast, by Application 2019 & 2032
- Table 115: Japan Radial Artery Compression Devices Market Revenue (Million) Forecast, by Application 2019 & 2032
- Table 116: Japan Radial Artery Compression Devices Market Volume (K Unit) Forecast, by Application 2019 & 2032
- Table 117: India Radial Artery Compression Devices Market Revenue (Million) Forecast, by Application 2019 & 2032
- Table 118: India Radial Artery Compression Devices Market Volume (K Unit) Forecast, by Application 2019 & 2032
- Table 119: Australia Radial Artery Compression Devices Market Revenue (Million) Forecast, by Application 2019 & 2032
- Table 120: Australia Radial Artery Compression Devices Market Volume (K Unit) Forecast, by Application 2019 & 2032
- Table 121: South Korea Radial Artery Compression Devices Market Revenue (Million) Forecast, by Application 2019 & 2032
- Table 122: South Korea Radial Artery Compression Devices Market Volume (K Unit) Forecast, by Application 2019 & 2032
- Table 123: Rest of Asia Pacific Radial Artery Compression Devices Market Revenue (Million) Forecast, by Application 2019 & 2032
- Table 124: Rest of Asia Pacific Radial Artery Compression Devices Market Volume (K Unit) Forecast, by Application 2019 & 2032
- Table 125: Global Radial Artery Compression Devices Market Revenue Million Forecast, by Product 2019 & 2032
- Table 126: Global Radial Artery Compression Devices Market Volume K Unit Forecast, by Product 2019 & 2032
- Table 127: Global Radial Artery Compression Devices Market Revenue Million Forecast, by Usage 2019 & 2032
- Table 128: Global Radial Artery Compression Devices Market Volume K Unit Forecast, by Usage 2019 & 2032
- Table 129: Global Radial Artery Compression Devices Market Revenue Million Forecast, by Application 2019 & 2032
- Table 130: Global Radial Artery Compression Devices Market Volume K Unit Forecast, by Application 2019 & 2032
- Table 131: Global Radial Artery Compression Devices Market Revenue Million Forecast, by End User 2019 & 2032
- Table 132: Global Radial Artery Compression Devices Market Volume K Unit Forecast, by End User 2019 & 2032
- Table 133: Global Radial Artery Compression Devices Market Revenue Million Forecast, by Country 2019 & 2032
- Table 134: Global Radial Artery Compression Devices Market Volume K Unit Forecast, by Country 2019 & 2032
- Table 135: GCC Radial Artery Compression Devices Market Revenue (Million) Forecast, by Application 2019 & 2032
- Table 136: GCC Radial Artery Compression Devices Market Volume (K Unit) Forecast, by Application 2019 & 2032
- Table 137: South Africa Radial Artery Compression Devices Market Revenue (Million) Forecast, by Application 2019 & 2032
- Table 138: South Africa Radial Artery Compression Devices Market Volume (K Unit) Forecast, by Application 2019 & 2032
- Table 139: Rest of Middle East and Africa Radial Artery Compression Devices Market Revenue (Million) Forecast, by Application 2019 & 2032
- Table 140: Rest of Middle East and Africa Radial Artery Compression Devices Market Volume (K Unit) Forecast, by Application 2019 & 2032
- Table 141: Global Radial Artery Compression Devices Market Revenue Million Forecast, by Product 2019 & 2032
- Table 142: Global Radial Artery Compression Devices Market Volume K Unit Forecast, by Product 2019 & 2032
- Table 143: Global Radial Artery Compression Devices Market Revenue Million Forecast, by Usage 2019 & 2032
- Table 144: Global Radial Artery Compression Devices Market Volume K Unit Forecast, by Usage 2019 & 2032
- Table 145: Global Radial Artery Compression Devices Market Revenue Million Forecast, by Application 2019 & 2032
- Table 146: Global Radial Artery Compression Devices Market Volume K Unit Forecast, by Application 2019 & 2032
- Table 147: Global Radial Artery Compression Devices Market Revenue Million Forecast, by End User 2019 & 2032
- Table 148: Global Radial Artery Compression Devices Market Volume K Unit Forecast, by End User 2019 & 2032
- Table 149: Global Radial Artery Compression Devices Market Revenue Million Forecast, by Country 2019 & 2032
- Table 150: Global Radial Artery Compression Devices Market Volume K Unit Forecast, by Country 2019 & 2032
- Table 151: Brazil Radial Artery Compression Devices Market Revenue (Million) Forecast, by Application 2019 & 2032
- Table 152: Brazil Radial Artery Compression Devices Market Volume (K Unit) Forecast, by Application 2019 & 2032
- Table 153: Argentina Radial Artery Compression Devices Market Revenue (Million) Forecast, by Application 2019 & 2032
- Table 154: Argentina Radial Artery Compression Devices Market Volume (K Unit) Forecast, by Application 2019 & 2032
- Table 155: Rest of South America Radial Artery Compression Devices Market Revenue (Million) Forecast, by Application 2019 & 2032
- Table 156: Rest of South America Radial Artery Compression Devices Market Volume (K Unit) Forecast, by Application 2019 & 2032
Frequently Asked Questions
1. What is the projected Compound Annual Growth Rate (CAGR) of the Radial Artery Compression Devices Market?
The projected CAGR is approximately 7.20%.
2. Which companies are prominent players in the Radial Artery Compression Devices Market?
Key companies in the market include TZ Medical Inc, Lepu Medical Technology (Beijing) Co Ltd, Merit Medical Systems, Beijing Demax Medical Technology, VYGON, Forge Medical, Terumo Corporation, Abbott, Semler Technologies Inc, Teleflex Incorporated, Advin Health Care.
3. What are the main segments of the Radial Artery Compression Devices Market?
The market segments include Product, Usage, Application, End User.
4. Can you provide details about the market size?
The market size is estimated to be USD 214.30 Million as of 2022.
5. What are some drivers contributing to market growth?
Increasing Prevelance of Cardiovascular Diseases; Growing Preference for Radial Artery Access.
6. What are the notable trends driving market growth?
Surgical Intervention Application is Expected to Have Significant Growth.
7. Are there any restraints impacting market growth?
Variability in Reimbursement Policies; Potential Complications at the Access Site.
8. Can you provide examples of recent developments in the market?
June 2023: TZ Medical introduced Roc Band, a new radial hemostasis band designed to preserve patency. The device provides improved hemostasis and optimized patient recovery times.
9. What pricing options are available for accessing the report?
Pricing options include single-user, multi-user, and enterprise licenses priced at USD 4750, USD 5250, and USD 8750 respectively.
10. Is the market size provided in terms of value or volume?
The market size is provided in terms of value, measured in Million and volume, measured in K Unit.
11. Are there any specific market keywords associated with the report?
Yes, the market keyword associated with the report is "Radial Artery Compression Devices Market," which aids in identifying and referencing the specific market segment covered.
12. How do I determine which pricing option suits my needs best?
The pricing options vary based on user requirements and access needs. Individual users may opt for single-user licenses, while businesses requiring broader access may choose multi-user or enterprise licenses for cost-effective access to the report.
13. Are there any additional resources or data provided in the Radial Artery Compression Devices Market report?
While the report offers comprehensive insights, it's advisable to review the specific contents or supplementary materials provided to ascertain if additional resources or data are available.
14. How can I stay updated on further developments or reports in the Radial Artery Compression Devices Market?
To stay informed about further developments, trends, and reports in the Radial Artery Compression Devices Market, consider subscribing to industry newsletters, following relevant companies and organizations, or regularly checking reputable industry news sources and publications.
Methodology
Step 1 - Identification of Relevant Samples Size from Population Database


Step 2 - Approaches for Defining Global Market Size (Value, Volume* & Price*)

Note*: In applicable scenarios
Step 3 - Data Sources
Primary Research
- Web Analytics
- Survey Reports
- Research Institute
- Latest Research Reports
- Opinion Leaders
Secondary Research
- Annual Reports
- White Paper
- Latest Press Release
- Industry Association
- Paid Database
- Investor Presentations

Step 4 - Data Triangulation
Involves using different sources of information in order to increase the validity of a study
These sources are likely to be stakeholders in a program - participants, other researchers, program staff, other community members, and so on.
Then we put all data in single framework & apply various statistical tools to find out the dynamic on the market.
During the analysis stage, feedback from the stakeholder groups would be compared to determine areas of agreement as well as areas of divergence


