
Key Insights
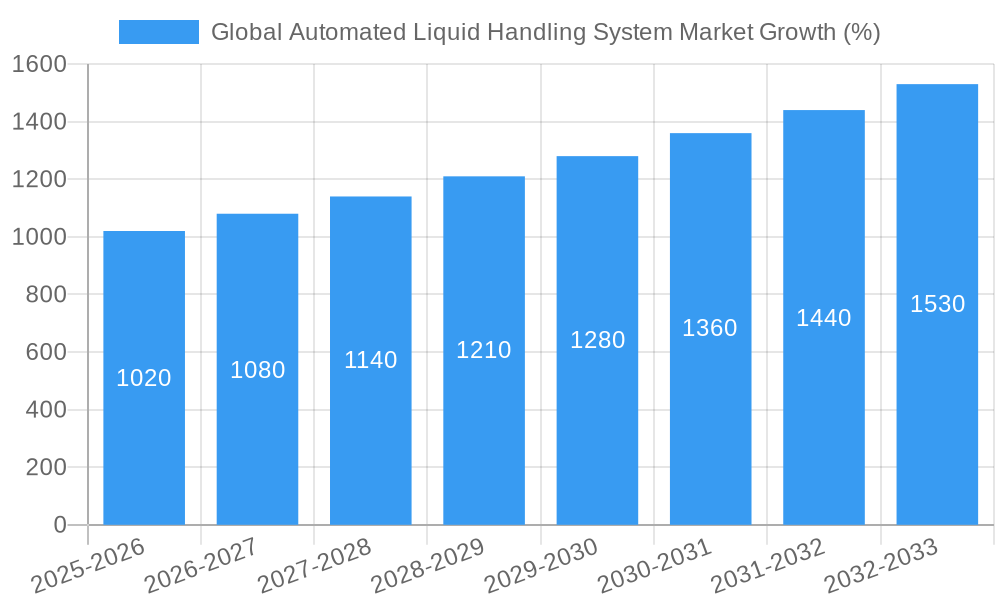
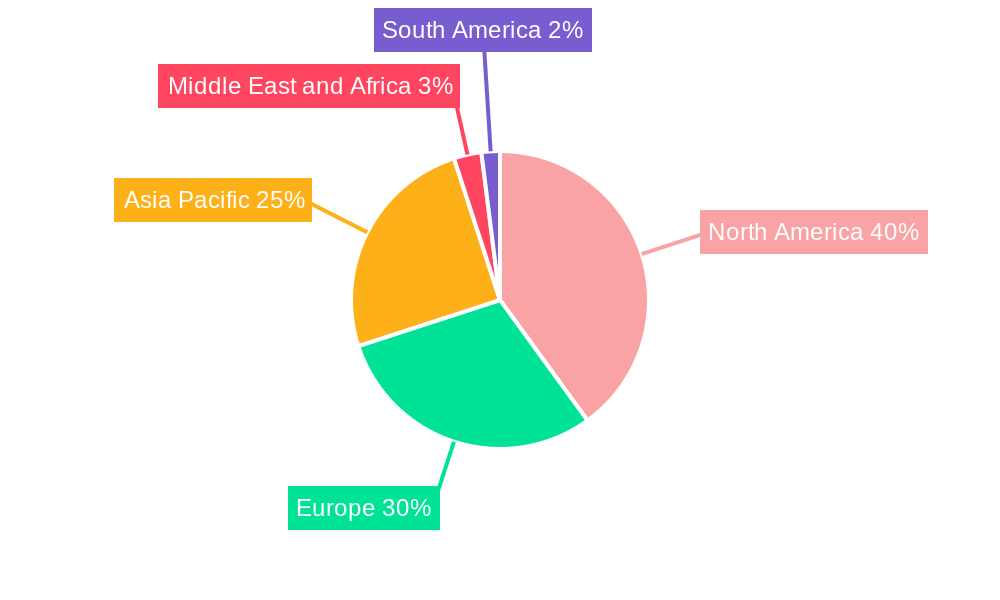
The global automated liquid handling system market is experiencing robust growth, driven by increasing automation in pharmaceutical and biotechnology research, rising demand for high-throughput screening, and a growing need for improved accuracy and precision in laboratory processes. The market's compound annual growth rate (CAGR) of 6.80% from 2019 to 2024 indicates a significant expansion, projected to continue into the forecast period (2025-2033). Key segments fueling this growth include automated liquid handling systems, particularly liquid handling workstations and pipettors, within the pharmaceutical and biotechnology end-user sector. The North American market currently holds a significant share, reflecting strong investment in research and development within the region. However, the Asia-Pacific region is anticipated to witness faster growth due to rising healthcare expenditure and expanding pharmaceutical manufacturing capabilities in countries like China and India. This growth is further supported by technological advancements leading to the development of more sophisticated and integrated systems, capable of handling diverse applications and increasing throughput. The increasing adoption of automation in contract research organizations (CROs) also plays a crucial role in the market's expansion.
Competitive pressures among major players such as Becton Dickinson, Mettler-Toledo, Tecan, and Thermo Fisher Scientific are driving innovation and price competitiveness. The market is also witnessing the emergence of smaller, specialized companies offering niche solutions and innovative technologies. Despite these positive trends, regulatory hurdles and the high initial investment cost associated with automated liquid handling systems pose some challenges. However, the long-term benefits of increased efficiency, reduced error rates, and improved data quality are expected to outweigh these challenges, ensuring continued market expansion. The market's segmentation by product type (workstations, pipettors, dispensers, washers, consumables) allows for targeted market penetration by various players focusing on specific needs within the life sciences and research sectors. Furthermore, the continued emphasis on personalized medicine and drug discovery is expected to further fuel demand for advanced liquid handling solutions.
Global Automated Liquid Handling System Market Report: 2019-2033
This comprehensive report provides an in-depth analysis of the global automated liquid handling system market, encompassing market dynamics, growth trends, regional dominance, product landscape, key players, and future outlook. The study period covers 2019-2033, with 2025 as the base year and a forecast period of 2025-2033. The market is segmented by type (Automated Liquid Handling System, Semi-automated Liquid Handling System), product (Liquid Handling Workstation, Pipettors, Microplate Reagent Dispensers, Microplate Washers, Consumables, Other Products), and end-user (Contract Research Organizations, Pharmaceutical and Biotechnology, Academic and Research Institutes). The total market size is projected to reach xx Million by 2033.
Global Automated Liquid Handling System Market Dynamics & Structure
The global automated liquid handling system market exhibits a moderately concentrated structure, with key players holding significant market share. Technological innovation, driven by increasing demand for high-throughput screening and automation in life sciences research, is a major growth driver. Stringent regulatory frameworks governing medical devices and laboratory equipment impact market dynamics. Competitive pressures from substitute technologies and price competition among vendors are also evident. The end-user demographic is primarily comprised of research-intensive organizations in pharmaceuticals, biotechnology, and contract research. M&A activity has been moderate, with a xx number of deals recorded over the past five years, primarily focused on consolidating market share and acquiring specialized technologies.
- Market Concentration: Moderately concentrated, with top 5 players holding approximately xx% market share in 2024.
- Technological Innovation: Miniaturization, integration of AI/ML, and increased throughput are key drivers.
- Regulatory Frameworks: Compliance with FDA, CE, and other regional regulations is crucial.
- Competitive Landscape: Intense competition based on price, performance, and features.
- M&A Activity: Approximately xx M&A deals in the past 5 years, focusing on technology acquisition and market expansion.
- Innovation Barriers: High R&D costs, stringent regulatory approvals, and intellectual property protection.
Global Automated Liquid Handling System Market Growth Trends & Insights
The global automated liquid handling system market has witnessed robust growth over the historical period (2019-2024), expanding at a CAGR of xx%. This growth is fueled by factors such as increasing demand for high-throughput screening in drug discovery, rising adoption of automation in laboratories, and growing investments in life sciences research. Technological disruptions, including the integration of artificial intelligence and machine learning for improved precision and efficiency, are transforming the market. A shift towards personalized medicine further bolsters demand for sophisticated liquid handling systems capable of handling smaller sample volumes. The market penetration rate for automated systems is steadily increasing, particularly in developed regions. The forecast period (2025-2033) anticipates a CAGR of xx%, driven by continued technological advancements and expansion into emerging markets.
Dominant Regions, Countries, or Segments in Global Automated Liquid Handling System Market
North America currently dominates the global automated liquid handling system market, driven by a high concentration of pharmaceutical and biotechnology companies, robust research funding, and early adoption of advanced technologies. Within North America, the United States holds the largest market share. Europe follows as a significant market, fueled by similar factors. The Asia-Pacific region is experiencing rapid growth, driven by increasing investments in life sciences research and a growing healthcare infrastructure. Within product segments, Liquid Handling Workstations and Pipettors currently hold the largest market share. The Pharmaceutical and Biotechnology end-user segment is the largest, followed by Contract Research Organizations.
- Key Drivers:
- North America: Strong research funding, presence of major pharmaceutical companies.
- Europe: Robust life sciences ecosystem, growing adoption of automation.
- Asia-Pacific: Rising healthcare expenditure, increasing R&D investment.
- Dominant Segments:
- By Type: Automated Liquid Handling Systems
- By Product: Liquid Handling Workstations and Pipettors.
- By End User: Pharmaceutical and Biotechnology companies.
Global Automated Liquid Handling System Market Product Landscape
The automated liquid handling system market offers a diverse range of products, from basic pipettors to sophisticated liquid handling workstations capable of high-throughput screening and complex assay automation. Recent innovations include the integration of robotics, advanced software, and AI/ML for improved precision, accuracy, and efficiency. Many systems now offer enhanced traceability and data management capabilities to meet stringent regulatory requirements. Unique selling propositions often center around speed, precision, ease of use, and scalability.
Key Drivers, Barriers & Challenges in Global Automated Liquid Handling System Market
Key Drivers: Increasing demand for high-throughput screening, growing adoption of automation in life sciences research, advancements in robotics and AI, rising investments in pharmaceutical and biotechnology research.
Challenges & Restraints: High initial investment costs, complex integration with existing laboratory infrastructure, stringent regulatory requirements, skilled labor shortages, and intense competition. Supply chain disruptions can lead to delays and increased costs, impacting market growth. The impact of these challenges is estimated to reduce market growth by approximately xx% annually.
Emerging Opportunities in Global Automated Liquid Handling System Market
Emerging opportunities include the expansion into point-of-care diagnostics, growth in personalized medicine requiring precise liquid handling, development of miniaturized systems for resource-constrained settings, and integration of advanced technologies like microfluidics and lab-on-a-chip systems. Untapped markets in developing economies present significant growth potential. The growing need for automation in environmental monitoring and food safety testing also creates new avenues.
Growth Accelerators in the Global Automated Liquid Handling System Market Industry
Technological advancements such as miniaturization, AI/ML integration, and the development of innovative consumables will accelerate market growth. Strategic partnerships and collaborations between technology providers and end-users are crucial for driving innovation and market adoption. Market expansion strategies targeting emerging economies and expanding into new application areas will further stimulate growth.
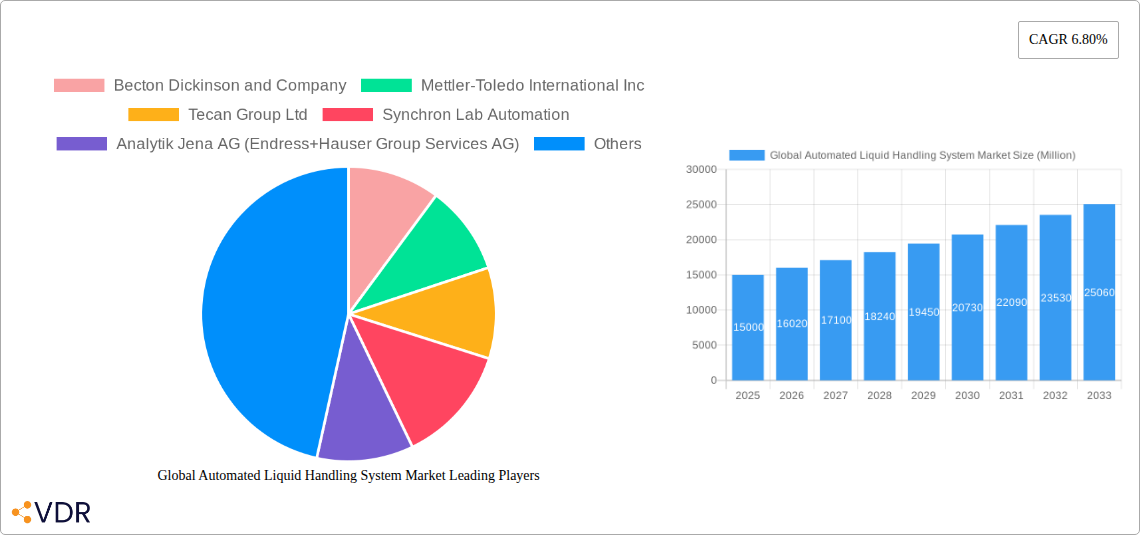
Key Players Shaping the Global Automated Liquid Handling System Market Market
- Becton Dickinson and Company
- Mettler-Toledo International Inc
- Tecan Group Ltd
- Synchron Lab Automation
- Analytik Jena AG (Endress+Hauser Group Services AG)
- Aurora Biomed Inc
- Eppendorf AG
- Formulatrix Inc
- Corning Incorporated
- Hamilton Company
- Hudson Robotics Inc
- Thermo Fisher Scientific
- Agilent Technologies
- Danaher Corporation (Beckman Coulter Inc)
- Perkin Elmer Inc
Notable Milestones in Global Automated Liquid Handling System Sector
- June 2022: Beckman Coulter Life Sciences launches the Biomek NGeniuS liquid handling system, enhancing accessibility of next-generation sequencing for research labs.
- February 2022: Festo launches a modular gantry robot platform for automated liquid handling, streamlining equipment design.
In-Depth Global Automated Liquid Handling System Market Outlook
The future of the automated liquid handling system market is bright, driven by continuous technological innovation, increasing demand for automation in various applications, and expansion into new markets. Strategic partnerships, acquisitions, and the development of innovative products and services will shape the competitive landscape. The market is poised for significant growth, with substantial opportunities for companies that can adapt to evolving customer needs and technological advancements. The long-term outlook is positive, projecting sustained growth in the coming years, exceeding xx Million by 2033.
Global Automated Liquid Handling System Market Segmentation
-
1. Type
- 1.1. Automated Liquid Handling System
- 1.2. Semi-automated Liquid Handling System
-
2. Product
- 2.1. Liquid Handling Workstation
- 2.2. Pipettors
- 2.3. Microplate Reagent Dispensers
- 2.4. Microplate Washers
- 2.5. Consumables
- 2.6. Other Products
-
3. End User
- 3.1. Contract Research Organizations
- 3.2. Pharmaceutical and Biotechnology
- 3.3. Academic and Research Institutes
Global Automated Liquid Handling System Market Segmentation By Geography
-
1. North America
- 1.1. United States
- 1.2. Canada
- 1.3. Mexico
-
2. Europe
- 2.1. Germany
- 2.2. United Kingdom
- 2.3. France
- 2.4. Italy
- 2.5. Spain
- 2.6. Rest of Europe
-
3. Asia Pacific
- 3.1. China
- 3.2. Japan
- 3.3. India
- 3.4. Australia
- 3.5. South Korea
- 3.6. Rest of Asia Pacific
-
4. Middle East and Africa
- 4.1. GCC
- 4.2. South Africa
- 4.3. Rest of Middle East and Africa
-
5. South America
- 5.1. Brazil
- 5.2. Argentina
- 5.3. Rest of South America
Global Automated Liquid Handling System Market REPORT HIGHLIGHTS
| Aspects | Details |
|---|---|
| Study Period | 2019-2033 |
| Base Year | 2024 |
| Estimated Year | 2025 |
| Forecast Period | 2025-2033 |
| Historical Period | 2019-2024 |
| Growth Rate | CAGR of 6.80% from 2019-2033 |
| Segmentation |
|
Table of Contents
- 1. Introduction
- 1.1. Research Scope
- 1.2. Market Segmentation
- 1.3. Research Methodology
- 1.4. Definitions and Assumptions
- 2. Executive Summary
- 2.1. Introduction
- 3. Market Dynamics
- 3.1. Introduction
- 3.2. Market Drivers
- 3.2.1. Flexibility and Adaptability of Lab Automation Systems; Technological Advancements in Automated Liquid Handling Systems
- 3.3. Market Restrains
- 3.3.1. Slower Adoption Rates in Small- and Medium-sized Organizations
- 3.4. Market Trends
- 3.4.1. Liquid Handling Workstation are Expected to Witness Healthy Growth Over the Forecast Period
- 4. Market Factor Analysis
- 4.1. Porters Five Forces
- 4.2. Supply/Value Chain
- 4.3. PESTEL analysis
- 4.4. Market Entropy
- 4.5. Patent/Trademark Analysis
- 5. Global Automated Liquid Handling System Market Analysis, Insights and Forecast, 2019-2031
- 5.1. Market Analysis, Insights and Forecast - by Type
- 5.1.1. Automated Liquid Handling System
- 5.1.2. Semi-automated Liquid Handling System
- 5.2. Market Analysis, Insights and Forecast - by Product
- 5.2.1. Liquid Handling Workstation
- 5.2.2. Pipettors
- 5.2.3. Microplate Reagent Dispensers
- 5.2.4. Microplate Washers
- 5.2.5. Consumables
- 5.2.6. Other Products
- 5.3. Market Analysis, Insights and Forecast - by End User
- 5.3.1. Contract Research Organizations
- 5.3.2. Pharmaceutical and Biotechnology
- 5.3.3. Academic and Research Institutes
- 5.4. Market Analysis, Insights and Forecast - by Region
- 5.4.1. North America
- 5.4.2. Europe
- 5.4.3. Asia Pacific
- 5.4.4. Middle East and Africa
- 5.4.5. South America
- 5.1. Market Analysis, Insights and Forecast - by Type
- 6. North America Global Automated Liquid Handling System Market Analysis, Insights and Forecast, 2019-2031
- 6.1. Market Analysis, Insights and Forecast - by Type
- 6.1.1. Automated Liquid Handling System
- 6.1.2. Semi-automated Liquid Handling System
- 6.2. Market Analysis, Insights and Forecast - by Product
- 6.2.1. Liquid Handling Workstation
- 6.2.2. Pipettors
- 6.2.3. Microplate Reagent Dispensers
- 6.2.4. Microplate Washers
- 6.2.5. Consumables
- 6.2.6. Other Products
- 6.3. Market Analysis, Insights and Forecast - by End User
- 6.3.1. Contract Research Organizations
- 6.3.2. Pharmaceutical and Biotechnology
- 6.3.3. Academic and Research Institutes
- 6.1. Market Analysis, Insights and Forecast - by Type
- 7. Europe Global Automated Liquid Handling System Market Analysis, Insights and Forecast, 2019-2031
- 7.1. Market Analysis, Insights and Forecast - by Type
- 7.1.1. Automated Liquid Handling System
- 7.1.2. Semi-automated Liquid Handling System
- 7.2. Market Analysis, Insights and Forecast - by Product
- 7.2.1. Liquid Handling Workstation
- 7.2.2. Pipettors
- 7.2.3. Microplate Reagent Dispensers
- 7.2.4. Microplate Washers
- 7.2.5. Consumables
- 7.2.6. Other Products
- 7.3. Market Analysis, Insights and Forecast - by End User
- 7.3.1. Contract Research Organizations
- 7.3.2. Pharmaceutical and Biotechnology
- 7.3.3. Academic and Research Institutes
- 7.1. Market Analysis, Insights and Forecast - by Type
- 8. Asia Pacific Global Automated Liquid Handling System Market Analysis, Insights and Forecast, 2019-2031
- 8.1. Market Analysis, Insights and Forecast - by Type
- 8.1.1. Automated Liquid Handling System
- 8.1.2. Semi-automated Liquid Handling System
- 8.2. Market Analysis, Insights and Forecast - by Product
- 8.2.1. Liquid Handling Workstation
- 8.2.2. Pipettors
- 8.2.3. Microplate Reagent Dispensers
- 8.2.4. Microplate Washers
- 8.2.5. Consumables
- 8.2.6. Other Products
- 8.3. Market Analysis, Insights and Forecast - by End User
- 8.3.1. Contract Research Organizations
- 8.3.2. Pharmaceutical and Biotechnology
- 8.3.3. Academic and Research Institutes
- 8.1. Market Analysis, Insights and Forecast - by Type
- 9. Middle East and Africa Global Automated Liquid Handling System Market Analysis, Insights and Forecast, 2019-2031
- 9.1. Market Analysis, Insights and Forecast - by Type
- 9.1.1. Automated Liquid Handling System
- 9.1.2. Semi-automated Liquid Handling System
- 9.2. Market Analysis, Insights and Forecast - by Product
- 9.2.1. Liquid Handling Workstation
- 9.2.2. Pipettors
- 9.2.3. Microplate Reagent Dispensers
- 9.2.4. Microplate Washers
- 9.2.5. Consumables
- 9.2.6. Other Products
- 9.3. Market Analysis, Insights and Forecast - by End User
- 9.3.1. Contract Research Organizations
- 9.3.2. Pharmaceutical and Biotechnology
- 9.3.3. Academic and Research Institutes
- 9.1. Market Analysis, Insights and Forecast - by Type
- 10. South America Global Automated Liquid Handling System Market Analysis, Insights and Forecast, 2019-2031
- 10.1. Market Analysis, Insights and Forecast - by Type
- 10.1.1. Automated Liquid Handling System
- 10.1.2. Semi-automated Liquid Handling System
- 10.2. Market Analysis, Insights and Forecast - by Product
- 10.2.1. Liquid Handling Workstation
- 10.2.2. Pipettors
- 10.2.3. Microplate Reagent Dispensers
- 10.2.4. Microplate Washers
- 10.2.5. Consumables
- 10.2.6. Other Products
- 10.3. Market Analysis, Insights and Forecast - by End User
- 10.3.1. Contract Research Organizations
- 10.3.2. Pharmaceutical and Biotechnology
- 10.3.3. Academic and Research Institutes
- 10.1. Market Analysis, Insights and Forecast - by Type
- 11. North America Global Automated Liquid Handling System Market Analysis, Insights and Forecast, 2019-2031
- 11.1. Market Analysis, Insights and Forecast - By Country/Sub-region
- 11.1.1 United States
- 11.1.2 Canada
- 11.1.3 Mexico
- 12. Europe Global Automated Liquid Handling System Market Analysis, Insights and Forecast, 2019-2031
- 12.1. Market Analysis, Insights and Forecast - By Country/Sub-region
- 12.1.1 Germany
- 12.1.2 United Kingdom
- 12.1.3 France
- 12.1.4 Italy
- 12.1.5 Spain
- 12.1.6 Rest of Europe
- 13. Asia Pacific Global Automated Liquid Handling System Market Analysis, Insights and Forecast, 2019-2031
- 13.1. Market Analysis, Insights and Forecast - By Country/Sub-region
- 13.1.1 China
- 13.1.2 Japan
- 13.1.3 India
- 13.1.4 Australia
- 13.1.5 South Korea
- 13.1.6 Rest of Asia Pacific
- 14. Middle East and Africa Global Automated Liquid Handling System Market Analysis, Insights and Forecast, 2019-2031
- 14.1. Market Analysis, Insights and Forecast - By Country/Sub-region
- 14.1.1 GCC
- 14.1.2 South Africa
- 14.1.3 Rest of Middle East and Africa
- 15. South America Global Automated Liquid Handling System Market Analysis, Insights and Forecast, 2019-2031
- 15.1. Market Analysis, Insights and Forecast - By Country/Sub-region
- 15.1.1 Brazil
- 15.1.2 Argentina
- 15.1.3 Rest of South America
- 16. Competitive Analysis
- 16.1. Market Share Analysis 2024
- 16.2. Company Profiles
- 16.2.1 Becton Dickinson and Company
- 16.2.1.1. Overview
- 16.2.1.2. Products
- 16.2.1.3. SWOT Analysis
- 16.2.1.4. Recent Developments
- 16.2.1.5. Financials (Based on Availability)
- 16.2.2 Mettler-Toledo International Inc
- 16.2.2.1. Overview
- 16.2.2.2. Products
- 16.2.2.3. SWOT Analysis
- 16.2.2.4. Recent Developments
- 16.2.2.5. Financials (Based on Availability)
- 16.2.3 Tecan Group Ltd
- 16.2.3.1. Overview
- 16.2.3.2. Products
- 16.2.3.3. SWOT Analysis
- 16.2.3.4. Recent Developments
- 16.2.3.5. Financials (Based on Availability)
- 16.2.4 Synchron Lab Automation
- 16.2.4.1. Overview
- 16.2.4.2. Products
- 16.2.4.3. SWOT Analysis
- 16.2.4.4. Recent Developments
- 16.2.4.5. Financials (Based on Availability)
- 16.2.5 Analytik Jena AG (Endress+Hauser Group Services AG)
- 16.2.5.1. Overview
- 16.2.5.2. Products
- 16.2.5.3. SWOT Analysis
- 16.2.5.4. Recent Developments
- 16.2.5.5. Financials (Based on Availability)
- 16.2.6 Aurora Biomed Inc
- 16.2.6.1. Overview
- 16.2.6.2. Products
- 16.2.6.3. SWOT Analysis
- 16.2.6.4. Recent Developments
- 16.2.6.5. Financials (Based on Availability)
- 16.2.7 Eppendorf AG
- 16.2.7.1. Overview
- 16.2.7.2. Products
- 16.2.7.3. SWOT Analysis
- 16.2.7.4. Recent Developments
- 16.2.7.5. Financials (Based on Availability)
- 16.2.8 Formulatrix Inc
- 16.2.8.1. Overview
- 16.2.8.2. Products
- 16.2.8.3. SWOT Analysis
- 16.2.8.4. Recent Developments
- 16.2.8.5. Financials (Based on Availability)
- 16.2.9 Corning Incorporated
- 16.2.9.1. Overview
- 16.2.9.2. Products
- 16.2.9.3. SWOT Analysis
- 16.2.9.4. Recent Developments
- 16.2.9.5. Financials (Based on Availability)
- 16.2.10 Hamilton Company
- 16.2.10.1. Overview
- 16.2.10.2. Products
- 16.2.10.3. SWOT Analysis
- 16.2.10.4. Recent Developments
- 16.2.10.5. Financials (Based on Availability)
- 16.2.11 Hudson Robotics Inc
- 16.2.11.1. Overview
- 16.2.11.2. Products
- 16.2.11.3. SWOT Analysis
- 16.2.11.4. Recent Developments
- 16.2.11.5. Financials (Based on Availability)
- 16.2.12 Thermo Fisher Scientific
- 16.2.12.1. Overview
- 16.2.12.2. Products
- 16.2.12.3. SWOT Analysis
- 16.2.12.4. Recent Developments
- 16.2.12.5. Financials (Based on Availability)
- 16.2.13 Agilent Technologies
- 16.2.13.1. Overview
- 16.2.13.2. Products
- 16.2.13.3. SWOT Analysis
- 16.2.13.4. Recent Developments
- 16.2.13.5. Financials (Based on Availability)
- 16.2.14 Danaher Corporation (Beckman Coulter Inc )
- 16.2.14.1. Overview
- 16.2.14.2. Products
- 16.2.14.3. SWOT Analysis
- 16.2.14.4. Recent Developments
- 16.2.14.5. Financials (Based on Availability)
- 16.2.15 Perkin Elmer Inc
- 16.2.15.1. Overview
- 16.2.15.2. Products
- 16.2.15.3. SWOT Analysis
- 16.2.15.4. Recent Developments
- 16.2.15.5. Financials (Based on Availability)
- 16.2.1 Becton Dickinson and Company
List of Figures
- Figure 1: Global Global Automated Liquid Handling System Market Revenue Breakdown (Million, %) by Region 2024 & 2032
- Figure 2: Global Global Automated Liquid Handling System Market Volume Breakdown (K Unit, %) by Region 2024 & 2032
- Figure 3: North America Global Automated Liquid Handling System Market Revenue (Million), by Country 2024 & 2032
- Figure 4: North America Global Automated Liquid Handling System Market Volume (K Unit), by Country 2024 & 2032
- Figure 5: North America Global Automated Liquid Handling System Market Revenue Share (%), by Country 2024 & 2032
- Figure 6: North America Global Automated Liquid Handling System Market Volume Share (%), by Country 2024 & 2032
- Figure 7: Europe Global Automated Liquid Handling System Market Revenue (Million), by Country 2024 & 2032
- Figure 8: Europe Global Automated Liquid Handling System Market Volume (K Unit), by Country 2024 & 2032
- Figure 9: Europe Global Automated Liquid Handling System Market Revenue Share (%), by Country 2024 & 2032
- Figure 10: Europe Global Automated Liquid Handling System Market Volume Share (%), by Country 2024 & 2032
- Figure 11: Asia Pacific Global Automated Liquid Handling System Market Revenue (Million), by Country 2024 & 2032
- Figure 12: Asia Pacific Global Automated Liquid Handling System Market Volume (K Unit), by Country 2024 & 2032
- Figure 13: Asia Pacific Global Automated Liquid Handling System Market Revenue Share (%), by Country 2024 & 2032
- Figure 14: Asia Pacific Global Automated Liquid Handling System Market Volume Share (%), by Country 2024 & 2032
- Figure 15: Middle East and Africa Global Automated Liquid Handling System Market Revenue (Million), by Country 2024 & 2032
- Figure 16: Middle East and Africa Global Automated Liquid Handling System Market Volume (K Unit), by Country 2024 & 2032
- Figure 17: Middle East and Africa Global Automated Liquid Handling System Market Revenue Share (%), by Country 2024 & 2032
- Figure 18: Middle East and Africa Global Automated Liquid Handling System Market Volume Share (%), by Country 2024 & 2032
- Figure 19: South America Global Automated Liquid Handling System Market Revenue (Million), by Country 2024 & 2032
- Figure 20: South America Global Automated Liquid Handling System Market Volume (K Unit), by Country 2024 & 2032
- Figure 21: South America Global Automated Liquid Handling System Market Revenue Share (%), by Country 2024 & 2032
- Figure 22: South America Global Automated Liquid Handling System Market Volume Share (%), by Country 2024 & 2032
- Figure 23: North America Global Automated Liquid Handling System Market Revenue (Million), by Type 2024 & 2032
- Figure 24: North America Global Automated Liquid Handling System Market Volume (K Unit), by Type 2024 & 2032
- Figure 25: North America Global Automated Liquid Handling System Market Revenue Share (%), by Type 2024 & 2032
- Figure 26: North America Global Automated Liquid Handling System Market Volume Share (%), by Type 2024 & 2032
- Figure 27: North America Global Automated Liquid Handling System Market Revenue (Million), by Product 2024 & 2032
- Figure 28: North America Global Automated Liquid Handling System Market Volume (K Unit), by Product 2024 & 2032
- Figure 29: North America Global Automated Liquid Handling System Market Revenue Share (%), by Product 2024 & 2032
- Figure 30: North America Global Automated Liquid Handling System Market Volume Share (%), by Product 2024 & 2032
- Figure 31: North America Global Automated Liquid Handling System Market Revenue (Million), by End User 2024 & 2032
- Figure 32: North America Global Automated Liquid Handling System Market Volume (K Unit), by End User 2024 & 2032
- Figure 33: North America Global Automated Liquid Handling System Market Revenue Share (%), by End User 2024 & 2032
- Figure 34: North America Global Automated Liquid Handling System Market Volume Share (%), by End User 2024 & 2032
- Figure 35: North America Global Automated Liquid Handling System Market Revenue (Million), by Country 2024 & 2032
- Figure 36: North America Global Automated Liquid Handling System Market Volume (K Unit), by Country 2024 & 2032
- Figure 37: North America Global Automated Liquid Handling System Market Revenue Share (%), by Country 2024 & 2032
- Figure 38: North America Global Automated Liquid Handling System Market Volume Share (%), by Country 2024 & 2032
- Figure 39: Europe Global Automated Liquid Handling System Market Revenue (Million), by Type 2024 & 2032
- Figure 40: Europe Global Automated Liquid Handling System Market Volume (K Unit), by Type 2024 & 2032
- Figure 41: Europe Global Automated Liquid Handling System Market Revenue Share (%), by Type 2024 & 2032
- Figure 42: Europe Global Automated Liquid Handling System Market Volume Share (%), by Type 2024 & 2032
- Figure 43: Europe Global Automated Liquid Handling System Market Revenue (Million), by Product 2024 & 2032
- Figure 44: Europe Global Automated Liquid Handling System Market Volume (K Unit), by Product 2024 & 2032
- Figure 45: Europe Global Automated Liquid Handling System Market Revenue Share (%), by Product 2024 & 2032
- Figure 46: Europe Global Automated Liquid Handling System Market Volume Share (%), by Product 2024 & 2032
- Figure 47: Europe Global Automated Liquid Handling System Market Revenue (Million), by End User 2024 & 2032
- Figure 48: Europe Global Automated Liquid Handling System Market Volume (K Unit), by End User 2024 & 2032
- Figure 49: Europe Global Automated Liquid Handling System Market Revenue Share (%), by End User 2024 & 2032
- Figure 50: Europe Global Automated Liquid Handling System Market Volume Share (%), by End User 2024 & 2032
- Figure 51: Europe Global Automated Liquid Handling System Market Revenue (Million), by Country 2024 & 2032
- Figure 52: Europe Global Automated Liquid Handling System Market Volume (K Unit), by Country 2024 & 2032
- Figure 53: Europe Global Automated Liquid Handling System Market Revenue Share (%), by Country 2024 & 2032
- Figure 54: Europe Global Automated Liquid Handling System Market Volume Share (%), by Country 2024 & 2032
- Figure 55: Asia Pacific Global Automated Liquid Handling System Market Revenue (Million), by Type 2024 & 2032
- Figure 56: Asia Pacific Global Automated Liquid Handling System Market Volume (K Unit), by Type 2024 & 2032
- Figure 57: Asia Pacific Global Automated Liquid Handling System Market Revenue Share (%), by Type 2024 & 2032
- Figure 58: Asia Pacific Global Automated Liquid Handling System Market Volume Share (%), by Type 2024 & 2032
- Figure 59: Asia Pacific Global Automated Liquid Handling System Market Revenue (Million), by Product 2024 & 2032
- Figure 60: Asia Pacific Global Automated Liquid Handling System Market Volume (K Unit), by Product 2024 & 2032
- Figure 61: Asia Pacific Global Automated Liquid Handling System Market Revenue Share (%), by Product 2024 & 2032
- Figure 62: Asia Pacific Global Automated Liquid Handling System Market Volume Share (%), by Product 2024 & 2032
- Figure 63: Asia Pacific Global Automated Liquid Handling System Market Revenue (Million), by End User 2024 & 2032
- Figure 64: Asia Pacific Global Automated Liquid Handling System Market Volume (K Unit), by End User 2024 & 2032
- Figure 65: Asia Pacific Global Automated Liquid Handling System Market Revenue Share (%), by End User 2024 & 2032
- Figure 66: Asia Pacific Global Automated Liquid Handling System Market Volume Share (%), by End User 2024 & 2032
- Figure 67: Asia Pacific Global Automated Liquid Handling System Market Revenue (Million), by Country 2024 & 2032
- Figure 68: Asia Pacific Global Automated Liquid Handling System Market Volume (K Unit), by Country 2024 & 2032
- Figure 69: Asia Pacific Global Automated Liquid Handling System Market Revenue Share (%), by Country 2024 & 2032
- Figure 70: Asia Pacific Global Automated Liquid Handling System Market Volume Share (%), by Country 2024 & 2032
- Figure 71: Middle East and Africa Global Automated Liquid Handling System Market Revenue (Million), by Type 2024 & 2032
- Figure 72: Middle East and Africa Global Automated Liquid Handling System Market Volume (K Unit), by Type 2024 & 2032
- Figure 73: Middle East and Africa Global Automated Liquid Handling System Market Revenue Share (%), by Type 2024 & 2032
- Figure 74: Middle East and Africa Global Automated Liquid Handling System Market Volume Share (%), by Type 2024 & 2032
- Figure 75: Middle East and Africa Global Automated Liquid Handling System Market Revenue (Million), by Product 2024 & 2032
- Figure 76: Middle East and Africa Global Automated Liquid Handling System Market Volume (K Unit), by Product 2024 & 2032
- Figure 77: Middle East and Africa Global Automated Liquid Handling System Market Revenue Share (%), by Product 2024 & 2032
- Figure 78: Middle East and Africa Global Automated Liquid Handling System Market Volume Share (%), by Product 2024 & 2032
- Figure 79: Middle East and Africa Global Automated Liquid Handling System Market Revenue (Million), by End User 2024 & 2032
- Figure 80: Middle East and Africa Global Automated Liquid Handling System Market Volume (K Unit), by End User 2024 & 2032
- Figure 81: Middle East and Africa Global Automated Liquid Handling System Market Revenue Share (%), by End User 2024 & 2032
- Figure 82: Middle East and Africa Global Automated Liquid Handling System Market Volume Share (%), by End User 2024 & 2032
- Figure 83: Middle East and Africa Global Automated Liquid Handling System Market Revenue (Million), by Country 2024 & 2032
- Figure 84: Middle East and Africa Global Automated Liquid Handling System Market Volume (K Unit), by Country 2024 & 2032
- Figure 85: Middle East and Africa Global Automated Liquid Handling System Market Revenue Share (%), by Country 2024 & 2032
- Figure 86: Middle East and Africa Global Automated Liquid Handling System Market Volume Share (%), by Country 2024 & 2032
- Figure 87: South America Global Automated Liquid Handling System Market Revenue (Million), by Type 2024 & 2032
- Figure 88: South America Global Automated Liquid Handling System Market Volume (K Unit), by Type 2024 & 2032
- Figure 89: South America Global Automated Liquid Handling System Market Revenue Share (%), by Type 2024 & 2032
- Figure 90: South America Global Automated Liquid Handling System Market Volume Share (%), by Type 2024 & 2032
- Figure 91: South America Global Automated Liquid Handling System Market Revenue (Million), by Product 2024 & 2032
- Figure 92: South America Global Automated Liquid Handling System Market Volume (K Unit), by Product 2024 & 2032
- Figure 93: South America Global Automated Liquid Handling System Market Revenue Share (%), by Product 2024 & 2032
- Figure 94: South America Global Automated Liquid Handling System Market Volume Share (%), by Product 2024 & 2032
- Figure 95: South America Global Automated Liquid Handling System Market Revenue (Million), by End User 2024 & 2032
- Figure 96: South America Global Automated Liquid Handling System Market Volume (K Unit), by End User 2024 & 2032
- Figure 97: South America Global Automated Liquid Handling System Market Revenue Share (%), by End User 2024 & 2032
- Figure 98: South America Global Automated Liquid Handling System Market Volume Share (%), by End User 2024 & 2032
- Figure 99: South America Global Automated Liquid Handling System Market Revenue (Million), by Country 2024 & 2032
- Figure 100: South America Global Automated Liquid Handling System Market Volume (K Unit), by Country 2024 & 2032
- Figure 101: South America Global Automated Liquid Handling System Market Revenue Share (%), by Country 2024 & 2032
- Figure 102: South America Global Automated Liquid Handling System Market Volume Share (%), by Country 2024 & 2032
List of Tables
- Table 1: Global Automated Liquid Handling System Market Revenue Million Forecast, by Region 2019 & 2032
- Table 2: Global Automated Liquid Handling System Market Volume K Unit Forecast, by Region 2019 & 2032
- Table 3: Global Automated Liquid Handling System Market Revenue Million Forecast, by Type 2019 & 2032
- Table 4: Global Automated Liquid Handling System Market Volume K Unit Forecast, by Type 2019 & 2032
- Table 5: Global Automated Liquid Handling System Market Revenue Million Forecast, by Product 2019 & 2032
- Table 6: Global Automated Liquid Handling System Market Volume K Unit Forecast, by Product 2019 & 2032
- Table 7: Global Automated Liquid Handling System Market Revenue Million Forecast, by End User 2019 & 2032
- Table 8: Global Automated Liquid Handling System Market Volume K Unit Forecast, by End User 2019 & 2032
- Table 9: Global Automated Liquid Handling System Market Revenue Million Forecast, by Region 2019 & 2032
- Table 10: Global Automated Liquid Handling System Market Volume K Unit Forecast, by Region 2019 & 2032
- Table 11: Global Automated Liquid Handling System Market Revenue Million Forecast, by Country 2019 & 2032
- Table 12: Global Automated Liquid Handling System Market Volume K Unit Forecast, by Country 2019 & 2032
- Table 13: United States Global Automated Liquid Handling System Market Revenue (Million) Forecast, by Application 2019 & 2032
- Table 14: United States Global Automated Liquid Handling System Market Volume (K Unit) Forecast, by Application 2019 & 2032
- Table 15: Canada Global Automated Liquid Handling System Market Revenue (Million) Forecast, by Application 2019 & 2032
- Table 16: Canada Global Automated Liquid Handling System Market Volume (K Unit) Forecast, by Application 2019 & 2032
- Table 17: Mexico Global Automated Liquid Handling System Market Revenue (Million) Forecast, by Application 2019 & 2032
- Table 18: Mexico Global Automated Liquid Handling System Market Volume (K Unit) Forecast, by Application 2019 & 2032
- Table 19: Global Automated Liquid Handling System Market Revenue Million Forecast, by Country 2019 & 2032
- Table 20: Global Automated Liquid Handling System Market Volume K Unit Forecast, by Country 2019 & 2032
- Table 21: Germany Global Automated Liquid Handling System Market Revenue (Million) Forecast, by Application 2019 & 2032
- Table 22: Germany Global Automated Liquid Handling System Market Volume (K Unit) Forecast, by Application 2019 & 2032
- Table 23: United Kingdom Global Automated Liquid Handling System Market Revenue (Million) Forecast, by Application 2019 & 2032
- Table 24: United Kingdom Global Automated Liquid Handling System Market Volume (K Unit) Forecast, by Application 2019 & 2032
- Table 25: France Global Automated Liquid Handling System Market Revenue (Million) Forecast, by Application 2019 & 2032
- Table 26: France Global Automated Liquid Handling System Market Volume (K Unit) Forecast, by Application 2019 & 2032
- Table 27: Italy Global Automated Liquid Handling System Market Revenue (Million) Forecast, by Application 2019 & 2032
- Table 28: Italy Global Automated Liquid Handling System Market Volume (K Unit) Forecast, by Application 2019 & 2032
- Table 29: Spain Global Automated Liquid Handling System Market Revenue (Million) Forecast, by Application 2019 & 2032
- Table 30: Spain Global Automated Liquid Handling System Market Volume (K Unit) Forecast, by Application 2019 & 2032
- Table 31: Rest of Europe Global Automated Liquid Handling System Market Revenue (Million) Forecast, by Application 2019 & 2032
- Table 32: Rest of Europe Global Automated Liquid Handling System Market Volume (K Unit) Forecast, by Application 2019 & 2032
- Table 33: Global Automated Liquid Handling System Market Revenue Million Forecast, by Country 2019 & 2032
- Table 34: Global Automated Liquid Handling System Market Volume K Unit Forecast, by Country 2019 & 2032
- Table 35: China Global Automated Liquid Handling System Market Revenue (Million) Forecast, by Application 2019 & 2032
- Table 36: China Global Automated Liquid Handling System Market Volume (K Unit) Forecast, by Application 2019 & 2032
- Table 37: Japan Global Automated Liquid Handling System Market Revenue (Million) Forecast, by Application 2019 & 2032
- Table 38: Japan Global Automated Liquid Handling System Market Volume (K Unit) Forecast, by Application 2019 & 2032
- Table 39: India Global Automated Liquid Handling System Market Revenue (Million) Forecast, by Application 2019 & 2032
- Table 40: India Global Automated Liquid Handling System Market Volume (K Unit) Forecast, by Application 2019 & 2032
- Table 41: Australia Global Automated Liquid Handling System Market Revenue (Million) Forecast, by Application 2019 & 2032
- Table 42: Australia Global Automated Liquid Handling System Market Volume (K Unit) Forecast, by Application 2019 & 2032
- Table 43: South Korea Global Automated Liquid Handling System Market Revenue (Million) Forecast, by Application 2019 & 2032
- Table 44: South Korea Global Automated Liquid Handling System Market Volume (K Unit) Forecast, by Application 2019 & 2032
- Table 45: Rest of Asia Pacific Global Automated Liquid Handling System Market Revenue (Million) Forecast, by Application 2019 & 2032
- Table 46: Rest of Asia Pacific Global Automated Liquid Handling System Market Volume (K Unit) Forecast, by Application 2019 & 2032
- Table 47: Global Automated Liquid Handling System Market Revenue Million Forecast, by Country 2019 & 2032
- Table 48: Global Automated Liquid Handling System Market Volume K Unit Forecast, by Country 2019 & 2032
- Table 49: GCC Global Automated Liquid Handling System Market Revenue (Million) Forecast, by Application 2019 & 2032
- Table 50: GCC Global Automated Liquid Handling System Market Volume (K Unit) Forecast, by Application 2019 & 2032
- Table 51: South Africa Global Automated Liquid Handling System Market Revenue (Million) Forecast, by Application 2019 & 2032
- Table 52: South Africa Global Automated Liquid Handling System Market Volume (K Unit) Forecast, by Application 2019 & 2032
- Table 53: Rest of Middle East and Africa Global Automated Liquid Handling System Market Revenue (Million) Forecast, by Application 2019 & 2032
- Table 54: Rest of Middle East and Africa Global Automated Liquid Handling System Market Volume (K Unit) Forecast, by Application 2019 & 2032
- Table 55: Global Automated Liquid Handling System Market Revenue Million Forecast, by Country 2019 & 2032
- Table 56: Global Automated Liquid Handling System Market Volume K Unit Forecast, by Country 2019 & 2032
- Table 57: Brazil Global Automated Liquid Handling System Market Revenue (Million) Forecast, by Application 2019 & 2032
- Table 58: Brazil Global Automated Liquid Handling System Market Volume (K Unit) Forecast, by Application 2019 & 2032
- Table 59: Argentina Global Automated Liquid Handling System Market Revenue (Million) Forecast, by Application 2019 & 2032
- Table 60: Argentina Global Automated Liquid Handling System Market Volume (K Unit) Forecast, by Application 2019 & 2032
- Table 61: Rest of South America Global Automated Liquid Handling System Market Revenue (Million) Forecast, by Application 2019 & 2032
- Table 62: Rest of South America Global Automated Liquid Handling System Market Volume (K Unit) Forecast, by Application 2019 & 2032
- Table 63: Global Automated Liquid Handling System Market Revenue Million Forecast, by Type 2019 & 2032
- Table 64: Global Automated Liquid Handling System Market Volume K Unit Forecast, by Type 2019 & 2032
- Table 65: Global Automated Liquid Handling System Market Revenue Million Forecast, by Product 2019 & 2032
- Table 66: Global Automated Liquid Handling System Market Volume K Unit Forecast, by Product 2019 & 2032
- Table 67: Global Automated Liquid Handling System Market Revenue Million Forecast, by End User 2019 & 2032
- Table 68: Global Automated Liquid Handling System Market Volume K Unit Forecast, by End User 2019 & 2032
- Table 69: Global Automated Liquid Handling System Market Revenue Million Forecast, by Country 2019 & 2032
- Table 70: Global Automated Liquid Handling System Market Volume K Unit Forecast, by Country 2019 & 2032
- Table 71: United States Global Automated Liquid Handling System Market Revenue (Million) Forecast, by Application 2019 & 2032
- Table 72: United States Global Automated Liquid Handling System Market Volume (K Unit) Forecast, by Application 2019 & 2032
- Table 73: Canada Global Automated Liquid Handling System Market Revenue (Million) Forecast, by Application 2019 & 2032
- Table 74: Canada Global Automated Liquid Handling System Market Volume (K Unit) Forecast, by Application 2019 & 2032
- Table 75: Mexico Global Automated Liquid Handling System Market Revenue (Million) Forecast, by Application 2019 & 2032
- Table 76: Mexico Global Automated Liquid Handling System Market Volume (K Unit) Forecast, by Application 2019 & 2032
- Table 77: Global Automated Liquid Handling System Market Revenue Million Forecast, by Type 2019 & 2032
- Table 78: Global Automated Liquid Handling System Market Volume K Unit Forecast, by Type 2019 & 2032
- Table 79: Global Automated Liquid Handling System Market Revenue Million Forecast, by Product 2019 & 2032
- Table 80: Global Automated Liquid Handling System Market Volume K Unit Forecast, by Product 2019 & 2032
- Table 81: Global Automated Liquid Handling System Market Revenue Million Forecast, by End User 2019 & 2032
- Table 82: Global Automated Liquid Handling System Market Volume K Unit Forecast, by End User 2019 & 2032
- Table 83: Global Automated Liquid Handling System Market Revenue Million Forecast, by Country 2019 & 2032
- Table 84: Global Automated Liquid Handling System Market Volume K Unit Forecast, by Country 2019 & 2032
- Table 85: Germany Global Automated Liquid Handling System Market Revenue (Million) Forecast, by Application 2019 & 2032
- Table 86: Germany Global Automated Liquid Handling System Market Volume (K Unit) Forecast, by Application 2019 & 2032
- Table 87: United Kingdom Global Automated Liquid Handling System Market Revenue (Million) Forecast, by Application 2019 & 2032
- Table 88: United Kingdom Global Automated Liquid Handling System Market Volume (K Unit) Forecast, by Application 2019 & 2032
- Table 89: France Global Automated Liquid Handling System Market Revenue (Million) Forecast, by Application 2019 & 2032
- Table 90: France Global Automated Liquid Handling System Market Volume (K Unit) Forecast, by Application 2019 & 2032
- Table 91: Italy Global Automated Liquid Handling System Market Revenue (Million) Forecast, by Application 2019 & 2032
- Table 92: Italy Global Automated Liquid Handling System Market Volume (K Unit) Forecast, by Application 2019 & 2032
- Table 93: Spain Global Automated Liquid Handling System Market Revenue (Million) Forecast, by Application 2019 & 2032
- Table 94: Spain Global Automated Liquid Handling System Market Volume (K Unit) Forecast, by Application 2019 & 2032
- Table 95: Rest of Europe Global Automated Liquid Handling System Market Revenue (Million) Forecast, by Application 2019 & 2032
- Table 96: Rest of Europe Global Automated Liquid Handling System Market Volume (K Unit) Forecast, by Application 2019 & 2032
- Table 97: Global Automated Liquid Handling System Market Revenue Million Forecast, by Type 2019 & 2032
- Table 98: Global Automated Liquid Handling System Market Volume K Unit Forecast, by Type 2019 & 2032
- Table 99: Global Automated Liquid Handling System Market Revenue Million Forecast, by Product 2019 & 2032
- Table 100: Global Automated Liquid Handling System Market Volume K Unit Forecast, by Product 2019 & 2032
- Table 101: Global Automated Liquid Handling System Market Revenue Million Forecast, by End User 2019 & 2032
- Table 102: Global Automated Liquid Handling System Market Volume K Unit Forecast, by End User 2019 & 2032
- Table 103: Global Automated Liquid Handling System Market Revenue Million Forecast, by Country 2019 & 2032
- Table 104: Global Automated Liquid Handling System Market Volume K Unit Forecast, by Country 2019 & 2032
- Table 105: China Global Automated Liquid Handling System Market Revenue (Million) Forecast, by Application 2019 & 2032
- Table 106: China Global Automated Liquid Handling System Market Volume (K Unit) Forecast, by Application 2019 & 2032
- Table 107: Japan Global Automated Liquid Handling System Market Revenue (Million) Forecast, by Application 2019 & 2032
- Table 108: Japan Global Automated Liquid Handling System Market Volume (K Unit) Forecast, by Application 2019 & 2032
- Table 109: India Global Automated Liquid Handling System Market Revenue (Million) Forecast, by Application 2019 & 2032
- Table 110: India Global Automated Liquid Handling System Market Volume (K Unit) Forecast, by Application 2019 & 2032
- Table 111: Australia Global Automated Liquid Handling System Market Revenue (Million) Forecast, by Application 2019 & 2032
- Table 112: Australia Global Automated Liquid Handling System Market Volume (K Unit) Forecast, by Application 2019 & 2032
- Table 113: South Korea Global Automated Liquid Handling System Market Revenue (Million) Forecast, by Application 2019 & 2032
- Table 114: South Korea Global Automated Liquid Handling System Market Volume (K Unit) Forecast, by Application 2019 & 2032
- Table 115: Rest of Asia Pacific Global Automated Liquid Handling System Market Revenue (Million) Forecast, by Application 2019 & 2032
- Table 116: Rest of Asia Pacific Global Automated Liquid Handling System Market Volume (K Unit) Forecast, by Application 2019 & 2032
- Table 117: Global Automated Liquid Handling System Market Revenue Million Forecast, by Type 2019 & 2032
- Table 118: Global Automated Liquid Handling System Market Volume K Unit Forecast, by Type 2019 & 2032
- Table 119: Global Automated Liquid Handling System Market Revenue Million Forecast, by Product 2019 & 2032
- Table 120: Global Automated Liquid Handling System Market Volume K Unit Forecast, by Product 2019 & 2032
- Table 121: Global Automated Liquid Handling System Market Revenue Million Forecast, by End User 2019 & 2032
- Table 122: Global Automated Liquid Handling System Market Volume K Unit Forecast, by End User 2019 & 2032
- Table 123: Global Automated Liquid Handling System Market Revenue Million Forecast, by Country 2019 & 2032
- Table 124: Global Automated Liquid Handling System Market Volume K Unit Forecast, by Country 2019 & 2032
- Table 125: GCC Global Automated Liquid Handling System Market Revenue (Million) Forecast, by Application 2019 & 2032
- Table 126: GCC Global Automated Liquid Handling System Market Volume (K Unit) Forecast, by Application 2019 & 2032
- Table 127: South Africa Global Automated Liquid Handling System Market Revenue (Million) Forecast, by Application 2019 & 2032
- Table 128: South Africa Global Automated Liquid Handling System Market Volume (K Unit) Forecast, by Application 2019 & 2032
- Table 129: Rest of Middle East and Africa Global Automated Liquid Handling System Market Revenue (Million) Forecast, by Application 2019 & 2032
- Table 130: Rest of Middle East and Africa Global Automated Liquid Handling System Market Volume (K Unit) Forecast, by Application 2019 & 2032
- Table 131: Global Automated Liquid Handling System Market Revenue Million Forecast, by Type 2019 & 2032
- Table 132: Global Automated Liquid Handling System Market Volume K Unit Forecast, by Type 2019 & 2032
- Table 133: Global Automated Liquid Handling System Market Revenue Million Forecast, by Product 2019 & 2032
- Table 134: Global Automated Liquid Handling System Market Volume K Unit Forecast, by Product 2019 & 2032
- Table 135: Global Automated Liquid Handling System Market Revenue Million Forecast, by End User 2019 & 2032
- Table 136: Global Automated Liquid Handling System Market Volume K Unit Forecast, by End User 2019 & 2032
- Table 137: Global Automated Liquid Handling System Market Revenue Million Forecast, by Country 2019 & 2032
- Table 138: Global Automated Liquid Handling System Market Volume K Unit Forecast, by Country 2019 & 2032
- Table 139: Brazil Global Automated Liquid Handling System Market Revenue (Million) Forecast, by Application 2019 & 2032
- Table 140: Brazil Global Automated Liquid Handling System Market Volume (K Unit) Forecast, by Application 2019 & 2032
- Table 141: Argentina Global Automated Liquid Handling System Market Revenue (Million) Forecast, by Application 2019 & 2032
- Table 142: Argentina Global Automated Liquid Handling System Market Volume (K Unit) Forecast, by Application 2019 & 2032
- Table 143: Rest of South America Global Automated Liquid Handling System Market Revenue (Million) Forecast, by Application 2019 & 2032
- Table 144: Rest of South America Global Automated Liquid Handling System Market Volume (K Unit) Forecast, by Application 2019 & 2032
Frequently Asked Questions
1. What is the projected Compound Annual Growth Rate (CAGR) of the Global Automated Liquid Handling System Market?
The projected CAGR is approximately 6.80%.
2. Which companies are prominent players in the Global Automated Liquid Handling System Market?
Key companies in the market include Becton Dickinson and Company, Mettler-Toledo International Inc, Tecan Group Ltd, Synchron Lab Automation, Analytik Jena AG (Endress+Hauser Group Services AG), Aurora Biomed Inc, Eppendorf AG, Formulatrix Inc, Corning Incorporated, Hamilton Company, Hudson Robotics Inc, Thermo Fisher Scientific, Agilent Technologies, Danaher Corporation (Beckman Coulter Inc ), Perkin Elmer Inc.
3. What are the main segments of the Global Automated Liquid Handling System Market?
The market segments include Type, Product, End User.
4. Can you provide details about the market size?
The market size is estimated to be USD XX Million as of 2022.
5. What are some drivers contributing to market growth?
Flexibility and Adaptability of Lab Automation Systems; Technological Advancements in Automated Liquid Handling Systems.
6. What are the notable trends driving market growth?
Liquid Handling Workstation are Expected to Witness Healthy Growth Over the Forecast Period.
7. Are there any restraints impacting market growth?
Slower Adoption Rates in Small- and Medium-sized Organizations.
8. Can you provide examples of recent developments in the market?
In June 2022, Beckman Coulter Life Sciences, and a company of Danaher Corporationunleashes the power of next-generation sequencing and makes it more accessible for research labs of all sizes with the launched of the Biomek NGeniuS liquid handling system
9. What pricing options are available for accessing the report?
Pricing options include single-user, multi-user, and enterprise licenses priced at USD 4750, USD 5250, and USD 8750 respectively.
10. Is the market size provided in terms of value or volume?
The market size is provided in terms of value, measured in Million and volume, measured in K Unit.
11. Are there any specific market keywords associated with the report?
Yes, the market keyword associated with the report is "Global Automated Liquid Handling System Market," which aids in identifying and referencing the specific market segment covered.
12. How do I determine which pricing option suits my needs best?
The pricing options vary based on user requirements and access needs. Individual users may opt for single-user licenses, while businesses requiring broader access may choose multi-user or enterprise licenses for cost-effective access to the report.
13. Are there any additional resources or data provided in the Global Automated Liquid Handling System Market report?
While the report offers comprehensive insights, it's advisable to review the specific contents or supplementary materials provided to ascertain if additional resources or data are available.
14. How can I stay updated on further developments or reports in the Global Automated Liquid Handling System Market?
To stay informed about further developments, trends, and reports in the Global Automated Liquid Handling System Market, consider subscribing to industry newsletters, following relevant companies and organizations, or regularly checking reputable industry news sources and publications.
Methodology
Step 1 - Identification of Relevant Samples Size from Population Database


Step 2 - Approaches for Defining Global Market Size (Value, Volume* & Price*)

Note*: In applicable scenarios
Step 3 - Data Sources
Primary Research
- Web Analytics
- Survey Reports
- Research Institute
- Latest Research Reports
- Opinion Leaders
Secondary Research
- Annual Reports
- White Paper
- Latest Press Release
- Industry Association
- Paid Database
- Investor Presentations

Step 4 - Data Triangulation
Involves using different sources of information in order to increase the validity of a study
These sources are likely to be stakeholders in a program - participants, other researchers, program staff, other community members, and so on.
Then we put all data in single framework & apply various statistical tools to find out the dynamic on the market.
During the analysis stage, feedback from the stakeholder groups would be compared to determine areas of agreement as well as areas of divergence


