

Key Insights
The oligonucleotide therapeutics market is projected for significant expansion, driven by advancements in genetic medicine, a deeper understanding of disease mechanisms, and the increasing prevalence of genetic disorders. The market, valued at $7.19 billion in 2025, is forecast to grow at a Compound Annual Growth Rate (CAGR) of 19.7% from 2025 to 2033. Key growth drivers include successful drug commercialization for rare genetic conditions, continuous innovation in oligonucleotide modalities (ASOs, siRNA, miRNA), and the rise of personalized medicine approaches for targeted genetic therapies. The therapeutics segment currently dominates, supported by a growing pipeline of FDA-approved treatments and active clinical trials.
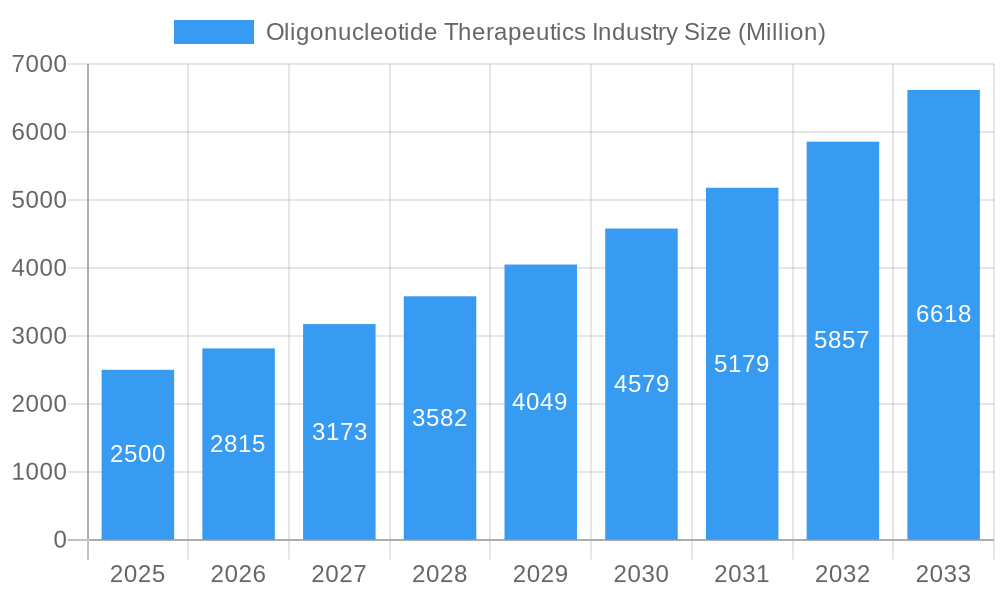
Oligonucleotide Therapeutics Industry Market Size (In Billion)
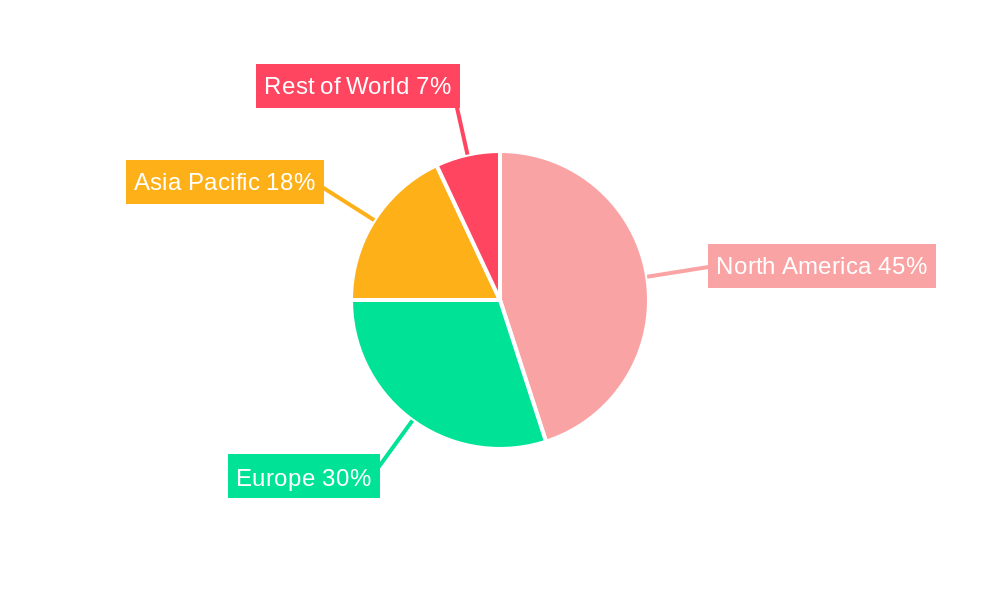
Geographically, North America leads the market, primarily driven by the United States' robust research ecosystem, substantial healthcare investment, and early adoption of novel treatments. Europe, with Germany and the UK as key contributors, also holds a significant share. The Asia-Pacific region is poised for substantial growth, attributed to rising healthcare expenditure, increased disease awareness, and growing R&D investments. However, challenges persist, including high development costs, regulatory hurdles, and potential adverse effects. Market segmentation indicates synthesized oligonucleotide products hold a dominant position. Leading companies such as Merck KGaA, Maravai LifeSciences, and Thermo Fisher Scientific are at the forefront, excelling in synthesis, formulation, and delivery. Enhanced delivery systems and improved safety profiles are critical for realizing the full market potential.
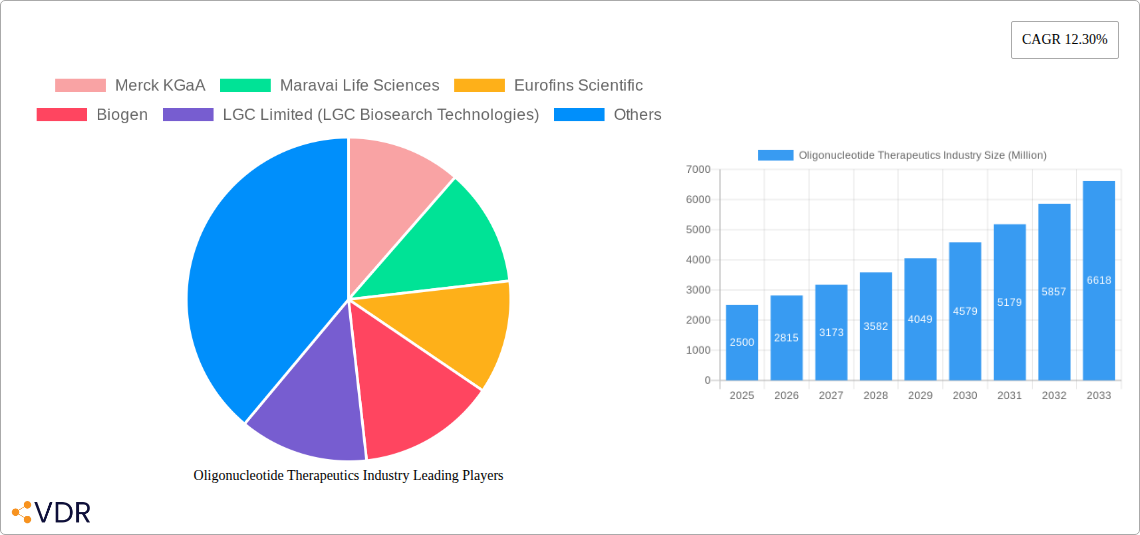
Oligonucleotide Therapeutics Industry Company Market Share
Oligonucleotide Therapeutics Industry: A Comprehensive Market Report (2019-2033)
This in-depth report provides a comprehensive analysis of the Oligonucleotide Therapeutics industry, encompassing market dynamics, growth trends, regional dominance, product landscape, key players, and future outlook. The study period spans from 2019 to 2033, with 2025 as the base and estimated year. This report is crucial for investors, researchers, and industry professionals seeking to understand and capitalize on the burgeoning opportunities within this rapidly evolving sector. The report analyzes the parent market of therapeutic oligonucleotides and its child markets, providing a granular view of the entire value chain. Market values are presented in million USD.
Oligonucleotide Therapeutics Industry Market Dynamics & Structure
The Oligonucleotide Therapeutics market is characterized by moderate concentration, with key players such as Merck KGaA, Biogen, and Thermo Fisher Scientific holding significant market share (estimated at xx% combined in 2025). Technological innovation, particularly in delivery mechanisms and target specificity, is a primary growth driver. Stringent regulatory frameworks and the need for extensive clinical trials present significant barriers to entry. Competitive pressure from emerging technologies and alternative therapies also impacts market dynamics. The end-user landscape is diverse, encompassing academic research institutes, pharmaceutical and biotechnology companies, and hospital and diagnostic laboratories. M&A activity within the sector has been steady, with an estimated xx deals recorded between 2019 and 2024, driven by the desire for expanded product portfolios and technological expertise.
- Market Concentration: Moderately concentrated, with top players holding xx% market share in 2025.
- Innovation Drivers: Advancements in delivery systems, target specificity, and next-generation sequencing.
- Regulatory Landscape: Stringent regulations increase development costs and time-to-market.
- Competitive Substitutes: Emerging gene editing technologies and other targeted therapies.
- End-User Demographics: Primarily pharmaceutical/biotech companies, followed by academic research and diagnostic labs.
- M&A Trends: Moderate activity, driven by portfolio expansion and technological acquisition.
Oligonucleotide Therapeutics Industry Growth Trends & Insights
The Oligonucleotide Therapeutics market has witnessed substantial growth from 2019 to 2024, driven by increasing prevalence of target diseases, technological advancements, and rising R&D investments. The market size is projected to reach xx million in 2025, exhibiting a CAGR of xx% during the forecast period (2025-2033). Increased adoption rates, particularly within therapeutic applications, are a key factor. Technological disruptions, such as the development of novel delivery systems (e.g., lipid nanoparticles), are revolutionizing the therapeutic potential of oligonucleotides. Consumer behavior shifts towards personalized medicine further fuel market expansion. The market penetration of oligonucleotide-based therapies is expected to increase significantly, reaching xx% by 2033.
Dominant Regions, Countries, or Segments in Oligonucleotide Therapeutics Industry
North America currently dominates the Oligonucleotide Therapeutics market, holding the largest market share (estimated at xx% in 2025), driven by robust R&D infrastructure, high healthcare expenditure, and a favorable regulatory environment. Europe follows as a significant market, while Asia-Pacific is poised for substantial growth due to increasing investments in healthcare infrastructure and rising prevalence of target diseases. Within the segments, the therapeutics application segment is the largest and fastest-growing, followed by research and diagnostics. Pharmaceutical and biotechnology companies represent the largest end-user segment, driven by their significant R&D investments. Synthesized oligonucleotide products dominate the product type segment.
- Key Regional Drivers: North America (robust R&D, high healthcare spending), Europe (strong regulatory framework), Asia-Pacific (rising healthcare investment).
- Leading Application Segment: Therapeutics, driven by successful clinical trials and market approvals.
- Largest End-User Segment: Pharmaceutical and Biotechnology companies, focusing on drug development.
- Dominant Product Type: Synthesized oligonucleotide products, owing to their versatility and efficacy.
Oligonucleotide Therapeutics Industry Product Landscape
The Oligonucleotide Therapeutics product landscape is diverse, encompassing synthesized oligonucleotide products (siRNA, antisense oligonucleotides, aptamers), reagents for oligonucleotide synthesis and modification, equipment for oligonucleotide production and analysis, and specialized services (e.g., custom oligonucleotide synthesis and modification). Significant advancements in oligonucleotide chemistry and delivery systems are enhancing therapeutic efficacy and reducing off-target effects. Unique selling propositions (USPs) include improved target specificity, reduced immunogenicity, and enhanced stability.
Key Drivers, Barriers & Challenges in Oligonucleotide Therapeutics Industry
Key Drivers:
- Technological advancements in delivery systems (e.g., lipid nanoparticles).
- Increasing prevalence of genetic disorders and chronic diseases.
- Rising investments in R&D and clinical trials.
- Growing demand for personalized medicine.
Challenges & Restraints:
- High manufacturing costs and complex synthesis processes.
- Stringent regulatory pathways leading to lengthy approval times.
- Potential for off-target effects and immunogenicity.
- Competition from other emerging therapeutic modalities. The cost of developing and manufacturing oligonucleotides contributes to high drug prices, impacting market accessibility.
Emerging Opportunities in Oligonucleotide Therapeutics Industry
- Expansion into novel therapeutic areas (e.g., oncology, neurodegenerative diseases).
- Development of next-generation oligonucleotide platforms (e.g., CRISPR-based therapies).
- Advancements in oligonucleotide delivery systems to improve tissue penetration and bioavailability.
- Growing demand for personalized medicine creates opportunities for tailored oligonucleotide therapies.
Growth Accelerators in the Oligonucleotide Therapeutics Industry
Technological breakthroughs in delivery mechanisms and improved target specificity are driving long-term growth. Strategic partnerships and collaborations between pharmaceutical companies and oligonucleotide technology developers are fueling innovation. Market expansion into emerging economies with increasing healthcare spending and rising prevalence of target diseases is also a major growth catalyst.
Key Players Shaping the Oligonucleotide Therapeutics Market
- Merck KGaA
- Maravai Life Sciences
- Eurofins Scientific
- Biogen
- LGC Limited (LGC Biosearch Technologies)
- Danaher Corporation
- GenScript
- Sarepta Therapeutics Inc
- Thermo Fisher Scientific
- Bio-Synthesis Inc
- Agilent Technologies
- Kaneka Corporation (Eurogentec)
Notable Milestones in Oligonucleotide Therapeutics Industry Sector
- July 2022: WuXi STA launches a new large-scale oligonucleotide and peptide manufacturing facility, significantly expanding global manufacturing capacity.
- April 2022: Bachem and Eli Lilly & Company collaborate to develop and manufacture oligonucleotide-based active pharmaceutical ingredients, accelerating innovation in this area.
In-Depth Oligonucleotide Therapeutics Industry Market Outlook
The Oligonucleotide Therapeutics market is poised for substantial growth over the next decade, driven by continued technological innovation, expanding therapeutic applications, and increasing investments in R&D. Strategic partnerships and collaborations will play a crucial role in accelerating market penetration and achieving widespread adoption. The development of novel delivery systems and improved oligonucleotide designs will further enhance efficacy and reduce side effects, ultimately expanding the market potential and creating lucrative opportunities for players within the industry.
Oligonucleotide Therapeutics Industry Segmentation
-
1. Product Type
- 1.1. Synthesized Oligonucleotide Products
- 1.2. Reagents
- 1.3. Equipment
- 1.4. Services
-
2. Application
- 2.1. Research
- 2.2. Diagnostics
- 2.3. Therapeutics
-
3. End-user
- 3.1. Academic Research Institutes
- 3.2. Pharmaceutical and Biotechnology Companies
- 3.3. Hospital and Diagnostic Laboratories
Oligonucleotide Therapeutics Industry Segmentation By Geography
-
1. North America
- 1.1. United States
- 1.2. Canada
- 1.3. Mexico
-
2. Europe
- 2.1. Germany
- 2.2. United Kingdom
- 2.3. France
- 2.4. Italy
- 2.5. Spain
- 2.6. Rest of Europe
-
3. Asia Pacific
- 3.1. China
- 3.2. Japan
- 3.3. India
- 3.4. Australia
- 3.5. South Korea
- 3.6. Rest of Asia Pacific
-
4. Middle East and Africa
- 4.1. GCC
- 4.2. South Africa
- 4.3. Rest of Middle East and Africa
-
5. South America
- 5.1. Brazil
- 5.2. Argentina
- 5.3. Rest of South America
Oligonucleotide Therapeutics Industry Regional Market Share
Geographic Coverage of Oligonucleotide Therapeutics Industry
Oligonucleotide Therapeutics Industry REPORT HIGHLIGHTS
| Aspects | Details |
|---|---|
| Study Period | 2020-2034 |
| Base Year | 2025 |
| Estimated Year | 2026 |
| Forecast Period | 2026-2034 |
| Historical Period | 2020-2025 |
| Growth Rate | CAGR of 19.7% from 2020-2034 |
| Segmentation |
|
Table of Contents
- 1. Introduction
- 1.1. Research Scope
- 1.2. Market Segmentation
- 1.3. Research Objective
- 1.4. Definitions and Assumptions
- 2. Executive Summary
- 2.1. Market Snapshot
- 3. Market Dynamics
- 3.1. Market Drivers
- 3.2. Market Restrains
- 3.3. Market Trends
- 3.4. Market Opportunities
- 4. Market Factor Analysis
- 4.1. Porters Five Forces
- 4.1.1. Bargaining Power of Suppliers
- 4.1.2. Bargaining Power of Buyers
- 4.1.3. Threat of New Entrants
- 4.1.4. Threat of Substitutes
- 4.1.5. Competitive Rivalry
- 4.2. PESTEL analysis
- 4.3. BCG Analysis
- 4.3.1. Stars (High Growth, High Market Share)
- 4.3.2. Cash Cows (Low Growth, High Market Share)
- 4.3.3. Question Mark (High Growth, Low Market Share)
- 4.3.4. Dogs (Low Growth, Low Market Share)
- 4.4. Ansoff Matrix Analysis
- 4.5. Supply Chain Analysis
- 4.6. Regulatory Landscape
- 4.7. Current Market Potential and Opportunity Assessment (TAM–SAM–SOM Framework)
- 4.8. VDR Analyst Note
- 4.1. Porters Five Forces
- 5. Market Analysis, Insights and Forecast 2021-2033
- 5.1. Market Analysis, Insights and Forecast - by Product Type
- 5.1.1. Synthesized Oligonucleotide Products
- 5.1.2. Reagents
- 5.1.3. Equipment
- 5.1.4. Services
- 5.2. Market Analysis, Insights and Forecast - by Application
- 5.2.1. Research
- 5.2.2. Diagnostics
- 5.2.3. Therapeutics
- 5.3. Market Analysis, Insights and Forecast - by End-user
- 5.3.1. Academic Research Institutes
- 5.3.2. Pharmaceutical and Biotechnology Companies
- 5.3.3. Hospital and Diagnostic Laboratories
- 5.4. Market Analysis, Insights and Forecast - by Region
- 5.4.1. North America
- 5.4.2. Europe
- 5.4.3. Asia Pacific
- 5.4.4. Middle East and Africa
- 5.4.5. South America
- 5.1. Market Analysis, Insights and Forecast - by Product Type
- 6. Global Oligonucleotide Therapeutics Industry Analysis, Insights and Forecast, 2021-2033
- 6.1. Market Analysis, Insights and Forecast - by Product Type
- 6.1.1. Synthesized Oligonucleotide Products
- 6.1.2. Reagents
- 6.1.3. Equipment
- 6.1.4. Services
- 6.2. Market Analysis, Insights and Forecast - by Application
- 6.2.1. Research
- 6.2.2. Diagnostics
- 6.2.3. Therapeutics
- 6.3. Market Analysis, Insights and Forecast - by End-user
- 6.3.1. Academic Research Institutes
- 6.3.2. Pharmaceutical and Biotechnology Companies
- 6.3.3. Hospital and Diagnostic Laboratories
- 6.1. Market Analysis, Insights and Forecast - by Product Type
- 7. North America Oligonucleotide Therapeutics Industry Analysis, Insights and Forecast, 2021-2033
- 7.1. Market Analysis, Insights and Forecast - by Product Type
- 7.1.1. Synthesized Oligonucleotide Products
- 7.1.2. Reagents
- 7.1.3. Equipment
- 7.1.4. Services
- 7.2. Market Analysis, Insights and Forecast - by Application
- 7.2.1. Research
- 7.2.2. Diagnostics
- 7.2.3. Therapeutics
- 7.3. Market Analysis, Insights and Forecast - by End-user
- 7.3.1. Academic Research Institutes
- 7.3.2. Pharmaceutical and Biotechnology Companies
- 7.3.3. Hospital and Diagnostic Laboratories
- 7.1. Market Analysis, Insights and Forecast - by Product Type
- 8. Europe Oligonucleotide Therapeutics Industry Analysis, Insights and Forecast, 2021-2033
- 8.1. Market Analysis, Insights and Forecast - by Product Type
- 8.1.1. Synthesized Oligonucleotide Products
- 8.1.2. Reagents
- 8.1.3. Equipment
- 8.1.4. Services
- 8.2. Market Analysis, Insights and Forecast - by Application
- 8.2.1. Research
- 8.2.2. Diagnostics
- 8.2.3. Therapeutics
- 8.3. Market Analysis, Insights and Forecast - by End-user
- 8.3.1. Academic Research Institutes
- 8.3.2. Pharmaceutical and Biotechnology Companies
- 8.3.3. Hospital and Diagnostic Laboratories
- 8.1. Market Analysis, Insights and Forecast - by Product Type
- 9. Asia Pacific Oligonucleotide Therapeutics Industry Analysis, Insights and Forecast, 2021-2033
- 9.1. Market Analysis, Insights and Forecast - by Product Type
- 9.1.1. Synthesized Oligonucleotide Products
- 9.1.2. Reagents
- 9.1.3. Equipment
- 9.1.4. Services
- 9.2. Market Analysis, Insights and Forecast - by Application
- 9.2.1. Research
- 9.2.2. Diagnostics
- 9.2.3. Therapeutics
- 9.3. Market Analysis, Insights and Forecast - by End-user
- 9.3.1. Academic Research Institutes
- 9.3.2. Pharmaceutical and Biotechnology Companies
- 9.3.3. Hospital and Diagnostic Laboratories
- 9.1. Market Analysis, Insights and Forecast - by Product Type
- 10. Middle East and Africa Oligonucleotide Therapeutics Industry Analysis, Insights and Forecast, 2021-2033
- 10.1. Market Analysis, Insights and Forecast - by Product Type
- 10.1.1. Synthesized Oligonucleotide Products
- 10.1.2. Reagents
- 10.1.3. Equipment
- 10.1.4. Services
- 10.2. Market Analysis, Insights and Forecast - by Application
- 10.2.1. Research
- 10.2.2. Diagnostics
- 10.2.3. Therapeutics
- 10.3. Market Analysis, Insights and Forecast - by End-user
- 10.3.1. Academic Research Institutes
- 10.3.2. Pharmaceutical and Biotechnology Companies
- 10.3.3. Hospital and Diagnostic Laboratories
- 10.1. Market Analysis, Insights and Forecast - by Product Type
- 11. South America Oligonucleotide Therapeutics Industry Analysis, Insights and Forecast, 2021-2033
- 11.1. Market Analysis, Insights and Forecast - by Product Type
- 11.1.1. Synthesized Oligonucleotide Products
- 11.1.2. Reagents
- 11.1.3. Equipment
- 11.1.4. Services
- 11.2. Market Analysis, Insights and Forecast - by Application
- 11.2.1. Research
- 11.2.2. Diagnostics
- 11.2.3. Therapeutics
- 11.3. Market Analysis, Insights and Forecast - by End-user
- 11.3.1. Academic Research Institutes
- 11.3.2. Pharmaceutical and Biotechnology Companies
- 11.3.3. Hospital and Diagnostic Laboratories
- 11.1. Market Analysis, Insights and Forecast - by Product Type
- 12. Competitive Analysis
- 12.1. Company Profiles
- 12.1.1 Merck KGaA
- 12.1.1.1. Company Overview
- 12.1.1.2. Products
- 12.1.1.3. Company Financials
- 12.1.1.4. SWOT Analysis
- 12.1.2 Maravai Life Sciences
- 12.1.2.1. Company Overview
- 12.1.2.2. Products
- 12.1.2.3. Company Financials
- 12.1.2.4. SWOT Analysis
- 12.1.3 Eurofins Scientific
- 12.1.3.1. Company Overview
- 12.1.3.2. Products
- 12.1.3.3. Company Financials
- 12.1.3.4. SWOT Analysis
- 12.1.4 Biogen
- 12.1.4.1. Company Overview
- 12.1.4.2. Products
- 12.1.4.3. Company Financials
- 12.1.4.4. SWOT Analysis
- 12.1.5 LGC Limited (LGC Biosearch Technologies)
- 12.1.5.1. Company Overview
- 12.1.5.2. Products
- 12.1.5.3. Company Financials
- 12.1.5.4. SWOT Analysis
- 12.1.6 Danaher Corporation
- 12.1.6.1. Company Overview
- 12.1.6.2. Products
- 12.1.6.3. Company Financials
- 12.1.6.4. SWOT Analysis
- 12.1.7 GenScript
- 12.1.7.1. Company Overview
- 12.1.7.2. Products
- 12.1.7.3. Company Financials
- 12.1.7.4. SWOT Analysis
- 12.1.8 Sarepta Therapeutics Inc
- 12.1.8.1. Company Overview
- 12.1.8.2. Products
- 12.1.8.3. Company Financials
- 12.1.8.4. SWOT Analysis
- 12.1.9 Thermo Fisher Scientific
- 12.1.9.1. Company Overview
- 12.1.9.2. Products
- 12.1.9.3. Company Financials
- 12.1.9.4. SWOT Analysis
- 12.1.10 Bio-Synthesis Inc
- 12.1.10.1. Company Overview
- 12.1.10.2. Products
- 12.1.10.3. Company Financials
- 12.1.10.4. SWOT Analysis
- 12.1.11 Agilent Technologies
- 12.1.11.1. Company Overview
- 12.1.11.2. Products
- 12.1.11.3. Company Financials
- 12.1.11.4. SWOT Analysis
- 12.1.12 Kaneka Corporation (Eurogentec)
- 12.1.12.1. Company Overview
- 12.1.12.2. Products
- 12.1.12.3. Company Financials
- 12.1.12.4. SWOT Analysis
- 12.1.1 Merck KGaA
- 12.2. Market Entropy
- 12.2.1 Company's Key Areas Served
- 12.2.2 Recent Developments
- 12.3. Company Market Share Analysis 2025
- 12.3.1 Top 5 Companies Market Share Analysis
- 12.3.2 Top 3 Companies Market Share Analysis
- 12.4. List of Potential Customers
- 13. Research Methodology
List of Figures
- Figure 1: Global Oligonucleotide Therapeutics Industry Revenue Breakdown (billion, %) by Region 2025 & 2033
- Figure 2: Global Oligonucleotide Therapeutics Industry Volume Breakdown (K Unit, %) by Region 2025 & 2033
- Figure 3: North America Oligonucleotide Therapeutics Industry Revenue (billion), by Product Type 2025 & 2033
- Figure 4: North America Oligonucleotide Therapeutics Industry Volume (K Unit), by Product Type 2025 & 2033
- Figure 5: North America Oligonucleotide Therapeutics Industry Revenue Share (%), by Product Type 2025 & 2033
- Figure 6: North America Oligonucleotide Therapeutics Industry Volume Share (%), by Product Type 2025 & 2033
- Figure 7: North America Oligonucleotide Therapeutics Industry Revenue (billion), by Application 2025 & 2033
- Figure 8: North America Oligonucleotide Therapeutics Industry Volume (K Unit), by Application 2025 & 2033
- Figure 9: North America Oligonucleotide Therapeutics Industry Revenue Share (%), by Application 2025 & 2033
- Figure 10: North America Oligonucleotide Therapeutics Industry Volume Share (%), by Application 2025 & 2033
- Figure 11: North America Oligonucleotide Therapeutics Industry Revenue (billion), by End-user 2025 & 2033
- Figure 12: North America Oligonucleotide Therapeutics Industry Volume (K Unit), by End-user 2025 & 2033
- Figure 13: North America Oligonucleotide Therapeutics Industry Revenue Share (%), by End-user 2025 & 2033
- Figure 14: North America Oligonucleotide Therapeutics Industry Volume Share (%), by End-user 2025 & 2033
- Figure 15: North America Oligonucleotide Therapeutics Industry Revenue (billion), by Country 2025 & 2033
- Figure 16: North America Oligonucleotide Therapeutics Industry Volume (K Unit), by Country 2025 & 2033
- Figure 17: North America Oligonucleotide Therapeutics Industry Revenue Share (%), by Country 2025 & 2033
- Figure 18: North America Oligonucleotide Therapeutics Industry Volume Share (%), by Country 2025 & 2033
- Figure 19: Europe Oligonucleotide Therapeutics Industry Revenue (billion), by Product Type 2025 & 2033
- Figure 20: Europe Oligonucleotide Therapeutics Industry Volume (K Unit), by Product Type 2025 & 2033
- Figure 21: Europe Oligonucleotide Therapeutics Industry Revenue Share (%), by Product Type 2025 & 2033
- Figure 22: Europe Oligonucleotide Therapeutics Industry Volume Share (%), by Product Type 2025 & 2033
- Figure 23: Europe Oligonucleotide Therapeutics Industry Revenue (billion), by Application 2025 & 2033
- Figure 24: Europe Oligonucleotide Therapeutics Industry Volume (K Unit), by Application 2025 & 2033
- Figure 25: Europe Oligonucleotide Therapeutics Industry Revenue Share (%), by Application 2025 & 2033
- Figure 26: Europe Oligonucleotide Therapeutics Industry Volume Share (%), by Application 2025 & 2033
- Figure 27: Europe Oligonucleotide Therapeutics Industry Revenue (billion), by End-user 2025 & 2033
- Figure 28: Europe Oligonucleotide Therapeutics Industry Volume (K Unit), by End-user 2025 & 2033
- Figure 29: Europe Oligonucleotide Therapeutics Industry Revenue Share (%), by End-user 2025 & 2033
- Figure 30: Europe Oligonucleotide Therapeutics Industry Volume Share (%), by End-user 2025 & 2033
- Figure 31: Europe Oligonucleotide Therapeutics Industry Revenue (billion), by Country 2025 & 2033
- Figure 32: Europe Oligonucleotide Therapeutics Industry Volume (K Unit), by Country 2025 & 2033
- Figure 33: Europe Oligonucleotide Therapeutics Industry Revenue Share (%), by Country 2025 & 2033
- Figure 34: Europe Oligonucleotide Therapeutics Industry Volume Share (%), by Country 2025 & 2033
- Figure 35: Asia Pacific Oligonucleotide Therapeutics Industry Revenue (billion), by Product Type 2025 & 2033
- Figure 36: Asia Pacific Oligonucleotide Therapeutics Industry Volume (K Unit), by Product Type 2025 & 2033
- Figure 37: Asia Pacific Oligonucleotide Therapeutics Industry Revenue Share (%), by Product Type 2025 & 2033
- Figure 38: Asia Pacific Oligonucleotide Therapeutics Industry Volume Share (%), by Product Type 2025 & 2033
- Figure 39: Asia Pacific Oligonucleotide Therapeutics Industry Revenue (billion), by Application 2025 & 2033
- Figure 40: Asia Pacific Oligonucleotide Therapeutics Industry Volume (K Unit), by Application 2025 & 2033
- Figure 41: Asia Pacific Oligonucleotide Therapeutics Industry Revenue Share (%), by Application 2025 & 2033
- Figure 42: Asia Pacific Oligonucleotide Therapeutics Industry Volume Share (%), by Application 2025 & 2033
- Figure 43: Asia Pacific Oligonucleotide Therapeutics Industry Revenue (billion), by End-user 2025 & 2033
- Figure 44: Asia Pacific Oligonucleotide Therapeutics Industry Volume (K Unit), by End-user 2025 & 2033
- Figure 45: Asia Pacific Oligonucleotide Therapeutics Industry Revenue Share (%), by End-user 2025 & 2033
- Figure 46: Asia Pacific Oligonucleotide Therapeutics Industry Volume Share (%), by End-user 2025 & 2033
- Figure 47: Asia Pacific Oligonucleotide Therapeutics Industry Revenue (billion), by Country 2025 & 2033
- Figure 48: Asia Pacific Oligonucleotide Therapeutics Industry Volume (K Unit), by Country 2025 & 2033
- Figure 49: Asia Pacific Oligonucleotide Therapeutics Industry Revenue Share (%), by Country 2025 & 2033
- Figure 50: Asia Pacific Oligonucleotide Therapeutics Industry Volume Share (%), by Country 2025 & 2033
- Figure 51: Middle East and Africa Oligonucleotide Therapeutics Industry Revenue (billion), by Product Type 2025 & 2033
- Figure 52: Middle East and Africa Oligonucleotide Therapeutics Industry Volume (K Unit), by Product Type 2025 & 2033
- Figure 53: Middle East and Africa Oligonucleotide Therapeutics Industry Revenue Share (%), by Product Type 2025 & 2033
- Figure 54: Middle East and Africa Oligonucleotide Therapeutics Industry Volume Share (%), by Product Type 2025 & 2033
- Figure 55: Middle East and Africa Oligonucleotide Therapeutics Industry Revenue (billion), by Application 2025 & 2033
- Figure 56: Middle East and Africa Oligonucleotide Therapeutics Industry Volume (K Unit), by Application 2025 & 2033
- Figure 57: Middle East and Africa Oligonucleotide Therapeutics Industry Revenue Share (%), by Application 2025 & 2033
- Figure 58: Middle East and Africa Oligonucleotide Therapeutics Industry Volume Share (%), by Application 2025 & 2033
- Figure 59: Middle East and Africa Oligonucleotide Therapeutics Industry Revenue (billion), by End-user 2025 & 2033
- Figure 60: Middle East and Africa Oligonucleotide Therapeutics Industry Volume (K Unit), by End-user 2025 & 2033
- Figure 61: Middle East and Africa Oligonucleotide Therapeutics Industry Revenue Share (%), by End-user 2025 & 2033
- Figure 62: Middle East and Africa Oligonucleotide Therapeutics Industry Volume Share (%), by End-user 2025 & 2033
- Figure 63: Middle East and Africa Oligonucleotide Therapeutics Industry Revenue (billion), by Country 2025 & 2033
- Figure 64: Middle East and Africa Oligonucleotide Therapeutics Industry Volume (K Unit), by Country 2025 & 2033
- Figure 65: Middle East and Africa Oligonucleotide Therapeutics Industry Revenue Share (%), by Country 2025 & 2033
- Figure 66: Middle East and Africa Oligonucleotide Therapeutics Industry Volume Share (%), by Country 2025 & 2033
- Figure 67: South America Oligonucleotide Therapeutics Industry Revenue (billion), by Product Type 2025 & 2033
- Figure 68: South America Oligonucleotide Therapeutics Industry Volume (K Unit), by Product Type 2025 & 2033
- Figure 69: South America Oligonucleotide Therapeutics Industry Revenue Share (%), by Product Type 2025 & 2033
- Figure 70: South America Oligonucleotide Therapeutics Industry Volume Share (%), by Product Type 2025 & 2033
- Figure 71: South America Oligonucleotide Therapeutics Industry Revenue (billion), by Application 2025 & 2033
- Figure 72: South America Oligonucleotide Therapeutics Industry Volume (K Unit), by Application 2025 & 2033
- Figure 73: South America Oligonucleotide Therapeutics Industry Revenue Share (%), by Application 2025 & 2033
- Figure 74: South America Oligonucleotide Therapeutics Industry Volume Share (%), by Application 2025 & 2033
- Figure 75: South America Oligonucleotide Therapeutics Industry Revenue (billion), by End-user 2025 & 2033
- Figure 76: South America Oligonucleotide Therapeutics Industry Volume (K Unit), by End-user 2025 & 2033
- Figure 77: South America Oligonucleotide Therapeutics Industry Revenue Share (%), by End-user 2025 & 2033
- Figure 78: South America Oligonucleotide Therapeutics Industry Volume Share (%), by End-user 2025 & 2033
- Figure 79: South America Oligonucleotide Therapeutics Industry Revenue (billion), by Country 2025 & 2033
- Figure 80: South America Oligonucleotide Therapeutics Industry Volume (K Unit), by Country 2025 & 2033
- Figure 81: South America Oligonucleotide Therapeutics Industry Revenue Share (%), by Country 2025 & 2033
- Figure 82: South America Oligonucleotide Therapeutics Industry Volume Share (%), by Country 2025 & 2033
List of Tables
- Table 1: Global Oligonucleotide Therapeutics Industry Revenue billion Forecast, by Product Type 2020 & 2033
- Table 2: Global Oligonucleotide Therapeutics Industry Volume K Unit Forecast, by Product Type 2020 & 2033
- Table 3: Global Oligonucleotide Therapeutics Industry Revenue billion Forecast, by Application 2020 & 2033
- Table 4: Global Oligonucleotide Therapeutics Industry Volume K Unit Forecast, by Application 2020 & 2033
- Table 5: Global Oligonucleotide Therapeutics Industry Revenue billion Forecast, by End-user 2020 & 2033
- Table 6: Global Oligonucleotide Therapeutics Industry Volume K Unit Forecast, by End-user 2020 & 2033
- Table 7: Global Oligonucleotide Therapeutics Industry Revenue billion Forecast, by Region 2020 & 2033
- Table 8: Global Oligonucleotide Therapeutics Industry Volume K Unit Forecast, by Region 2020 & 2033
- Table 9: Global Oligonucleotide Therapeutics Industry Revenue billion Forecast, by Product Type 2020 & 2033
- Table 10: Global Oligonucleotide Therapeutics Industry Volume K Unit Forecast, by Product Type 2020 & 2033
- Table 11: Global Oligonucleotide Therapeutics Industry Revenue billion Forecast, by Application 2020 & 2033
- Table 12: Global Oligonucleotide Therapeutics Industry Volume K Unit Forecast, by Application 2020 & 2033
- Table 13: Global Oligonucleotide Therapeutics Industry Revenue billion Forecast, by End-user 2020 & 2033
- Table 14: Global Oligonucleotide Therapeutics Industry Volume K Unit Forecast, by End-user 2020 & 2033
- Table 15: Global Oligonucleotide Therapeutics Industry Revenue billion Forecast, by Country 2020 & 2033
- Table 16: Global Oligonucleotide Therapeutics Industry Volume K Unit Forecast, by Country 2020 & 2033
- Table 17: United States Oligonucleotide Therapeutics Industry Revenue (billion) Forecast, by Application 2020 & 2033
- Table 18: United States Oligonucleotide Therapeutics Industry Volume (K Unit) Forecast, by Application 2020 & 2033
- Table 19: Canada Oligonucleotide Therapeutics Industry Revenue (billion) Forecast, by Application 2020 & 2033
- Table 20: Canada Oligonucleotide Therapeutics Industry Volume (K Unit) Forecast, by Application 2020 & 2033
- Table 21: Mexico Oligonucleotide Therapeutics Industry Revenue (billion) Forecast, by Application 2020 & 2033
- Table 22: Mexico Oligonucleotide Therapeutics Industry Volume (K Unit) Forecast, by Application 2020 & 2033
- Table 23: Global Oligonucleotide Therapeutics Industry Revenue billion Forecast, by Product Type 2020 & 2033
- Table 24: Global Oligonucleotide Therapeutics Industry Volume K Unit Forecast, by Product Type 2020 & 2033
- Table 25: Global Oligonucleotide Therapeutics Industry Revenue billion Forecast, by Application 2020 & 2033
- Table 26: Global Oligonucleotide Therapeutics Industry Volume K Unit Forecast, by Application 2020 & 2033
- Table 27: Global Oligonucleotide Therapeutics Industry Revenue billion Forecast, by End-user 2020 & 2033
- Table 28: Global Oligonucleotide Therapeutics Industry Volume K Unit Forecast, by End-user 2020 & 2033
- Table 29: Global Oligonucleotide Therapeutics Industry Revenue billion Forecast, by Country 2020 & 2033
- Table 30: Global Oligonucleotide Therapeutics Industry Volume K Unit Forecast, by Country 2020 & 2033
- Table 31: Germany Oligonucleotide Therapeutics Industry Revenue (billion) Forecast, by Application 2020 & 2033
- Table 32: Germany Oligonucleotide Therapeutics Industry Volume (K Unit) Forecast, by Application 2020 & 2033
- Table 33: United Kingdom Oligonucleotide Therapeutics Industry Revenue (billion) Forecast, by Application 2020 & 2033
- Table 34: United Kingdom Oligonucleotide Therapeutics Industry Volume (K Unit) Forecast, by Application 2020 & 2033
- Table 35: France Oligonucleotide Therapeutics Industry Revenue (billion) Forecast, by Application 2020 & 2033
- Table 36: France Oligonucleotide Therapeutics Industry Volume (K Unit) Forecast, by Application 2020 & 2033
- Table 37: Italy Oligonucleotide Therapeutics Industry Revenue (billion) Forecast, by Application 2020 & 2033
- Table 38: Italy Oligonucleotide Therapeutics Industry Volume (K Unit) Forecast, by Application 2020 & 2033
- Table 39: Spain Oligonucleotide Therapeutics Industry Revenue (billion) Forecast, by Application 2020 & 2033
- Table 40: Spain Oligonucleotide Therapeutics Industry Volume (K Unit) Forecast, by Application 2020 & 2033
- Table 41: Rest of Europe Oligonucleotide Therapeutics Industry Revenue (billion) Forecast, by Application 2020 & 2033
- Table 42: Rest of Europe Oligonucleotide Therapeutics Industry Volume (K Unit) Forecast, by Application 2020 & 2033
- Table 43: Global Oligonucleotide Therapeutics Industry Revenue billion Forecast, by Product Type 2020 & 2033
- Table 44: Global Oligonucleotide Therapeutics Industry Volume K Unit Forecast, by Product Type 2020 & 2033
- Table 45: Global Oligonucleotide Therapeutics Industry Revenue billion Forecast, by Application 2020 & 2033
- Table 46: Global Oligonucleotide Therapeutics Industry Volume K Unit Forecast, by Application 2020 & 2033
- Table 47: Global Oligonucleotide Therapeutics Industry Revenue billion Forecast, by End-user 2020 & 2033
- Table 48: Global Oligonucleotide Therapeutics Industry Volume K Unit Forecast, by End-user 2020 & 2033
- Table 49: Global Oligonucleotide Therapeutics Industry Revenue billion Forecast, by Country 2020 & 2033
- Table 50: Global Oligonucleotide Therapeutics Industry Volume K Unit Forecast, by Country 2020 & 2033
- Table 51: China Oligonucleotide Therapeutics Industry Revenue (billion) Forecast, by Application 2020 & 2033
- Table 52: China Oligonucleotide Therapeutics Industry Volume (K Unit) Forecast, by Application 2020 & 2033
- Table 53: Japan Oligonucleotide Therapeutics Industry Revenue (billion) Forecast, by Application 2020 & 2033
- Table 54: Japan Oligonucleotide Therapeutics Industry Volume (K Unit) Forecast, by Application 2020 & 2033
- Table 55: India Oligonucleotide Therapeutics Industry Revenue (billion) Forecast, by Application 2020 & 2033
- Table 56: India Oligonucleotide Therapeutics Industry Volume (K Unit) Forecast, by Application 2020 & 2033
- Table 57: Australia Oligonucleotide Therapeutics Industry Revenue (billion) Forecast, by Application 2020 & 2033
- Table 58: Australia Oligonucleotide Therapeutics Industry Volume (K Unit) Forecast, by Application 2020 & 2033
- Table 59: South Korea Oligonucleotide Therapeutics Industry Revenue (billion) Forecast, by Application 2020 & 2033
- Table 60: South Korea Oligonucleotide Therapeutics Industry Volume (K Unit) Forecast, by Application 2020 & 2033
- Table 61: Rest of Asia Pacific Oligonucleotide Therapeutics Industry Revenue (billion) Forecast, by Application 2020 & 2033
- Table 62: Rest of Asia Pacific Oligonucleotide Therapeutics Industry Volume (K Unit) Forecast, by Application 2020 & 2033
- Table 63: Global Oligonucleotide Therapeutics Industry Revenue billion Forecast, by Product Type 2020 & 2033
- Table 64: Global Oligonucleotide Therapeutics Industry Volume K Unit Forecast, by Product Type 2020 & 2033
- Table 65: Global Oligonucleotide Therapeutics Industry Revenue billion Forecast, by Application 2020 & 2033
- Table 66: Global Oligonucleotide Therapeutics Industry Volume K Unit Forecast, by Application 2020 & 2033
- Table 67: Global Oligonucleotide Therapeutics Industry Revenue billion Forecast, by End-user 2020 & 2033
- Table 68: Global Oligonucleotide Therapeutics Industry Volume K Unit Forecast, by End-user 2020 & 2033
- Table 69: Global Oligonucleotide Therapeutics Industry Revenue billion Forecast, by Country 2020 & 2033
- Table 70: Global Oligonucleotide Therapeutics Industry Volume K Unit Forecast, by Country 2020 & 2033
- Table 71: GCC Oligonucleotide Therapeutics Industry Revenue (billion) Forecast, by Application 2020 & 2033
- Table 72: GCC Oligonucleotide Therapeutics Industry Volume (K Unit) Forecast, by Application 2020 & 2033
- Table 73: South Africa Oligonucleotide Therapeutics Industry Revenue (billion) Forecast, by Application 2020 & 2033
- Table 74: South Africa Oligonucleotide Therapeutics Industry Volume (K Unit) Forecast, by Application 2020 & 2033
- Table 75: Rest of Middle East and Africa Oligonucleotide Therapeutics Industry Revenue (billion) Forecast, by Application 2020 & 2033
- Table 76: Rest of Middle East and Africa Oligonucleotide Therapeutics Industry Volume (K Unit) Forecast, by Application 2020 & 2033
- Table 77: Global Oligonucleotide Therapeutics Industry Revenue billion Forecast, by Product Type 2020 & 2033
- Table 78: Global Oligonucleotide Therapeutics Industry Volume K Unit Forecast, by Product Type 2020 & 2033
- Table 79: Global Oligonucleotide Therapeutics Industry Revenue billion Forecast, by Application 2020 & 2033
- Table 80: Global Oligonucleotide Therapeutics Industry Volume K Unit Forecast, by Application 2020 & 2033
- Table 81: Global Oligonucleotide Therapeutics Industry Revenue billion Forecast, by End-user 2020 & 2033
- Table 82: Global Oligonucleotide Therapeutics Industry Volume K Unit Forecast, by End-user 2020 & 2033
- Table 83: Global Oligonucleotide Therapeutics Industry Revenue billion Forecast, by Country 2020 & 2033
- Table 84: Global Oligonucleotide Therapeutics Industry Volume K Unit Forecast, by Country 2020 & 2033
- Table 85: Brazil Oligonucleotide Therapeutics Industry Revenue (billion) Forecast, by Application 2020 & 2033
- Table 86: Brazil Oligonucleotide Therapeutics Industry Volume (K Unit) Forecast, by Application 2020 & 2033
- Table 87: Argentina Oligonucleotide Therapeutics Industry Revenue (billion) Forecast, by Application 2020 & 2033
- Table 88: Argentina Oligonucleotide Therapeutics Industry Volume (K Unit) Forecast, by Application 2020 & 2033
- Table 89: Rest of South America Oligonucleotide Therapeutics Industry Revenue (billion) Forecast, by Application 2020 & 2033
- Table 90: Rest of South America Oligonucleotide Therapeutics Industry Volume (K Unit) Forecast, by Application 2020 & 2033
Frequently Asked Questions
1. What is the projected Compound Annual Growth Rate (CAGR) of the Oligonucleotide Therapeutics Industry?
The projected CAGR is approximately 19.7%.
2. Which companies are prominent players in the Oligonucleotide Therapeutics Industry?
Key companies in the market include Merck KGaA, Maravai Life Sciences, Eurofins Scientific, Biogen, LGC Limited (LGC Biosearch Technologies), Danaher Corporation, GenScript, Sarepta Therapeutics Inc , Thermo Fisher Scientific, Bio-Synthesis Inc, Agilent Technologies, Kaneka Corporation (Eurogentec).
3. What are the main segments of the Oligonucleotide Therapeutics Industry?
The market segments include Product Type, Application, End-user.
4. Can you provide details about the market size?
The market size is estimated to be USD 7.19 billion as of 2022.
5. What are some drivers contributing to market growth?
Increasing Government Investments and R&D Expenditure in Pharmaceutical and Biotechnology Companies; The Use of Synthesized Oligonucleotides in Molecular Diagnostics and Clinical Applications.
6. What are the notable trends driving market growth?
Therapeutic Segment Expected to Register a High CAGR.
7. Are there any restraints impacting market growth?
High Treatment Cost of Oligonucleotides; Lack of Skilled Professionals and Research Support in Undeveloped Countries.
8. Can you provide examples of recent developments in the market?
July 2022: WuXi STA, a subsidiary of WuXi AppTec, launched a new large-scale oligonucleotide and peptide manufacturing facility at its Changzhou campus. This new launch enhances its capacity and capability to meet the fast-growing customer needs for oligonucleotide and peptide therapeutics development and manufacturing worldwide.
9. What pricing options are available for accessing the report?
Pricing options include single-user, multi-user, and enterprise licenses priced at USD 4750, USD 5250, and USD 8750 respectively.
10. Is the market size provided in terms of value or volume?
The market size is provided in terms of value, measured in billion and volume, measured in K Unit.
11. Are there any specific market keywords associated with the report?
Yes, the market keyword associated with the report is "Oligonucleotide Therapeutics Industry," which aids in identifying and referencing the specific market segment covered.
12. How do I determine which pricing option suits my needs best?
The pricing options vary based on user requirements and access needs. Individual users may opt for single-user licenses, while businesses requiring broader access may choose multi-user or enterprise licenses for cost-effective access to the report.
13. Are there any additional resources or data provided in the Oligonucleotide Therapeutics Industry report?
While the report offers comprehensive insights, it's advisable to review the specific contents or supplementary materials provided to ascertain if additional resources or data are available.
14. How can I stay updated on further developments or reports in the Oligonucleotide Therapeutics Industry?
To stay informed about further developments, trends, and reports in the Oligonucleotide Therapeutics Industry, consider subscribing to industry newsletters, following relevant companies and organizations, or regularly checking reputable industry news sources and publications.
Methodology
Step 1 - Identification of Relevant Samples Size from Population Database


Step 2 - Approaches for Defining Global Market Size (Value, Volume* & Price*)

Note*: In applicable scenarios
Step 3 - Data Sources
Primary Research
- Web Analytics
- Survey Reports
- Research Institute
- Latest Research Reports
- Opinion Leaders
Secondary Research
- Annual Reports
- White Paper
- Latest Press Release
- Industry Association
- Paid Database
- Investor Presentations

Step 4 - Data Triangulation
Involves using different sources of information in order to increase the validity of a study
These sources are likely to be stakeholders in a program - participants, other researchers, program staff, other community members, and so on.
Then we put all data in single framework & apply various statistical tools to find out the dynamic on the market.
During the analysis stage, feedback from the stakeholder groups would be compared to determine areas of agreement as well as areas of divergence