
Key Insights
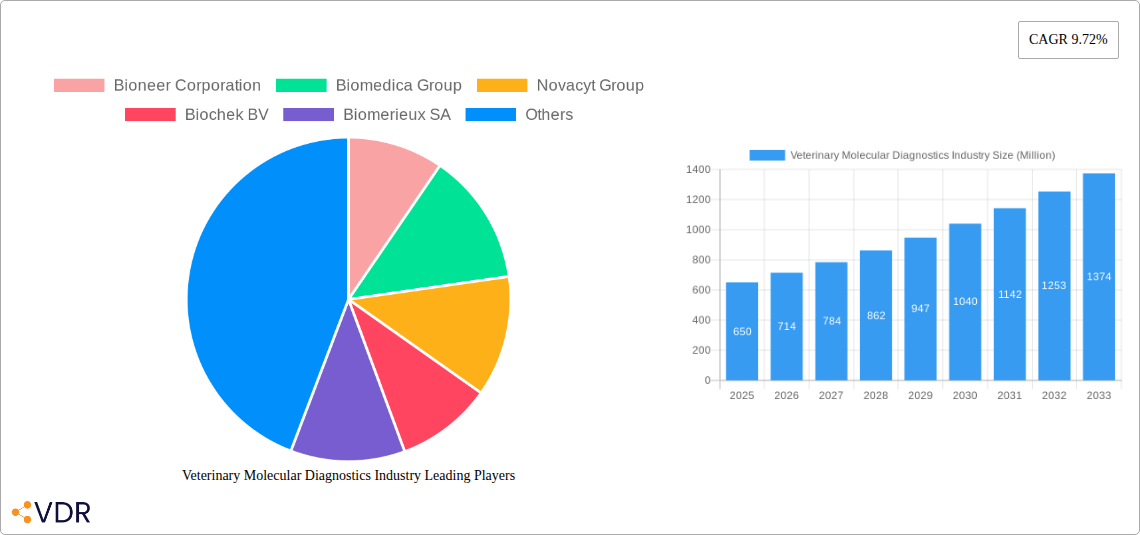
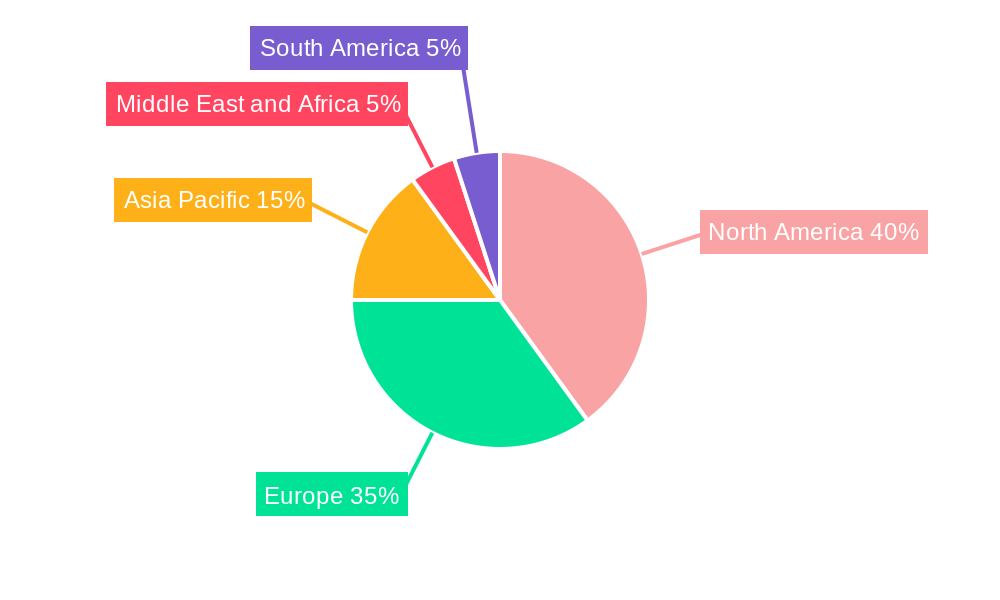
The veterinary molecular diagnostics market, currently valued at $0.65 billion in 2025, is projected to experience robust growth, driven by several key factors. Increasing prevalence of infectious diseases in animal populations, coupled with the rising demand for rapid and accurate diagnostic tools, fuels market expansion. Technological advancements, particularly in PCR, microarray, and DNA sequencing technologies, are enabling more sensitive and specific diagnostic tests, leading to earlier disease detection and improved treatment outcomes. The growing adoption of companion animals globally and increasing investment in animal healthcare infrastructure further contribute to market growth. Furthermore, the development of point-of-care diagnostic tools is streamlining testing processes, reducing turnaround times, and improving accessibility in remote areas. This trend is particularly significant in regions with limited veterinary resources. The market is segmented by product (instruments, kits & reagents, software & services), application (infectious diseases, genetics, other applications), and technology, offering diverse opportunities for market players. North America and Europe currently hold significant market share due to advanced healthcare infrastructure and higher adoption rates, but the Asia-Pacific region is poised for substantial growth driven by increasing veterinary spending and rising awareness of animal health.
However, challenges remain. High costs associated with advanced diagnostic technologies and the need for specialized expertise to operate and interpret results can limit market penetration, particularly in developing countries. Regulatory hurdles and variations in diagnostic standards across different regions also pose challenges. Despite these restraints, the long-term outlook for the veterinary molecular diagnostics market remains positive, with the continuous development of innovative technologies and increasing government support for animal health initiatives expected to drive substantial growth over the forecast period (2025-2033). The market is expected to be highly competitive, with established players alongside emerging companies vying for market share. Strategic partnerships, acquisitions, and the development of new diagnostic assays will be key strategies for success in this dynamic market.
Veterinary Molecular Diagnostics Market Report: 2019-2033
This comprehensive report provides a detailed analysis of the Veterinary Molecular Diagnostics market, encompassing market dynamics, growth trends, regional segmentation, product landscape, key players, and future outlook. The study period covers 2019-2033, with 2025 as the base year and a forecast period of 2025-2033. The report utilizes both quantitative and qualitative data to deliver actionable insights for industry professionals, investors, and stakeholders. The total market value in 2025 is estimated at XX Million.
Veterinary Molecular Diagnostics Industry Market Dynamics & Structure
The veterinary molecular diagnostics market is experiencing robust growth driven by technological advancements, increasing prevalence of animal diseases, and rising demand for accurate and rapid diagnostic tools. Market concentration is moderate, with several key players holding significant market share. Technological innovation, particularly in PCR and next-generation sequencing (NGS), is a major driver. Regulatory frameworks, varying across regions, influence market access and product approvals. Competitive pressures stem from the emergence of substitute technologies and new entrants. M&A activity is significant, reflecting consolidation and expansion strategies within the industry.
- Market Concentration: Moderately concentrated, with top 5 players holding approximately xx% market share in 2025.
- Technological Innovation: PCR remains dominant, but NGS and microarray technologies are gaining traction. Innovation barriers include high R&D costs and regulatory hurdles.
- Regulatory Frameworks: Vary significantly across different geographies, impacting market access and product approval timelines.
- Competitive Landscape: Intense competition among established players and emerging companies; presence of substitute diagnostic methods.
- M&A Activity: Significant M&A activity observed in recent years, with xx deals recorded between 2019 and 2024. Deals focused on expanding product portfolios and geographic reach.
- End-User Demographics: Primarily veterinary clinics, diagnostic laboratories, and research institutions.
Veterinary Molecular Diagnostics Industry Growth Trends & Insights
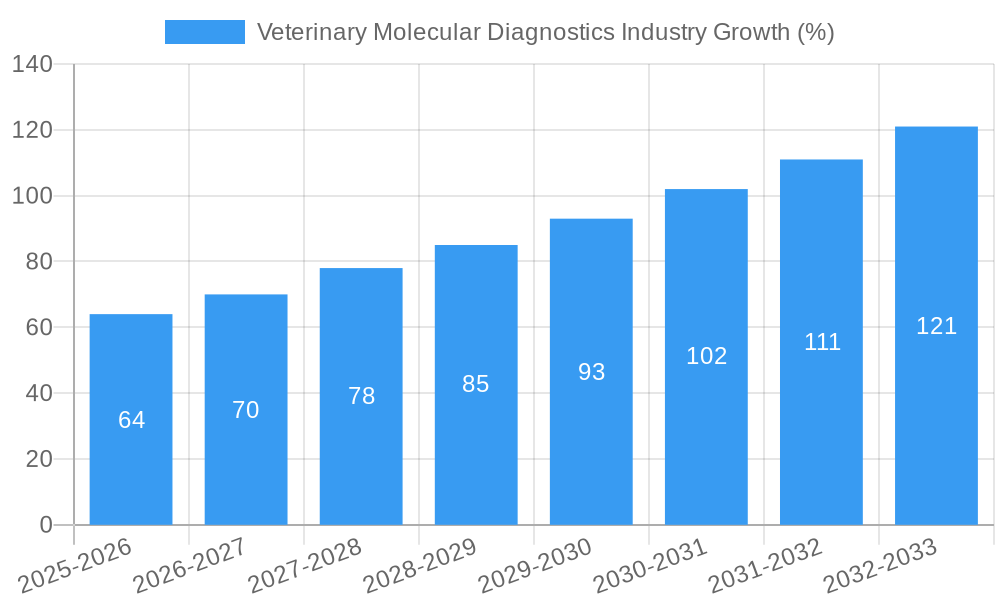
The veterinary molecular diagnostics market has exhibited a Compound Annual Growth Rate (CAGR) of xx% during the historical period (2019-2024) and is projected to maintain a CAGR of xx% during the forecast period (2025-2033). This growth is fueled by factors such as increasing animal health awareness, rising pet ownership, technological advancements in diagnostic techniques, and expanding application areas. The adoption rate of molecular diagnostic tests in veterinary settings is steadily increasing, driven by their superior accuracy and speed compared to traditional methods. Consumer behavior shifts towards proactive animal healthcare further boost market growth. Technological disruptions, such as the development of point-of-care diagnostics and AI-powered analysis tools, are reshaping the market landscape. Market penetration is expected to increase significantly during the forecast period, reaching xx% by 2033.
Dominant Regions, Countries, or Segments in Veterinary Molecular Diagnostics Industry
North America currently dominates the veterinary molecular diagnostics market, driven by factors such as high pet ownership rates, advanced healthcare infrastructure, and strong regulatory support. Europe follows as the second largest market, with significant growth potential in emerging economies. Within the market segments, the Kit and Reagents segment holds the largest market share due to high demand for consumables. Infectious Diseases is the leading application segment, driven by the increasing prevalence of zoonotic diseases and the need for rapid and accurate diagnostics. PCR technology dominates the technology segment due to its reliability, sensitivity, and cost-effectiveness.
- North America: High adoption rates, strong regulatory environment, and high expenditure on animal healthcare.
- Europe: Growing awareness, increasing pet ownership, and rising prevalence of animal diseases.
- Asia-Pacific: High growth potential, driven by increasing pet ownership, economic growth, and improving healthcare infrastructure.
- By Product: Kit and Reagents segment holds the largest market share (xx%), followed by Instruments (xx%) and Software & Services (xx%).
- By Application: Infectious Diseases segment is the largest (xx%), followed by Genetics (xx%) and Other Applications (xx%).
- By Technology: PCR technology dominates (xx%), followed by Microarray (xx%) and DNA Sequencing (xx%).
Veterinary Molecular Diagnostics Industry Product Landscape
The veterinary molecular diagnostics market offers a diverse range of products, including PCR instruments, kits and reagents, microarray platforms, and advanced software solutions for data analysis. Continuous innovation focuses on enhancing sensitivity, specificity, speed, and ease of use. These advancements reduce the time to diagnosis and improve the accuracy of results. Key features such as automation, multiplexing capabilities, and integrated data management systems drive product differentiation. The market witnesses a shift towards point-of-care diagnostics, enabling faster and more accessible testing in remote locations.
Key Drivers, Barriers & Challenges in Veterinary Molecular Diagnostics Industry
Key Drivers:
- Increasing prevalence of zoonotic diseases and the need for rapid and accurate diagnostics.
- Rising pet ownership and increased spending on animal healthcare.
- Technological advancements leading to improved sensitivity, specificity, and speed of tests.
- Growing demand for personalized veterinary medicine.
Key Barriers & Challenges:
- High cost of advanced technologies, limiting accessibility in resource-constrained settings.
- Stringent regulatory requirements for diagnostic approvals, delaying market entry for new products.
- Competition from traditional diagnostic methods.
- Supply chain disruptions impacting the availability of critical reagents and consumables. (Estimated impact on market growth: xx%)
Emerging Opportunities in Veterinary Molecular Diagnostics Industry
Emerging opportunities lie in the development of point-of-care diagnostics, rapid diagnostic tests for emerging infectious diseases, and the integration of AI and machine learning for improved data analysis and diagnostic accuracy. Untapped markets in developing countries offer significant growth potential. Expanding applications of molecular diagnostics in areas like companion animal genetics and precision medicine present additional opportunities.
Growth Accelerators in the Veterinary Molecular Diagnostics Industry Industry
Technological breakthroughs in NGS and CRISPR technologies are accelerating market growth. Strategic partnerships between diagnostic companies and veterinary clinics or research institutions expand market reach and enhance service offerings. Market expansion strategies focusing on emerging economies and untapped markets will further drive growth.
Key Players Shaping the Veterinary Molecular Diagnostics Industry Market
- Bioneer Corporation
- Biomedica Group
- Novacyt Group
- Biochek BV
- Biomerieux SA
- Veterinary Molecular Diagnostics Inc
- Virbac
- QIAGEN N V
- Thermo Fischer Scientific Inc
- Idexx Laboratories Inc
- Ingenetix GmbH
- Neogen Corporation
Notable Milestones in Veterinary Molecular Diagnostics Industry Sector
- June 2022: R-Biopharm AG acquired AusDiagnostics, expanding its molecular diagnostics portfolio.
- May 2022: MSD Animal Health launched the DNA TRACEBACK Fisheries platform for sustainable fishing management.
In-Depth Veterinary Molecular Diagnostics Industry Market Outlook
The veterinary molecular diagnostics market is poised for significant growth over the next decade, driven by technological advancements, increasing disease prevalence, and rising demand for accurate and timely diagnostics. Strategic investments in R&D, strategic partnerships, and expansion into emerging markets will be crucial for companies to capitalize on this growth potential. The focus will shift towards personalized medicine and point-of-care diagnostics, creating new opportunities for innovation and market expansion.
Veterinary Molecular Diagnostics Industry Segmentation
-
1. Product
- 1.1. Instruments
- 1.2. Kit and Reagents
- 1.3. Software and Services
-
2. Application
- 2.1. Infectious Diseases
- 2.2. Genetics
- 2.3. Other Applications
-
3. Technology
- 3.1. PCR
- 3.2. Microarray
- 3.3. DNA Sequencing
Veterinary Molecular Diagnostics Industry Segmentation By Geography
-
1. North America
- 1.1. United States
- 1.2. Canada
- 1.3. Mexico
-
2. Europe
- 2.1. Germany
- 2.2. United Kingdom
- 2.3. France
- 2.4. Italy
- 2.5. Spain
- 2.6. Rest of Europe
-
3. Asia Pacific
- 3.1. China
- 3.2. Japan
- 3.3. India
- 3.4. Australia
- 3.5. South Korea
- 3.6. Rest of Asia Pacific
-
4. Middle East and Africa
- 4.1. GCC
- 4.2. South Africa
- 4.3. Rest of Middle East and Africa
-
5. South America
- 5.1. Brazil
- 5.2. Argentina
- 5.3. Rest of South America
Veterinary Molecular Diagnostics Industry REPORT HIGHLIGHTS
| Aspects | Details |
|---|---|
| Study Period | 2019-2033 |
| Base Year | 2024 |
| Estimated Year | 2025 |
| Forecast Period | 2025-2033 |
| Historical Period | 2019-2024 |
| Growth Rate | CAGR of 9.72% from 2019-2033 |
| Segmentation |
|
Table of Contents
- 1. Introduction
- 1.1. Research Scope
- 1.2. Market Segmentation
- 1.3. Research Methodology
- 1.4. Definitions and Assumptions
- 2. Executive Summary
- 2.1. Introduction
- 3. Market Dynamics
- 3.1. Introduction
- 3.2. Market Drivers
- 3.2.1. Rise in Prevalence of Animal Diseases; Increase in Demand for Animal-derived Proteins; Growth in Animal Health Expenditure
- 3.3. Market Restrains
- 3.3.1. Lack of Skilled Personnel; High Cost of Diagnostic Tests
- 3.4. Market Trends
- 3.4.1. The Instruments Segment is Expected to Register Robust Growth
- 4. Market Factor Analysis
- 4.1. Porters Five Forces
- 4.2. Supply/Value Chain
- 4.3. PESTEL analysis
- 4.4. Market Entropy
- 4.5. Patent/Trademark Analysis
- 5. Global Veterinary Molecular Diagnostics Industry Analysis, Insights and Forecast, 2019-2031
- 5.1. Market Analysis, Insights and Forecast - by Product
- 5.1.1. Instruments
- 5.1.2. Kit and Reagents
- 5.1.3. Software and Services
- 5.2. Market Analysis, Insights and Forecast - by Application
- 5.2.1. Infectious Diseases
- 5.2.2. Genetics
- 5.2.3. Other Applications
- 5.3. Market Analysis, Insights and Forecast - by Technology
- 5.3.1. PCR
- 5.3.2. Microarray
- 5.3.3. DNA Sequencing
- 5.4. Market Analysis, Insights and Forecast - by Region
- 5.4.1. North America
- 5.4.2. Europe
- 5.4.3. Asia Pacific
- 5.4.4. Middle East and Africa
- 5.4.5. South America
- 5.1. Market Analysis, Insights and Forecast - by Product
- 6. North America Veterinary Molecular Diagnostics Industry Analysis, Insights and Forecast, 2019-2031
- 6.1. Market Analysis, Insights and Forecast - by Product
- 6.1.1. Instruments
- 6.1.2. Kit and Reagents
- 6.1.3. Software and Services
- 6.2. Market Analysis, Insights and Forecast - by Application
- 6.2.1. Infectious Diseases
- 6.2.2. Genetics
- 6.2.3. Other Applications
- 6.3. Market Analysis, Insights and Forecast - by Technology
- 6.3.1. PCR
- 6.3.2. Microarray
- 6.3.3. DNA Sequencing
- 6.1. Market Analysis, Insights and Forecast - by Product
- 7. Europe Veterinary Molecular Diagnostics Industry Analysis, Insights and Forecast, 2019-2031
- 7.1. Market Analysis, Insights and Forecast - by Product
- 7.1.1. Instruments
- 7.1.2. Kit and Reagents
- 7.1.3. Software and Services
- 7.2. Market Analysis, Insights and Forecast - by Application
- 7.2.1. Infectious Diseases
- 7.2.2. Genetics
- 7.2.3. Other Applications
- 7.3. Market Analysis, Insights and Forecast - by Technology
- 7.3.1. PCR
- 7.3.2. Microarray
- 7.3.3. DNA Sequencing
- 7.1. Market Analysis, Insights and Forecast - by Product
- 8. Asia Pacific Veterinary Molecular Diagnostics Industry Analysis, Insights and Forecast, 2019-2031
- 8.1. Market Analysis, Insights and Forecast - by Product
- 8.1.1. Instruments
- 8.1.2. Kit and Reagents
- 8.1.3. Software and Services
- 8.2. Market Analysis, Insights and Forecast - by Application
- 8.2.1. Infectious Diseases
- 8.2.2. Genetics
- 8.2.3. Other Applications
- 8.3. Market Analysis, Insights and Forecast - by Technology
- 8.3.1. PCR
- 8.3.2. Microarray
- 8.3.3. DNA Sequencing
- 8.1. Market Analysis, Insights and Forecast - by Product
- 9. Middle East and Africa Veterinary Molecular Diagnostics Industry Analysis, Insights and Forecast, 2019-2031
- 9.1. Market Analysis, Insights and Forecast - by Product
- 9.1.1. Instruments
- 9.1.2. Kit and Reagents
- 9.1.3. Software and Services
- 9.2. Market Analysis, Insights and Forecast - by Application
- 9.2.1. Infectious Diseases
- 9.2.2. Genetics
- 9.2.3. Other Applications
- 9.3. Market Analysis, Insights and Forecast - by Technology
- 9.3.1. PCR
- 9.3.2. Microarray
- 9.3.3. DNA Sequencing
- 9.1. Market Analysis, Insights and Forecast - by Product
- 10. South America Veterinary Molecular Diagnostics Industry Analysis, Insights and Forecast, 2019-2031
- 10.1. Market Analysis, Insights and Forecast - by Product
- 10.1.1. Instruments
- 10.1.2. Kit and Reagents
- 10.1.3. Software and Services
- 10.2. Market Analysis, Insights and Forecast - by Application
- 10.2.1. Infectious Diseases
- 10.2.2. Genetics
- 10.2.3. Other Applications
- 10.3. Market Analysis, Insights and Forecast - by Technology
- 10.3.1. PCR
- 10.3.2. Microarray
- 10.3.3. DNA Sequencing
- 10.1. Market Analysis, Insights and Forecast - by Product
- 11. North America Veterinary Molecular Diagnostics Industry Analysis, Insights and Forecast, 2019-2031
- 11.1. Market Analysis, Insights and Forecast - By Country/Sub-region
- 11.1.1 United States
- 11.1.2 Canada
- 11.1.3 Mexico
- 12. Europe Veterinary Molecular Diagnostics Industry Analysis, Insights and Forecast, 2019-2031
- 12.1. Market Analysis, Insights and Forecast - By Country/Sub-region
- 12.1.1 Germany
- 12.1.2 United Kingdom
- 12.1.3 France
- 12.1.4 Italy
- 12.1.5 Spain
- 12.1.6 Rest of Europe
- 13. Asia Pacific Veterinary Molecular Diagnostics Industry Analysis, Insights and Forecast, 2019-2031
- 13.1. Market Analysis, Insights and Forecast - By Country/Sub-region
- 13.1.1 China
- 13.1.2 Japan
- 13.1.3 India
- 13.1.4 Australia
- 13.1.5 South Korea
- 13.1.6 Rest of Asia Pacific
- 14. Middle East and Africa Veterinary Molecular Diagnostics Industry Analysis, Insights and Forecast, 2019-2031
- 14.1. Market Analysis, Insights and Forecast - By Country/Sub-region
- 14.1.1 GCC
- 14.1.2 South Africa
- 14.1.3 Rest of Middle East and Africa
- 15. South America Veterinary Molecular Diagnostics Industry Analysis, Insights and Forecast, 2019-2031
- 15.1. Market Analysis, Insights and Forecast - By Country/Sub-region
- 15.1.1 Brazil
- 15.1.2 Argentina
- 15.1.3 Rest of South America
- 16. Competitive Analysis
- 16.1. Global Market Share Analysis 2024
- 16.2. Company Profiles
- 16.2.1 Bioneer Corporation
- 16.2.1.1. Overview
- 16.2.1.2. Products
- 16.2.1.3. SWOT Analysis
- 16.2.1.4. Recent Developments
- 16.2.1.5. Financials (Based on Availability)
- 16.2.2 Biomedica Group
- 16.2.2.1. Overview
- 16.2.2.2. Products
- 16.2.2.3. SWOT Analysis
- 16.2.2.4. Recent Developments
- 16.2.2.5. Financials (Based on Availability)
- 16.2.3 Novacyt Group
- 16.2.3.1. Overview
- 16.2.3.2. Products
- 16.2.3.3. SWOT Analysis
- 16.2.3.4. Recent Developments
- 16.2.3.5. Financials (Based on Availability)
- 16.2.4 Biochek BV
- 16.2.4.1. Overview
- 16.2.4.2. Products
- 16.2.4.3. SWOT Analysis
- 16.2.4.4. Recent Developments
- 16.2.4.5. Financials (Based on Availability)
- 16.2.5 Biomerieux SA
- 16.2.5.1. Overview
- 16.2.5.2. Products
- 16.2.5.3. SWOT Analysis
- 16.2.5.4. Recent Developments
- 16.2.5.5. Financials (Based on Availability)
- 16.2.6 Veterinary Molecular Diagnostics Inc
- 16.2.6.1. Overview
- 16.2.6.2. Products
- 16.2.6.3. SWOT Analysis
- 16.2.6.4. Recent Developments
- 16.2.6.5. Financials (Based on Availability)
- 16.2.7 Virbac*List Not Exhaustive
- 16.2.7.1. Overview
- 16.2.7.2. Products
- 16.2.7.3. SWOT Analysis
- 16.2.7.4. Recent Developments
- 16.2.7.5. Financials (Based on Availability)
- 16.2.8 QIAGEN N V
- 16.2.8.1. Overview
- 16.2.8.2. Products
- 16.2.8.3. SWOT Analysis
- 16.2.8.4. Recent Developments
- 16.2.8.5. Financials (Based on Availability)
- 16.2.9 Thermo Fischer Scientific Inc
- 16.2.9.1. Overview
- 16.2.9.2. Products
- 16.2.9.3. SWOT Analysis
- 16.2.9.4. Recent Developments
- 16.2.9.5. Financials (Based on Availability)
- 16.2.10 Idexx Laboratories Inc
- 16.2.10.1. Overview
- 16.2.10.2. Products
- 16.2.10.3. SWOT Analysis
- 16.2.10.4. Recent Developments
- 16.2.10.5. Financials (Based on Availability)
- 16.2.11 Ingenetix GmbH
- 16.2.11.1. Overview
- 16.2.11.2. Products
- 16.2.11.3. SWOT Analysis
- 16.2.11.4. Recent Developments
- 16.2.11.5. Financials (Based on Availability)
- 16.2.12 Neogen Corporation
- 16.2.12.1. Overview
- 16.2.12.2. Products
- 16.2.12.3. SWOT Analysis
- 16.2.12.4. Recent Developments
- 16.2.12.5. Financials (Based on Availability)
- 16.2.1 Bioneer Corporation
List of Figures
- Figure 1: Global Veterinary Molecular Diagnostics Industry Revenue Breakdown (Million, %) by Region 2024 & 2032
- Figure 2: North America Veterinary Molecular Diagnostics Industry Revenue (Million), by Country 2024 & 2032
- Figure 3: North America Veterinary Molecular Diagnostics Industry Revenue Share (%), by Country 2024 & 2032
- Figure 4: Europe Veterinary Molecular Diagnostics Industry Revenue (Million), by Country 2024 & 2032
- Figure 5: Europe Veterinary Molecular Diagnostics Industry Revenue Share (%), by Country 2024 & 2032
- Figure 6: Asia Pacific Veterinary Molecular Diagnostics Industry Revenue (Million), by Country 2024 & 2032
- Figure 7: Asia Pacific Veterinary Molecular Diagnostics Industry Revenue Share (%), by Country 2024 & 2032
- Figure 8: Middle East and Africa Veterinary Molecular Diagnostics Industry Revenue (Million), by Country 2024 & 2032
- Figure 9: Middle East and Africa Veterinary Molecular Diagnostics Industry Revenue Share (%), by Country 2024 & 2032
- Figure 10: South America Veterinary Molecular Diagnostics Industry Revenue (Million), by Country 2024 & 2032
- Figure 11: South America Veterinary Molecular Diagnostics Industry Revenue Share (%), by Country 2024 & 2032
- Figure 12: North America Veterinary Molecular Diagnostics Industry Revenue (Million), by Product 2024 & 2032
- Figure 13: North America Veterinary Molecular Diagnostics Industry Revenue Share (%), by Product 2024 & 2032
- Figure 14: North America Veterinary Molecular Diagnostics Industry Revenue (Million), by Application 2024 & 2032
- Figure 15: North America Veterinary Molecular Diagnostics Industry Revenue Share (%), by Application 2024 & 2032
- Figure 16: North America Veterinary Molecular Diagnostics Industry Revenue (Million), by Technology 2024 & 2032
- Figure 17: North America Veterinary Molecular Diagnostics Industry Revenue Share (%), by Technology 2024 & 2032
- Figure 18: North America Veterinary Molecular Diagnostics Industry Revenue (Million), by Country 2024 & 2032
- Figure 19: North America Veterinary Molecular Diagnostics Industry Revenue Share (%), by Country 2024 & 2032
- Figure 20: Europe Veterinary Molecular Diagnostics Industry Revenue (Million), by Product 2024 & 2032
- Figure 21: Europe Veterinary Molecular Diagnostics Industry Revenue Share (%), by Product 2024 & 2032
- Figure 22: Europe Veterinary Molecular Diagnostics Industry Revenue (Million), by Application 2024 & 2032
- Figure 23: Europe Veterinary Molecular Diagnostics Industry Revenue Share (%), by Application 2024 & 2032
- Figure 24: Europe Veterinary Molecular Diagnostics Industry Revenue (Million), by Technology 2024 & 2032
- Figure 25: Europe Veterinary Molecular Diagnostics Industry Revenue Share (%), by Technology 2024 & 2032
- Figure 26: Europe Veterinary Molecular Diagnostics Industry Revenue (Million), by Country 2024 & 2032
- Figure 27: Europe Veterinary Molecular Diagnostics Industry Revenue Share (%), by Country 2024 & 2032
- Figure 28: Asia Pacific Veterinary Molecular Diagnostics Industry Revenue (Million), by Product 2024 & 2032
- Figure 29: Asia Pacific Veterinary Molecular Diagnostics Industry Revenue Share (%), by Product 2024 & 2032
- Figure 30: Asia Pacific Veterinary Molecular Diagnostics Industry Revenue (Million), by Application 2024 & 2032
- Figure 31: Asia Pacific Veterinary Molecular Diagnostics Industry Revenue Share (%), by Application 2024 & 2032
- Figure 32: Asia Pacific Veterinary Molecular Diagnostics Industry Revenue (Million), by Technology 2024 & 2032
- Figure 33: Asia Pacific Veterinary Molecular Diagnostics Industry Revenue Share (%), by Technology 2024 & 2032
- Figure 34: Asia Pacific Veterinary Molecular Diagnostics Industry Revenue (Million), by Country 2024 & 2032
- Figure 35: Asia Pacific Veterinary Molecular Diagnostics Industry Revenue Share (%), by Country 2024 & 2032
- Figure 36: Middle East and Africa Veterinary Molecular Diagnostics Industry Revenue (Million), by Product 2024 & 2032
- Figure 37: Middle East and Africa Veterinary Molecular Diagnostics Industry Revenue Share (%), by Product 2024 & 2032
- Figure 38: Middle East and Africa Veterinary Molecular Diagnostics Industry Revenue (Million), by Application 2024 & 2032
- Figure 39: Middle East and Africa Veterinary Molecular Diagnostics Industry Revenue Share (%), by Application 2024 & 2032
- Figure 40: Middle East and Africa Veterinary Molecular Diagnostics Industry Revenue (Million), by Technology 2024 & 2032
- Figure 41: Middle East and Africa Veterinary Molecular Diagnostics Industry Revenue Share (%), by Technology 2024 & 2032
- Figure 42: Middle East and Africa Veterinary Molecular Diagnostics Industry Revenue (Million), by Country 2024 & 2032
- Figure 43: Middle East and Africa Veterinary Molecular Diagnostics Industry Revenue Share (%), by Country 2024 & 2032
- Figure 44: South America Veterinary Molecular Diagnostics Industry Revenue (Million), by Product 2024 & 2032
- Figure 45: South America Veterinary Molecular Diagnostics Industry Revenue Share (%), by Product 2024 & 2032
- Figure 46: South America Veterinary Molecular Diagnostics Industry Revenue (Million), by Application 2024 & 2032
- Figure 47: South America Veterinary Molecular Diagnostics Industry Revenue Share (%), by Application 2024 & 2032
- Figure 48: South America Veterinary Molecular Diagnostics Industry Revenue (Million), by Technology 2024 & 2032
- Figure 49: South America Veterinary Molecular Diagnostics Industry Revenue Share (%), by Technology 2024 & 2032
- Figure 50: South America Veterinary Molecular Diagnostics Industry Revenue (Million), by Country 2024 & 2032
- Figure 51: South America Veterinary Molecular Diagnostics Industry Revenue Share (%), by Country 2024 & 2032
List of Tables
- Table 1: Global Veterinary Molecular Diagnostics Industry Revenue Million Forecast, by Region 2019 & 2032
- Table 2: Global Veterinary Molecular Diagnostics Industry Revenue Million Forecast, by Product 2019 & 2032
- Table 3: Global Veterinary Molecular Diagnostics Industry Revenue Million Forecast, by Application 2019 & 2032
- Table 4: Global Veterinary Molecular Diagnostics Industry Revenue Million Forecast, by Technology 2019 & 2032
- Table 5: Global Veterinary Molecular Diagnostics Industry Revenue Million Forecast, by Region 2019 & 2032
- Table 6: Global Veterinary Molecular Diagnostics Industry Revenue Million Forecast, by Country 2019 & 2032
- Table 7: United States Veterinary Molecular Diagnostics Industry Revenue (Million) Forecast, by Application 2019 & 2032
- Table 8: Canada Veterinary Molecular Diagnostics Industry Revenue (Million) Forecast, by Application 2019 & 2032
- Table 9: Mexico Veterinary Molecular Diagnostics Industry Revenue (Million) Forecast, by Application 2019 & 2032
- Table 10: Global Veterinary Molecular Diagnostics Industry Revenue Million Forecast, by Country 2019 & 2032
- Table 11: Germany Veterinary Molecular Diagnostics Industry Revenue (Million) Forecast, by Application 2019 & 2032
- Table 12: United Kingdom Veterinary Molecular Diagnostics Industry Revenue (Million) Forecast, by Application 2019 & 2032
- Table 13: France Veterinary Molecular Diagnostics Industry Revenue (Million) Forecast, by Application 2019 & 2032
- Table 14: Italy Veterinary Molecular Diagnostics Industry Revenue (Million) Forecast, by Application 2019 & 2032
- Table 15: Spain Veterinary Molecular Diagnostics Industry Revenue (Million) Forecast, by Application 2019 & 2032
- Table 16: Rest of Europe Veterinary Molecular Diagnostics Industry Revenue (Million) Forecast, by Application 2019 & 2032
- Table 17: Global Veterinary Molecular Diagnostics Industry Revenue Million Forecast, by Country 2019 & 2032
- Table 18: China Veterinary Molecular Diagnostics Industry Revenue (Million) Forecast, by Application 2019 & 2032
- Table 19: Japan Veterinary Molecular Diagnostics Industry Revenue (Million) Forecast, by Application 2019 & 2032
- Table 20: India Veterinary Molecular Diagnostics Industry Revenue (Million) Forecast, by Application 2019 & 2032
- Table 21: Australia Veterinary Molecular Diagnostics Industry Revenue (Million) Forecast, by Application 2019 & 2032
- Table 22: South Korea Veterinary Molecular Diagnostics Industry Revenue (Million) Forecast, by Application 2019 & 2032
- Table 23: Rest of Asia Pacific Veterinary Molecular Diagnostics Industry Revenue (Million) Forecast, by Application 2019 & 2032
- Table 24: Global Veterinary Molecular Diagnostics Industry Revenue Million Forecast, by Country 2019 & 2032
- Table 25: GCC Veterinary Molecular Diagnostics Industry Revenue (Million) Forecast, by Application 2019 & 2032
- Table 26: South Africa Veterinary Molecular Diagnostics Industry Revenue (Million) Forecast, by Application 2019 & 2032
- Table 27: Rest of Middle East and Africa Veterinary Molecular Diagnostics Industry Revenue (Million) Forecast, by Application 2019 & 2032
- Table 28: Global Veterinary Molecular Diagnostics Industry Revenue Million Forecast, by Country 2019 & 2032
- Table 29: Brazil Veterinary Molecular Diagnostics Industry Revenue (Million) Forecast, by Application 2019 & 2032
- Table 30: Argentina Veterinary Molecular Diagnostics Industry Revenue (Million) Forecast, by Application 2019 & 2032
- Table 31: Rest of South America Veterinary Molecular Diagnostics Industry Revenue (Million) Forecast, by Application 2019 & 2032
- Table 32: Global Veterinary Molecular Diagnostics Industry Revenue Million Forecast, by Product 2019 & 2032
- Table 33: Global Veterinary Molecular Diagnostics Industry Revenue Million Forecast, by Application 2019 & 2032
- Table 34: Global Veterinary Molecular Diagnostics Industry Revenue Million Forecast, by Technology 2019 & 2032
- Table 35: Global Veterinary Molecular Diagnostics Industry Revenue Million Forecast, by Country 2019 & 2032
- Table 36: United States Veterinary Molecular Diagnostics Industry Revenue (Million) Forecast, by Application 2019 & 2032
- Table 37: Canada Veterinary Molecular Diagnostics Industry Revenue (Million) Forecast, by Application 2019 & 2032
- Table 38: Mexico Veterinary Molecular Diagnostics Industry Revenue (Million) Forecast, by Application 2019 & 2032
- Table 39: Global Veterinary Molecular Diagnostics Industry Revenue Million Forecast, by Product 2019 & 2032
- Table 40: Global Veterinary Molecular Diagnostics Industry Revenue Million Forecast, by Application 2019 & 2032
- Table 41: Global Veterinary Molecular Diagnostics Industry Revenue Million Forecast, by Technology 2019 & 2032
- Table 42: Global Veterinary Molecular Diagnostics Industry Revenue Million Forecast, by Country 2019 & 2032
- Table 43: Germany Veterinary Molecular Diagnostics Industry Revenue (Million) Forecast, by Application 2019 & 2032
- Table 44: United Kingdom Veterinary Molecular Diagnostics Industry Revenue (Million) Forecast, by Application 2019 & 2032
- Table 45: France Veterinary Molecular Diagnostics Industry Revenue (Million) Forecast, by Application 2019 & 2032
- Table 46: Italy Veterinary Molecular Diagnostics Industry Revenue (Million) Forecast, by Application 2019 & 2032
- Table 47: Spain Veterinary Molecular Diagnostics Industry Revenue (Million) Forecast, by Application 2019 & 2032
- Table 48: Rest of Europe Veterinary Molecular Diagnostics Industry Revenue (Million) Forecast, by Application 2019 & 2032
- Table 49: Global Veterinary Molecular Diagnostics Industry Revenue Million Forecast, by Product 2019 & 2032
- Table 50: Global Veterinary Molecular Diagnostics Industry Revenue Million Forecast, by Application 2019 & 2032
- Table 51: Global Veterinary Molecular Diagnostics Industry Revenue Million Forecast, by Technology 2019 & 2032
- Table 52: Global Veterinary Molecular Diagnostics Industry Revenue Million Forecast, by Country 2019 & 2032
- Table 53: China Veterinary Molecular Diagnostics Industry Revenue (Million) Forecast, by Application 2019 & 2032
- Table 54: Japan Veterinary Molecular Diagnostics Industry Revenue (Million) Forecast, by Application 2019 & 2032
- Table 55: India Veterinary Molecular Diagnostics Industry Revenue (Million) Forecast, by Application 2019 & 2032
- Table 56: Australia Veterinary Molecular Diagnostics Industry Revenue (Million) Forecast, by Application 2019 & 2032
- Table 57: South Korea Veterinary Molecular Diagnostics Industry Revenue (Million) Forecast, by Application 2019 & 2032
- Table 58: Rest of Asia Pacific Veterinary Molecular Diagnostics Industry Revenue (Million) Forecast, by Application 2019 & 2032
- Table 59: Global Veterinary Molecular Diagnostics Industry Revenue Million Forecast, by Product 2019 & 2032
- Table 60: Global Veterinary Molecular Diagnostics Industry Revenue Million Forecast, by Application 2019 & 2032
- Table 61: Global Veterinary Molecular Diagnostics Industry Revenue Million Forecast, by Technology 2019 & 2032
- Table 62: Global Veterinary Molecular Diagnostics Industry Revenue Million Forecast, by Country 2019 & 2032
- Table 63: GCC Veterinary Molecular Diagnostics Industry Revenue (Million) Forecast, by Application 2019 & 2032
- Table 64: South Africa Veterinary Molecular Diagnostics Industry Revenue (Million) Forecast, by Application 2019 & 2032
- Table 65: Rest of Middle East and Africa Veterinary Molecular Diagnostics Industry Revenue (Million) Forecast, by Application 2019 & 2032
- Table 66: Global Veterinary Molecular Diagnostics Industry Revenue Million Forecast, by Product 2019 & 2032
- Table 67: Global Veterinary Molecular Diagnostics Industry Revenue Million Forecast, by Application 2019 & 2032
- Table 68: Global Veterinary Molecular Diagnostics Industry Revenue Million Forecast, by Technology 2019 & 2032
- Table 69: Global Veterinary Molecular Diagnostics Industry Revenue Million Forecast, by Country 2019 & 2032
- Table 70: Brazil Veterinary Molecular Diagnostics Industry Revenue (Million) Forecast, by Application 2019 & 2032
- Table 71: Argentina Veterinary Molecular Diagnostics Industry Revenue (Million) Forecast, by Application 2019 & 2032
- Table 72: Rest of South America Veterinary Molecular Diagnostics Industry Revenue (Million) Forecast, by Application 2019 & 2032
Frequently Asked Questions
1. What is the projected Compound Annual Growth Rate (CAGR) of the Veterinary Molecular Diagnostics Industry?
The projected CAGR is approximately 9.72%.
2. Which companies are prominent players in the Veterinary Molecular Diagnostics Industry?
Key companies in the market include Bioneer Corporation, Biomedica Group, Novacyt Group, Biochek BV, Biomerieux SA, Veterinary Molecular Diagnostics Inc, Virbac*List Not Exhaustive, QIAGEN N V, Thermo Fischer Scientific Inc, Idexx Laboratories Inc, Ingenetix GmbH, Neogen Corporation.
3. What are the main segments of the Veterinary Molecular Diagnostics Industry?
The market segments include Product, Application, Technology.
4. Can you provide details about the market size?
The market size is estimated to be USD 0.65 Million as of 2022.
5. What are some drivers contributing to market growth?
Rise in Prevalence of Animal Diseases; Increase in Demand for Animal-derived Proteins; Growth in Animal Health Expenditure.
6. What are the notable trends driving market growth?
The Instruments Segment is Expected to Register Robust Growth.
7. Are there any restraints impacting market growth?
Lack of Skilled Personnel; High Cost of Diagnostic Tests.
8. Can you provide examples of recent developments in the market?
In June 2022, R-Biopharm AG acquired AusDiagnostics. With this acquisition, R-Biopharm expanded its product portfolio with molecular biology multiplex diagnostics, extraction reagents, and laboratory automation equipment for animals and humans.
9. What pricing options are available for accessing the report?
Pricing options include single-user, multi-user, and enterprise licenses priced at USD 4750, USD 5250, and USD 8750 respectively.
10. Is the market size provided in terms of value or volume?
The market size is provided in terms of value, measured in Million.
11. Are there any specific market keywords associated with the report?
Yes, the market keyword associated with the report is "Veterinary Molecular Diagnostics Industry," which aids in identifying and referencing the specific market segment covered.
12. How do I determine which pricing option suits my needs best?
The pricing options vary based on user requirements and access needs. Individual users may opt for single-user licenses, while businesses requiring broader access may choose multi-user or enterprise licenses for cost-effective access to the report.
13. Are there any additional resources or data provided in the Veterinary Molecular Diagnostics Industry report?
While the report offers comprehensive insights, it's advisable to review the specific contents or supplementary materials provided to ascertain if additional resources or data are available.
14. How can I stay updated on further developments or reports in the Veterinary Molecular Diagnostics Industry?
To stay informed about further developments, trends, and reports in the Veterinary Molecular Diagnostics Industry, consider subscribing to industry newsletters, following relevant companies and organizations, or regularly checking reputable industry news sources and publications.
Methodology
Step 1 - Identification of Relevant Samples Size from Population Database


Step 2 - Approaches for Defining Global Market Size (Value, Volume* & Price*)

Note*: In applicable scenarios
Step 3 - Data Sources
Primary Research
- Web Analytics
- Survey Reports
- Research Institute
- Latest Research Reports
- Opinion Leaders
Secondary Research
- Annual Reports
- White Paper
- Latest Press Release
- Industry Association
- Paid Database
- Investor Presentations

Step 4 - Data Triangulation
Involves using different sources of information in order to increase the validity of a study
These sources are likely to be stakeholders in a program - participants, other researchers, program staff, other community members, and so on.
Then we put all data in single framework & apply various statistical tools to find out the dynamic on the market.
During the analysis stage, feedback from the stakeholder groups would be compared to determine areas of agreement as well as areas of divergence


