
Key Insights
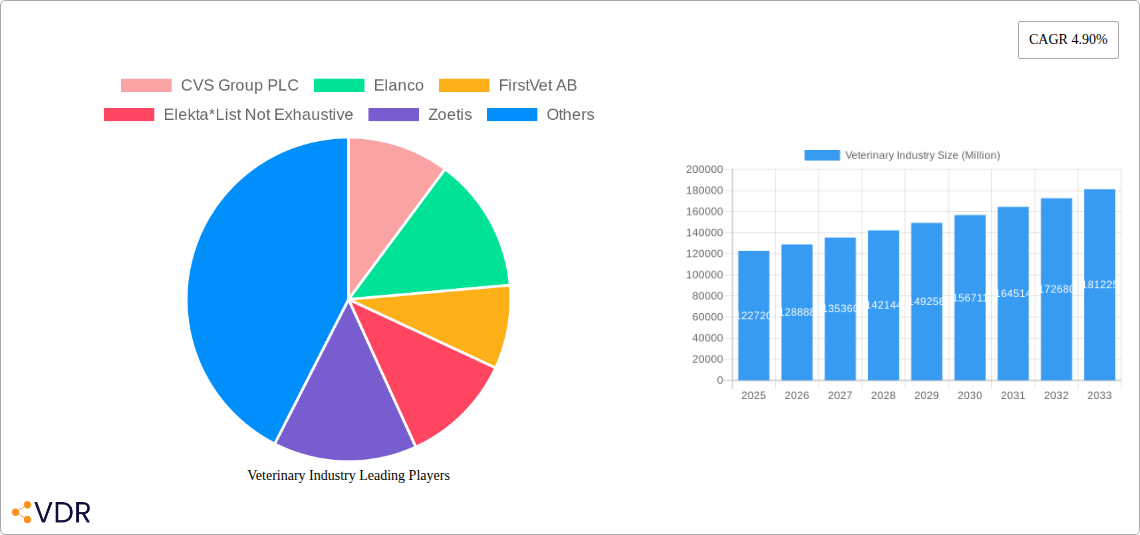
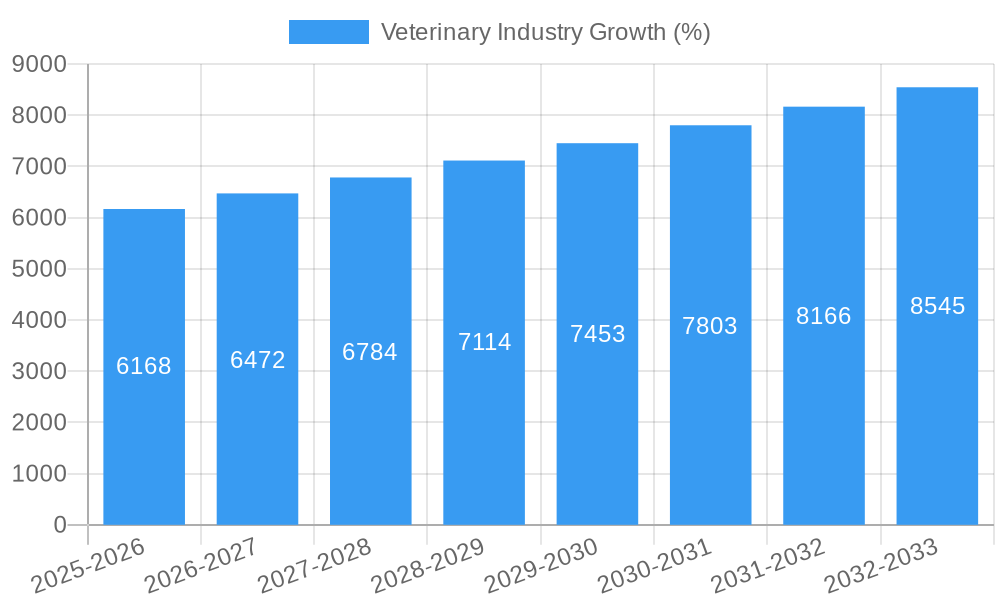
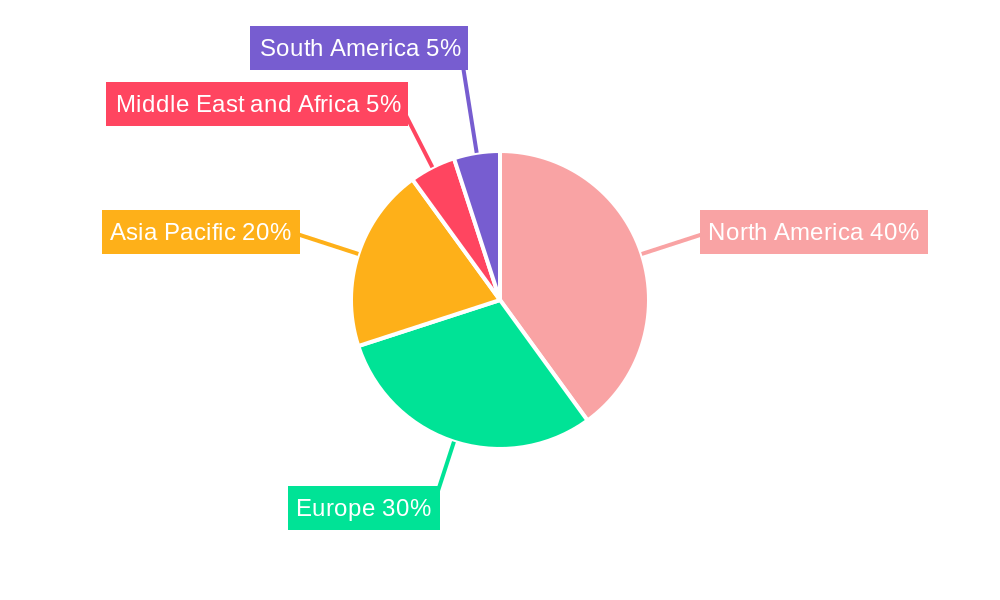
The global veterinary industry, valued at $122.72 billion in 2025, is experiencing robust growth, projected to expand at a compound annual growth rate (CAGR) of 4.90% from 2025 to 2033. This expansion is driven by several key factors. Increasing pet ownership globally, particularly in developing economies with a rising middle class, fuels demand for veterinary services. The humanization of pets, leading to increased spending on pet healthcare, is another significant driver. Furthermore, advancements in veterinary diagnostics and treatment, including minimally invasive surgeries, sophisticated imaging technologies, and personalized medicine approaches, contribute to market growth. The rising prevalence of chronic diseases in animals and the increasing adoption of pet insurance further stimulate demand. The industry is segmented by service type (surgery, diagnostic tests and imaging, physical health monitoring, and other services) and animal type (companion animals and farm animals), with companion animals currently dominating the market. North America and Europe currently hold significant market shares due to high pet ownership rates and well-established veterinary infrastructure, but the Asia-Pacific region is anticipated to witness substantial growth due to rapid economic development and changing pet ownership patterns.
Competition within the veterinary industry is intense, with a mix of large multinational corporations and smaller, specialized practices. Key players include Zoetis, IDEXX Laboratories, and Mars Petcare, along with numerous regional and independent clinics. However, the industry faces challenges, including rising operating costs, labor shortages, and the need for continued investment in advanced technologies to remain competitive. Regulatory changes and increasing pressure to control costs also impact market dynamics. Despite these challenges, the long-term outlook for the veterinary industry remains positive, driven by continued growth in pet ownership and advancements in veterinary medicine. The industry is poised for further consolidation and innovation, particularly in areas such as telemedicine and preventative care. Strategic partnerships and acquisitions will likely play a crucial role in shaping the industry's future landscape.
Veterinary Industry Market Report: 2019-2033
This comprehensive report provides a detailed analysis of the global veterinary industry, encompassing market dynamics, growth trends, key players, and future opportunities. With a study period spanning 2019-2033, a base year of 2025, and a forecast period of 2025-2033, this report is an invaluable resource for industry professionals, investors, and strategic decision-makers. The market is segmented by service (Surgery, Diagnostic Tests and Imaging, Physical Health Monitoring, Other Services) and animal type (Companion Animal, Farm Animal), offering granular insights into specific market niches. The report projects a market value reaching xx Million by 2033.
Veterinary Industry Market Dynamics & Structure
The global veterinary industry is experiencing robust growth, driven by factors such as increasing pet ownership, rising pet healthcare expenditure, technological advancements, and expanding regulatory frameworks. Market concentration is moderate, with a few large multinational corporations alongside numerous smaller, specialized players. The industry witnesses significant M&A activity, with larger companies strategically acquiring smaller firms to expand their service offerings and geographic reach. Technological innovation, particularly in diagnostics and therapeutics, is a key driver, though high R&D costs and regulatory hurdles present challenges. The increasing demand for specialized veterinary services, such as surgery and advanced diagnostic imaging, further fuels market expansion. Competitive product substitutes are limited, as animal health products often require specialized formulations and approvals.
- Market Concentration: Moderately concentrated, with top 5 players holding approximately xx% market share in 2024.
- M&A Activity: An average of xx deals annually over the historical period (2019-2024), valued at approximately xx Million.
- Technological Innovation: Key drivers include advancements in diagnostics (e.g., point-of-care testing, AI-powered imaging), therapeutics (e.g., novel biologics, personalized medicine), and digital health solutions (e.g., telehealth, remote monitoring).
- Regulatory Landscape: Stringent regulations regarding drug approvals and veterinary practices vary across geographies, influencing market entry and competition.
- End-User Demographics: Shifting demographics, including increasing pet ownership rates, particularly among millennials, and an aging pet population, contribute significantly to market demand.
Veterinary Industry Growth Trends & Insights
The veterinary industry demonstrates a consistent growth trajectory, driven by several interconnected factors. The market size experienced significant growth from xx Million in 2019 to xx Million in 2024, reflecting an impressive CAGR of xx%. This expansion is fueled by factors such as increasing pet humanization, rising disposable incomes in emerging economies, and the increasing adoption of companion animals globally. Technological advancements, particularly in diagnostic imaging and minimally invasive surgical techniques, have enhanced treatment options and overall animal health outcomes, further boosting market growth. The adoption rate of advanced diagnostic tests is witnessing exponential growth, exceeding xx% in many developed regions. Shifting consumer preferences toward premium pet care products and services contribute to higher spending per pet, driving industry revenue.
Dominant Regions, Countries, or Segments in Veterinary Industry
The North American and European regions currently dominate the global veterinary market, accounting for approximately xx% and xx% of the market share, respectively. Within these regions, the companion animal segment commands the largest share, driven by high pet ownership rates and increased expenditure on pet healthcare. The rapid growth of the companion animal market is fueled by rising pet humanization, increasing disposable incomes, and growing awareness of pet health concerns. In contrast, the farm animal segment shows significant growth potential in developing economies, driven by increasing livestock production and the implementation of improved animal husbandry practices.
- North America (US and Canada): High pet ownership rates, advanced veterinary infrastructure, and high per-capita healthcare expenditure contribute to its dominance.
- Europe (Western Europe): Similar to North America, but with a greater emphasis on specialized veterinary services.
- Asia-Pacific (particularly China and India): Rapidly expanding market due to increasing pet ownership, growing middle class, and improved veterinary infrastructure.
- Dominant Service Segment: Diagnostic tests and imaging are rapidly expanding, driven by technological innovation.
- Key Drivers: Increasing pet ownership, rising disposable incomes, technological advancements in diagnostics and treatment, and growing awareness of animal welfare.
Veterinary Industry Product Landscape
The veterinary product landscape is dynamic and innovative, with continuous development of advanced diagnostic tools, therapeutic medications, and surgical instruments. Point-of-care diagnostics, minimally invasive surgical techniques, and telemedicine platforms are transforming the delivery of veterinary care. Unique selling propositions often revolve around improved diagnostic accuracy, enhanced treatment efficacy, reduced invasiveness, and cost-effectiveness. Technological advancements, driven by AI, machine learning, and big data analytics, are leading to personalized medicine solutions for animals, further improving treatment outcomes.
Key Drivers, Barriers & Challenges in Veterinary Industry
Key Drivers: Rising pet ownership and expenditure on pet health, technological advancements in diagnostics and therapeutics, increasing demand for specialized services, and expanding regulatory frameworks promoting animal welfare.
Challenges: High R&D costs for new drugs and devices, stringent regulatory requirements, price pressure from generic products, and the need for continuous professional development to adapt to technological advancements. Supply chain disruptions can impact the availability of essential medications and equipment, while competitive pressures necessitate ongoing innovation and differentiation. These factors can cumulatively affect market growth by an estimated xx% annually.
Emerging Opportunities in Veterinary Industry
The veterinary industry presents significant opportunities for growth. Untapped markets exist in developing regions, where increasing pet ownership rates and rising disposable incomes are driving demand for veterinary services. Telemedicine, remote monitoring devices, and AI-powered diagnostic tools offer exciting possibilities for improving access to care and enhancing diagnostic accuracy. The development of personalized medicine approaches, tailored to specific animal breeds and health conditions, presents another promising area for innovation.
Growth Accelerators in the Veterinary Industry Industry
Strategic partnerships between veterinary clinics, pharmaceutical companies, and technology providers are driving industry growth. Investments in research and development, leading to new drugs, diagnostic tools, and treatment methods, are creating new opportunities. Expansion into new geographic markets and the integration of digital health solutions are further accelerating market growth.
Key Players Shaping the Veterinary Industry Market
- CVS Group PLC
- Elanco
- FirstVet AB
- Elekta
- Zoetis
- CityVet Inc
- Kremer Veterinary Services
- Ethos Veterinary Health
- Torigen Pharmaceuticals Inc
- Karyopharm Therapeutics Inc
- ELIAS Animal Health
- Greencross Limited
- Armor Animal Health (Animart)
- Mars Inc
- Idexx laboratories
Notable Milestones in Veterinary Industry Sector
- May 2022: Launch of 175 Mobile Ambulatory Veterinary Clinics (MAVCs) in Andhra Pradesh, India, improving accessibility of veterinary services. This initiative is expected to significantly impact the farm animal segment in the region.
- March 2022: Launch of Hacarus Inc.'s ECG platform for early detection of canine cardiac disease, enhancing diagnostic capabilities and treatment options for companion animals. This technological advancement is projected to drive growth in the diagnostic testing segment.
In-Depth Veterinary Industry Market Outlook
The veterinary industry is poised for continued expansion, driven by sustained growth in pet ownership, increasing demand for advanced veterinary services, and the adoption of innovative technologies. Strategic investments in research and development, expansion into emerging markets, and the adoption of effective business models will be critical for long-term success. The market's potential for growth remains significant, with opportunities for both established players and new entrants to capitalize on emerging trends and unmet needs.
Veterinary Industry Segmentation
-
1. Service
- 1.1. Surgery
- 1.2. Diagnostic Tests and Imaging
- 1.3. Physical Health Monitoring
- 1.4. Other Services
-
2. Animal Type
- 2.1. Companion Animal
- 2.2. Farm Animal
Veterinary Industry Segmentation By Geography
-
1. North America
- 1.1. United States
- 1.2. Canada
- 1.3. Mexico
-
2. Europe
- 2.1. Germany
- 2.2. United Kingdom
- 2.3. France
- 2.4. Italy
- 2.5. Spain
- 2.6. Rest of Europe
-
3. Asia Pacific
- 3.1. China
- 3.2. Japan
- 3.3. India
- 3.4. Australia
- 3.5. South Korea
- 3.6. Rest of Asia Pacific
-
4. Middle East and Africa
- 4.1. GCC
- 4.2. South Africa
- 4.3. Rest of Middle East and Africa
-
5. South America
- 5.1. Brazil
- 5.2. Argentina
- 5.3. Rest of South America
Veterinary Industry REPORT HIGHLIGHTS
| Aspects | Details |
|---|---|
| Study Period | 2019-2033 |
| Base Year | 2024 |
| Estimated Year | 2025 |
| Forecast Period | 2025-2033 |
| Historical Period | 2019-2024 |
| Growth Rate | CAGR of 4.90% from 2019-2033 |
| Segmentation |
|
Table of Contents
- 1. Introduction
- 1.1. Research Scope
- 1.2. Market Segmentation
- 1.3. Research Methodology
- 1.4. Definitions and Assumptions
- 2. Executive Summary
- 2.1. Introduction
- 3. Market Dynamics
- 3.1. Introduction
- 3.2. Market Drivers
- 3.2.1. Increasing Prevalence of Various Diseases in Animals; Rising Adoption of Animals; Growing Expenditure on Animals/Pets
- 3.3. Market Restrains
- 3.3.1. Shortage of Skilled Personnel; Increasing Cost of Veterinary Services
- 3.4. Market Trends
- 3.4.1. The Companion Animal Segment is Expected to Dominate the Market
- 4. Market Factor Analysis
- 4.1. Porters Five Forces
- 4.2. Supply/Value Chain
- 4.3. PESTEL analysis
- 4.4. Market Entropy
- 4.5. Patent/Trademark Analysis
- 5. Global Veterinary Industry Analysis, Insights and Forecast, 2019-2031
- 5.1. Market Analysis, Insights and Forecast - by Service
- 5.1.1. Surgery
- 5.1.2. Diagnostic Tests and Imaging
- 5.1.3. Physical Health Monitoring
- 5.1.4. Other Services
- 5.2. Market Analysis, Insights and Forecast - by Animal Type
- 5.2.1. Companion Animal
- 5.2.2. Farm Animal
- 5.3. Market Analysis, Insights and Forecast - by Region
- 5.3.1. North America
- 5.3.2. Europe
- 5.3.3. Asia Pacific
- 5.3.4. Middle East and Africa
- 5.3.5. South America
- 5.1. Market Analysis, Insights and Forecast - by Service
- 6. North America Veterinary Industry Analysis, Insights and Forecast, 2019-2031
- 6.1. Market Analysis, Insights and Forecast - by Service
- 6.1.1. Surgery
- 6.1.2. Diagnostic Tests and Imaging
- 6.1.3. Physical Health Monitoring
- 6.1.4. Other Services
- 6.2. Market Analysis, Insights and Forecast - by Animal Type
- 6.2.1. Companion Animal
- 6.2.2. Farm Animal
- 6.1. Market Analysis, Insights and Forecast - by Service
- 7. Europe Veterinary Industry Analysis, Insights and Forecast, 2019-2031
- 7.1. Market Analysis, Insights and Forecast - by Service
- 7.1.1. Surgery
- 7.1.2. Diagnostic Tests and Imaging
- 7.1.3. Physical Health Monitoring
- 7.1.4. Other Services
- 7.2. Market Analysis, Insights and Forecast - by Animal Type
- 7.2.1. Companion Animal
- 7.2.2. Farm Animal
- 7.1. Market Analysis, Insights and Forecast - by Service
- 8. Asia Pacific Veterinary Industry Analysis, Insights and Forecast, 2019-2031
- 8.1. Market Analysis, Insights and Forecast - by Service
- 8.1.1. Surgery
- 8.1.2. Diagnostic Tests and Imaging
- 8.1.3. Physical Health Monitoring
- 8.1.4. Other Services
- 8.2. Market Analysis, Insights and Forecast - by Animal Type
- 8.2.1. Companion Animal
- 8.2.2. Farm Animal
- 8.1. Market Analysis, Insights and Forecast - by Service
- 9. Middle East and Africa Veterinary Industry Analysis, Insights and Forecast, 2019-2031
- 9.1. Market Analysis, Insights and Forecast - by Service
- 9.1.1. Surgery
- 9.1.2. Diagnostic Tests and Imaging
- 9.1.3. Physical Health Monitoring
- 9.1.4. Other Services
- 9.2. Market Analysis, Insights and Forecast - by Animal Type
- 9.2.1. Companion Animal
- 9.2.2. Farm Animal
- 9.1. Market Analysis, Insights and Forecast - by Service
- 10. South America Veterinary Industry Analysis, Insights and Forecast, 2019-2031
- 10.1. Market Analysis, Insights and Forecast - by Service
- 10.1.1. Surgery
- 10.1.2. Diagnostic Tests and Imaging
- 10.1.3. Physical Health Monitoring
- 10.1.4. Other Services
- 10.2. Market Analysis, Insights and Forecast - by Animal Type
- 10.2.1. Companion Animal
- 10.2.2. Farm Animal
- 10.1. Market Analysis, Insights and Forecast - by Service
- 11. North America Veterinary Industry Analysis, Insights and Forecast, 2019-2031
- 11.1. Market Analysis, Insights and Forecast - By Country/Sub-region
- 11.1.1 United States
- 11.1.2 Canada
- 11.1.3 Mexico
- 12. Europe Veterinary Industry Analysis, Insights and Forecast, 2019-2031
- 12.1. Market Analysis, Insights and Forecast - By Country/Sub-region
- 12.1.1 Germany
- 12.1.2 United Kingdom
- 12.1.3 France
- 12.1.4 Italy
- 12.1.5 Spain
- 12.1.6 Rest of Europe
- 13. Asia Pacific Veterinary Industry Analysis, Insights and Forecast, 2019-2031
- 13.1. Market Analysis, Insights and Forecast - By Country/Sub-region
- 13.1.1 China
- 13.1.2 Japan
- 13.1.3 India
- 13.1.4 Australia
- 13.1.5 South Korea
- 13.1.6 Rest of Asia Pacific
- 14. Middle East and Africa Veterinary Industry Analysis, Insights and Forecast, 2019-2031
- 14.1. Market Analysis, Insights and Forecast - By Country/Sub-region
- 14.1.1 GCC
- 14.1.2 South Africa
- 14.1.3 Rest of Middle East and Africa
- 15. South America Veterinary Industry Analysis, Insights and Forecast, 2019-2031
- 15.1. Market Analysis, Insights and Forecast - By Country/Sub-region
- 15.1.1 Brazil
- 15.1.2 Argentina
- 15.1.3 Rest of South America
- 16. Competitive Analysis
- 16.1. Global Market Share Analysis 2024
- 16.2. Company Profiles
- 16.2.1 CVS Group PLC
- 16.2.1.1. Overview
- 16.2.1.2. Products
- 16.2.1.3. SWOT Analysis
- 16.2.1.4. Recent Developments
- 16.2.1.5. Financials (Based on Availability)
- 16.2.2 Elanco
- 16.2.2.1. Overview
- 16.2.2.2. Products
- 16.2.2.3. SWOT Analysis
- 16.2.2.4. Recent Developments
- 16.2.2.5. Financials (Based on Availability)
- 16.2.3 FirstVet AB
- 16.2.3.1. Overview
- 16.2.3.2. Products
- 16.2.3.3. SWOT Analysis
- 16.2.3.4. Recent Developments
- 16.2.3.5. Financials (Based on Availability)
- 16.2.4 Elekta*List Not Exhaustive
- 16.2.4.1. Overview
- 16.2.4.2. Products
- 16.2.4.3. SWOT Analysis
- 16.2.4.4. Recent Developments
- 16.2.4.5. Financials (Based on Availability)
- 16.2.5 Zoetis
- 16.2.5.1. Overview
- 16.2.5.2. Products
- 16.2.5.3. SWOT Analysis
- 16.2.5.4. Recent Developments
- 16.2.5.5. Financials (Based on Availability)
- 16.2.6 CityVet Inc
- 16.2.6.1. Overview
- 16.2.6.2. Products
- 16.2.6.3. SWOT Analysis
- 16.2.6.4. Recent Developments
- 16.2.6.5. Financials (Based on Availability)
- 16.2.7 Kremer Veterinary Services
- 16.2.7.1. Overview
- 16.2.7.2. Products
- 16.2.7.3. SWOT Analysis
- 16.2.7.4. Recent Developments
- 16.2.7.5. Financials (Based on Availability)
- 16.2.8 Ethos Veterinary Health
- 16.2.8.1. Overview
- 16.2.8.2. Products
- 16.2.8.3. SWOT Analysis
- 16.2.8.4. Recent Developments
- 16.2.8.5. Financials (Based on Availability)
- 16.2.9 Torigen Pharmaceuticals Inc
- 16.2.9.1. Overview
- 16.2.9.2. Products
- 16.2.9.3. SWOT Analysis
- 16.2.9.4. Recent Developments
- 16.2.9.5. Financials (Based on Availability)
- 16.2.10 Karyopharm Therapeutics Inc
- 16.2.10.1. Overview
- 16.2.10.2. Products
- 16.2.10.3. SWOT Analysis
- 16.2.10.4. Recent Developments
- 16.2.10.5. Financials (Based on Availability)
- 16.2.11 ELIAS Animal Health
- 16.2.11.1. Overview
- 16.2.11.2. Products
- 16.2.11.3. SWOT Analysis
- 16.2.11.4. Recent Developments
- 16.2.11.5. Financials (Based on Availability)
- 16.2.12 Greencross Limited
- 16.2.12.1. Overview
- 16.2.12.2. Products
- 16.2.12.3. SWOT Analysis
- 16.2.12.4. Recent Developments
- 16.2.12.5. Financials (Based on Availability)
- 16.2.13 Armor Animal Health (Animart)
- 16.2.13.1. Overview
- 16.2.13.2. Products
- 16.2.13.3. SWOT Analysis
- 16.2.13.4. Recent Developments
- 16.2.13.5. Financials (Based on Availability)
- 16.2.14 Mars Inc
- 16.2.14.1. Overview
- 16.2.14.2. Products
- 16.2.14.3. SWOT Analysis
- 16.2.14.4. Recent Developments
- 16.2.14.5. Financials (Based on Availability)
- 16.2.15 Idexx laboratories
- 16.2.15.1. Overview
- 16.2.15.2. Products
- 16.2.15.3. SWOT Analysis
- 16.2.15.4. Recent Developments
- 16.2.15.5. Financials (Based on Availability)
- 16.2.1 CVS Group PLC
List of Figures
- Figure 1: Global Veterinary Industry Revenue Breakdown (Million, %) by Region 2024 & 2032
- Figure 2: North America Veterinary Industry Revenue (Million), by Country 2024 & 2032
- Figure 3: North America Veterinary Industry Revenue Share (%), by Country 2024 & 2032
- Figure 4: Europe Veterinary Industry Revenue (Million), by Country 2024 & 2032
- Figure 5: Europe Veterinary Industry Revenue Share (%), by Country 2024 & 2032
- Figure 6: Asia Pacific Veterinary Industry Revenue (Million), by Country 2024 & 2032
- Figure 7: Asia Pacific Veterinary Industry Revenue Share (%), by Country 2024 & 2032
- Figure 8: Middle East and Africa Veterinary Industry Revenue (Million), by Country 2024 & 2032
- Figure 9: Middle East and Africa Veterinary Industry Revenue Share (%), by Country 2024 & 2032
- Figure 10: South America Veterinary Industry Revenue (Million), by Country 2024 & 2032
- Figure 11: South America Veterinary Industry Revenue Share (%), by Country 2024 & 2032
- Figure 12: North America Veterinary Industry Revenue (Million), by Service 2024 & 2032
- Figure 13: North America Veterinary Industry Revenue Share (%), by Service 2024 & 2032
- Figure 14: North America Veterinary Industry Revenue (Million), by Animal Type 2024 & 2032
- Figure 15: North America Veterinary Industry Revenue Share (%), by Animal Type 2024 & 2032
- Figure 16: North America Veterinary Industry Revenue (Million), by Country 2024 & 2032
- Figure 17: North America Veterinary Industry Revenue Share (%), by Country 2024 & 2032
- Figure 18: Europe Veterinary Industry Revenue (Million), by Service 2024 & 2032
- Figure 19: Europe Veterinary Industry Revenue Share (%), by Service 2024 & 2032
- Figure 20: Europe Veterinary Industry Revenue (Million), by Animal Type 2024 & 2032
- Figure 21: Europe Veterinary Industry Revenue Share (%), by Animal Type 2024 & 2032
- Figure 22: Europe Veterinary Industry Revenue (Million), by Country 2024 & 2032
- Figure 23: Europe Veterinary Industry Revenue Share (%), by Country 2024 & 2032
- Figure 24: Asia Pacific Veterinary Industry Revenue (Million), by Service 2024 & 2032
- Figure 25: Asia Pacific Veterinary Industry Revenue Share (%), by Service 2024 & 2032
- Figure 26: Asia Pacific Veterinary Industry Revenue (Million), by Animal Type 2024 & 2032
- Figure 27: Asia Pacific Veterinary Industry Revenue Share (%), by Animal Type 2024 & 2032
- Figure 28: Asia Pacific Veterinary Industry Revenue (Million), by Country 2024 & 2032
- Figure 29: Asia Pacific Veterinary Industry Revenue Share (%), by Country 2024 & 2032
- Figure 30: Middle East and Africa Veterinary Industry Revenue (Million), by Service 2024 & 2032
- Figure 31: Middle East and Africa Veterinary Industry Revenue Share (%), by Service 2024 & 2032
- Figure 32: Middle East and Africa Veterinary Industry Revenue (Million), by Animal Type 2024 & 2032
- Figure 33: Middle East and Africa Veterinary Industry Revenue Share (%), by Animal Type 2024 & 2032
- Figure 34: Middle East and Africa Veterinary Industry Revenue (Million), by Country 2024 & 2032
- Figure 35: Middle East and Africa Veterinary Industry Revenue Share (%), by Country 2024 & 2032
- Figure 36: South America Veterinary Industry Revenue (Million), by Service 2024 & 2032
- Figure 37: South America Veterinary Industry Revenue Share (%), by Service 2024 & 2032
- Figure 38: South America Veterinary Industry Revenue (Million), by Animal Type 2024 & 2032
- Figure 39: South America Veterinary Industry Revenue Share (%), by Animal Type 2024 & 2032
- Figure 40: South America Veterinary Industry Revenue (Million), by Country 2024 & 2032
- Figure 41: South America Veterinary Industry Revenue Share (%), by Country 2024 & 2032
List of Tables
- Table 1: Global Veterinary Industry Revenue Million Forecast, by Region 2019 & 2032
- Table 2: Global Veterinary Industry Revenue Million Forecast, by Service 2019 & 2032
- Table 3: Global Veterinary Industry Revenue Million Forecast, by Animal Type 2019 & 2032
- Table 4: Global Veterinary Industry Revenue Million Forecast, by Region 2019 & 2032
- Table 5: Global Veterinary Industry Revenue Million Forecast, by Country 2019 & 2032
- Table 6: United States Veterinary Industry Revenue (Million) Forecast, by Application 2019 & 2032
- Table 7: Canada Veterinary Industry Revenue (Million) Forecast, by Application 2019 & 2032
- Table 8: Mexico Veterinary Industry Revenue (Million) Forecast, by Application 2019 & 2032
- Table 9: Global Veterinary Industry Revenue Million Forecast, by Country 2019 & 2032
- Table 10: Germany Veterinary Industry Revenue (Million) Forecast, by Application 2019 & 2032
- Table 11: United Kingdom Veterinary Industry Revenue (Million) Forecast, by Application 2019 & 2032
- Table 12: France Veterinary Industry Revenue (Million) Forecast, by Application 2019 & 2032
- Table 13: Italy Veterinary Industry Revenue (Million) Forecast, by Application 2019 & 2032
- Table 14: Spain Veterinary Industry Revenue (Million) Forecast, by Application 2019 & 2032
- Table 15: Rest of Europe Veterinary Industry Revenue (Million) Forecast, by Application 2019 & 2032
- Table 16: Global Veterinary Industry Revenue Million Forecast, by Country 2019 & 2032
- Table 17: China Veterinary Industry Revenue (Million) Forecast, by Application 2019 & 2032
- Table 18: Japan Veterinary Industry Revenue (Million) Forecast, by Application 2019 & 2032
- Table 19: India Veterinary Industry Revenue (Million) Forecast, by Application 2019 & 2032
- Table 20: Australia Veterinary Industry Revenue (Million) Forecast, by Application 2019 & 2032
- Table 21: South Korea Veterinary Industry Revenue (Million) Forecast, by Application 2019 & 2032
- Table 22: Rest of Asia Pacific Veterinary Industry Revenue (Million) Forecast, by Application 2019 & 2032
- Table 23: Global Veterinary Industry Revenue Million Forecast, by Country 2019 & 2032
- Table 24: GCC Veterinary Industry Revenue (Million) Forecast, by Application 2019 & 2032
- Table 25: South Africa Veterinary Industry Revenue (Million) Forecast, by Application 2019 & 2032
- Table 26: Rest of Middle East and Africa Veterinary Industry Revenue (Million) Forecast, by Application 2019 & 2032
- Table 27: Global Veterinary Industry Revenue Million Forecast, by Country 2019 & 2032
- Table 28: Brazil Veterinary Industry Revenue (Million) Forecast, by Application 2019 & 2032
- Table 29: Argentina Veterinary Industry Revenue (Million) Forecast, by Application 2019 & 2032
- Table 30: Rest of South America Veterinary Industry Revenue (Million) Forecast, by Application 2019 & 2032
- Table 31: Global Veterinary Industry Revenue Million Forecast, by Service 2019 & 2032
- Table 32: Global Veterinary Industry Revenue Million Forecast, by Animal Type 2019 & 2032
- Table 33: Global Veterinary Industry Revenue Million Forecast, by Country 2019 & 2032
- Table 34: United States Veterinary Industry Revenue (Million) Forecast, by Application 2019 & 2032
- Table 35: Canada Veterinary Industry Revenue (Million) Forecast, by Application 2019 & 2032
- Table 36: Mexico Veterinary Industry Revenue (Million) Forecast, by Application 2019 & 2032
- Table 37: Global Veterinary Industry Revenue Million Forecast, by Service 2019 & 2032
- Table 38: Global Veterinary Industry Revenue Million Forecast, by Animal Type 2019 & 2032
- Table 39: Global Veterinary Industry Revenue Million Forecast, by Country 2019 & 2032
- Table 40: Germany Veterinary Industry Revenue (Million) Forecast, by Application 2019 & 2032
- Table 41: United Kingdom Veterinary Industry Revenue (Million) Forecast, by Application 2019 & 2032
- Table 42: France Veterinary Industry Revenue (Million) Forecast, by Application 2019 & 2032
- Table 43: Italy Veterinary Industry Revenue (Million) Forecast, by Application 2019 & 2032
- Table 44: Spain Veterinary Industry Revenue (Million) Forecast, by Application 2019 & 2032
- Table 45: Rest of Europe Veterinary Industry Revenue (Million) Forecast, by Application 2019 & 2032
- Table 46: Global Veterinary Industry Revenue Million Forecast, by Service 2019 & 2032
- Table 47: Global Veterinary Industry Revenue Million Forecast, by Animal Type 2019 & 2032
- Table 48: Global Veterinary Industry Revenue Million Forecast, by Country 2019 & 2032
- Table 49: China Veterinary Industry Revenue (Million) Forecast, by Application 2019 & 2032
- Table 50: Japan Veterinary Industry Revenue (Million) Forecast, by Application 2019 & 2032
- Table 51: India Veterinary Industry Revenue (Million) Forecast, by Application 2019 & 2032
- Table 52: Australia Veterinary Industry Revenue (Million) Forecast, by Application 2019 & 2032
- Table 53: South Korea Veterinary Industry Revenue (Million) Forecast, by Application 2019 & 2032
- Table 54: Rest of Asia Pacific Veterinary Industry Revenue (Million) Forecast, by Application 2019 & 2032
- Table 55: Global Veterinary Industry Revenue Million Forecast, by Service 2019 & 2032
- Table 56: Global Veterinary Industry Revenue Million Forecast, by Animal Type 2019 & 2032
- Table 57: Global Veterinary Industry Revenue Million Forecast, by Country 2019 & 2032
- Table 58: GCC Veterinary Industry Revenue (Million) Forecast, by Application 2019 & 2032
- Table 59: South Africa Veterinary Industry Revenue (Million) Forecast, by Application 2019 & 2032
- Table 60: Rest of Middle East and Africa Veterinary Industry Revenue (Million) Forecast, by Application 2019 & 2032
- Table 61: Global Veterinary Industry Revenue Million Forecast, by Service 2019 & 2032
- Table 62: Global Veterinary Industry Revenue Million Forecast, by Animal Type 2019 & 2032
- Table 63: Global Veterinary Industry Revenue Million Forecast, by Country 2019 & 2032
- Table 64: Brazil Veterinary Industry Revenue (Million) Forecast, by Application 2019 & 2032
- Table 65: Argentina Veterinary Industry Revenue (Million) Forecast, by Application 2019 & 2032
- Table 66: Rest of South America Veterinary Industry Revenue (Million) Forecast, by Application 2019 & 2032
Frequently Asked Questions
1. What is the projected Compound Annual Growth Rate (CAGR) of the Veterinary Industry?
The projected CAGR is approximately 4.90%.
2. Which companies are prominent players in the Veterinary Industry?
Key companies in the market include CVS Group PLC, Elanco, FirstVet AB, Elekta*List Not Exhaustive, Zoetis, CityVet Inc, Kremer Veterinary Services, Ethos Veterinary Health, Torigen Pharmaceuticals Inc, Karyopharm Therapeutics Inc, ELIAS Animal Health, Greencross Limited, Armor Animal Health (Animart), Mars Inc, Idexx laboratories.
3. What are the main segments of the Veterinary Industry?
The market segments include Service, Animal Type.
4. Can you provide details about the market size?
The market size is estimated to be USD 122.72 Million as of 2022.
5. What are some drivers contributing to market growth?
Increasing Prevalence of Various Diseases in Animals; Rising Adoption of Animals; Growing Expenditure on Animals/Pets.
6. What are the notable trends driving market growth?
The Companion Animal Segment is Expected to Dominate the Market.
7. Are there any restraints impacting market growth?
Shortage of Skilled Personnel; Increasing Cost of Veterinary Services.
8. Can you provide examples of recent developments in the market?
May 2022: The Chief Minister of Andhra Pradesh, Sri YS Jagan Mohan Reddy, officially launched 175 Mobile Ambulatory Veterinary Clinics (MAVCs) with an investment of Rs 278 crore. The state government planned to establish 340 Dr. YSR Sanchaara Pasu Aarogya Seva, or Mobile Ambulatory Veterinary Clinics (MAVC), in the state to improve the service delivery system and ensure that the veterinary services provided by the animal husbandry department are more easily accessible to the public.
9. What pricing options are available for accessing the report?
Pricing options include single-user, multi-user, and enterprise licenses priced at USD 4750, USD 5250, and USD 8750 respectively.
10. Is the market size provided in terms of value or volume?
The market size is provided in terms of value, measured in Million.
11. Are there any specific market keywords associated with the report?
Yes, the market keyword associated with the report is "Veterinary Industry," which aids in identifying and referencing the specific market segment covered.
12. How do I determine which pricing option suits my needs best?
The pricing options vary based on user requirements and access needs. Individual users may opt for single-user licenses, while businesses requiring broader access may choose multi-user or enterprise licenses for cost-effective access to the report.
13. Are there any additional resources or data provided in the Veterinary Industry report?
While the report offers comprehensive insights, it's advisable to review the specific contents or supplementary materials provided to ascertain if additional resources or data are available.
14. How can I stay updated on further developments or reports in the Veterinary Industry?
To stay informed about further developments, trends, and reports in the Veterinary Industry, consider subscribing to industry newsletters, following relevant companies and organizations, or regularly checking reputable industry news sources and publications.
Methodology
Step 1 - Identification of Relevant Samples Size from Population Database


Step 2 - Approaches for Defining Global Market Size (Value, Volume* & Price*)

Note*: In applicable scenarios
Step 3 - Data Sources
Primary Research
- Web Analytics
- Survey Reports
- Research Institute
- Latest Research Reports
- Opinion Leaders
Secondary Research
- Annual Reports
- White Paper
- Latest Press Release
- Industry Association
- Paid Database
- Investor Presentations

Step 4 - Data Triangulation
Involves using different sources of information in order to increase the validity of a study
These sources are likely to be stakeholders in a program - participants, other researchers, program staff, other community members, and so on.
Then we put all data in single framework & apply various statistical tools to find out the dynamic on the market.
During the analysis stage, feedback from the stakeholder groups would be compared to determine areas of agreement as well as areas of divergence


