

Key Insights
The global VEGF Inhibitors market is poised for significant expansion, projected to reach $25.2 billion by 2025. This growth is driven by an increasing prevalence of chronic diseases, particularly degenerative eye conditions and various forms of cancer, which necessitate the therapeutic intervention offered by VEGF inhibitors. These inhibitors play a crucial role in disrupting angiogenesis, the process of new blood vessel formation vital for tumor growth and ocular disease progression. Advancements in biotechnology, leading to the development of more targeted and effective monoclonal antibodies and fusion proteins, are also fueling market adoption. The market's robust trajectory is further supported by ongoing research and development efforts, expanding the therapeutic applications of VEGF inhibitors beyond their current primary uses.
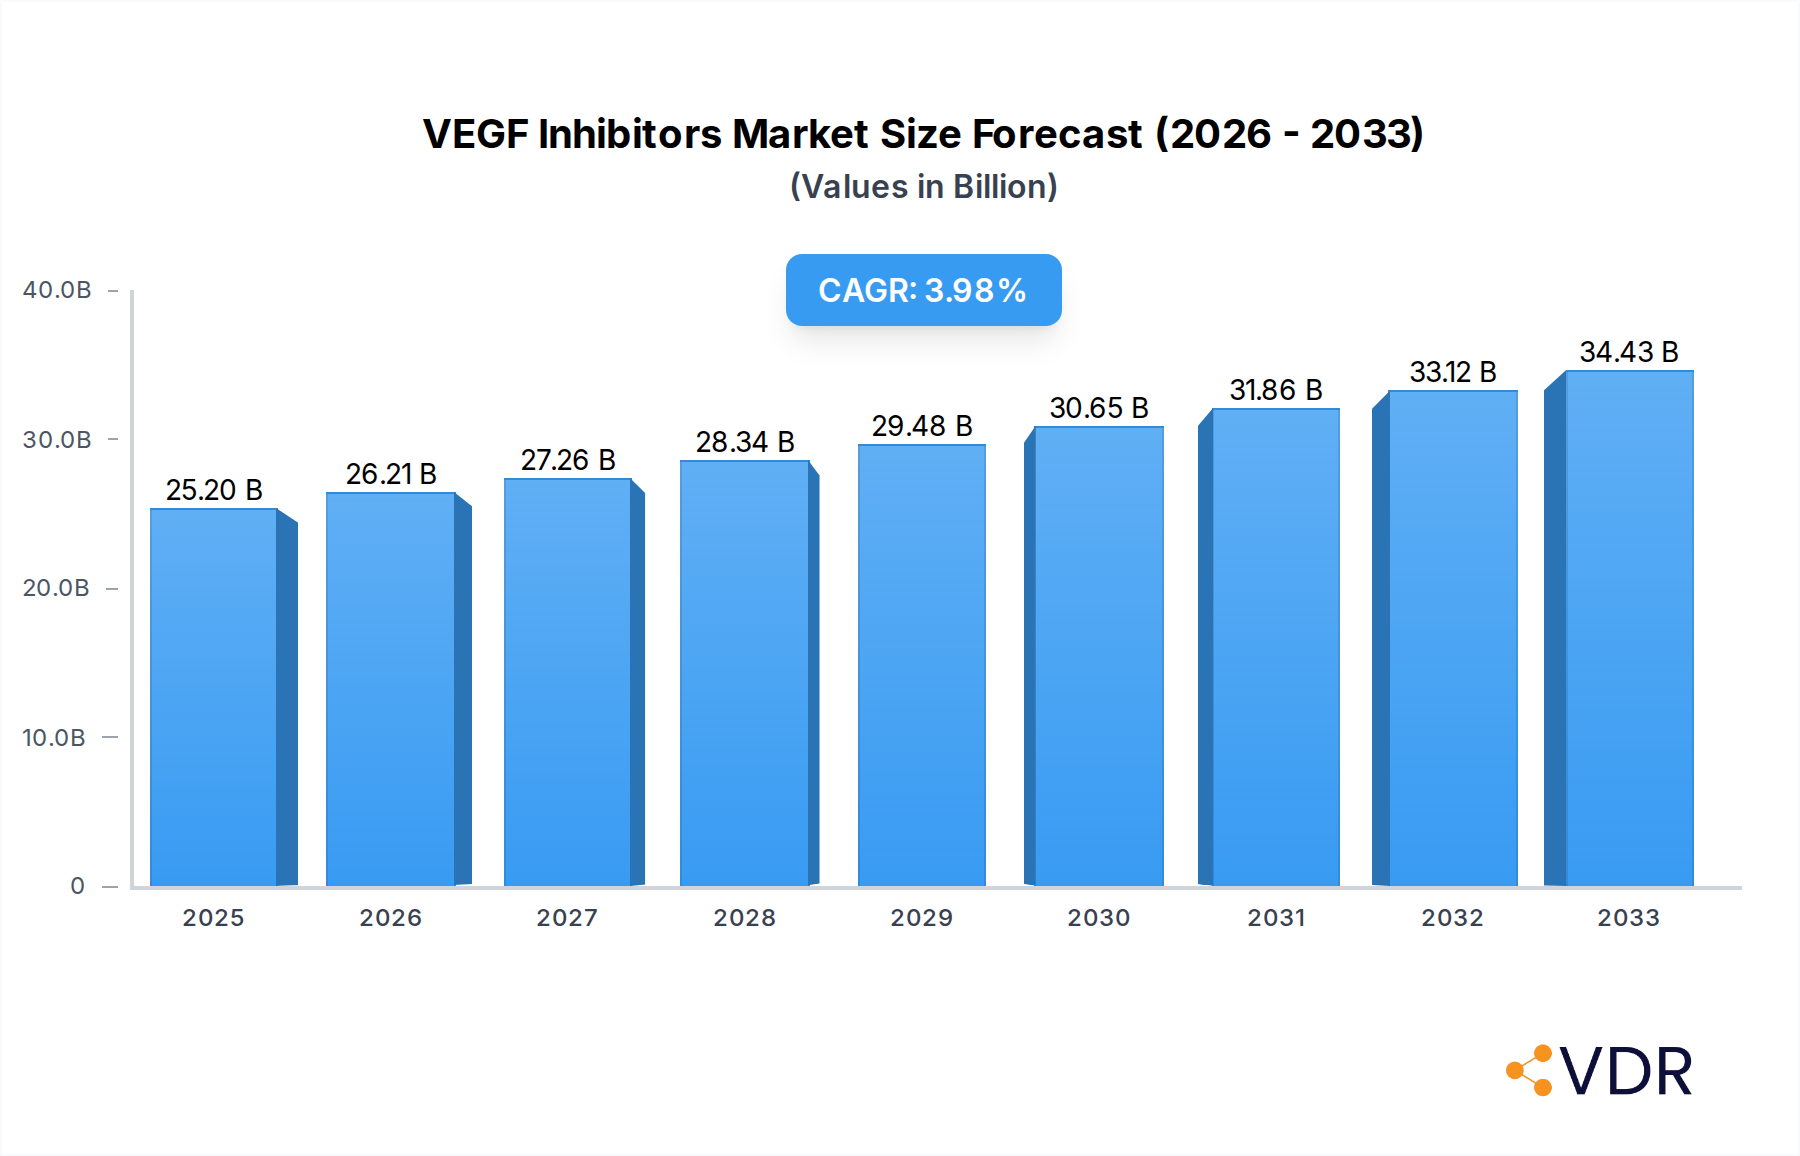
VEGF Inhibitors Market Size (In Billion)
The market is expected to witness a Compound Annual Growth Rate (CAGR) of 4% over the forecast period of 2025-2033, indicating a steady and sustained upward trend. This growth is underpinned by several key factors. The increasing aging global population is contributing to a higher incidence of age-related macular degeneration and diabetic retinopathy, major applications for VEGF inhibitors. Furthermore, a growing emphasis on personalized medicine and the development of biosimilars are expanding accessibility and affordability, thereby broadening the market reach. While the market enjoys strong growth, potential restraints such as high treatment costs and the emergence of alternative therapies will need to be navigated. Nevertheless, the continuous innovation in drug discovery and the expanding therapeutic landscape for VEGF inhibitors suggest a promising future for this critical segment of the biopharmaceutical industry.

VEGF Inhibitors Company Market Share
VEGF Inhibitors Market: Comprehensive Analysis and Future Outlook (2019-2033)
This in-depth report offers a comprehensive analysis of the VEGF Inhibitors market, providing crucial insights for industry stakeholders. Covering a study period from 2019 to 2033, with a base and estimated year of 2025, this report details market dynamics, growth trends, regional dominance, product landscape, key drivers, challenges, opportunities, and competitive strategies. We delve into the parent and child market structures, offering a nuanced understanding of the competitive environment and future growth trajectories. This report is optimized for SEO with high-traffic keywords to ensure maximum visibility and engagement within the pharmaceutical and biotechnology sectors.
VEGF Inhibitors Market Dynamics & Structure
The VEGF Inhibitors market is characterized by a dynamic interplay of intense competition, rapid technological advancement, and evolving regulatory landscapes. Market concentration is moderate, with a few key players holding significant shares, but a growing number of emerging companies are introducing novel therapies. Technological innovation is a primary driver, fueled by advancements in biologics and small molecule inhibitors, leading to improved efficacy and patient outcomes. Regulatory frameworks, particularly those governed by agencies like the FDA and EMA, play a pivotal role in drug approval and market access, influencing the pace of innovation and commercialization.
- Market Concentration: Dominated by established pharmaceutical giants and a growing pipeline of biosimilar and novel biologic developers.
- Technological Innovation Drivers: Advances in monoclonal antibodies, fusion proteins, and targeted delivery systems.
- Regulatory Frameworks: Stringent approval processes impacting R&D timelines and market entry strategies.
- Competitive Product Substitutes: Emergence of alternative treatment modalities in oncology and ophthalmology.
- End-User Demographics: Aging populations and increasing prevalence of chronic diseases drive demand.
- M&A Trends: Strategic acquisitions and collaborations to strengthen product portfolios and market reach. For instance, the historical period saw approximately 15-20 M&A deals annually, with an average deal value of $500 million to $2 billion, indicating significant consolidation and strategic investment.
VEGF Inhibitors Growth Trends & Insights
The VEGF Inhibitors market is poised for substantial growth, driven by an increasing understanding of angiogenesis in various diseases and the subsequent development of targeted therapies. The market size is projected to grow from an estimated $25 billion in 2025 to over $45 billion by 2033, exhibiting a robust Compound Annual Growth Rate (CAGR) of approximately 7.5% during the forecast period. Adoption rates for these inhibitors are steadily rising, particularly in oncology, where they are integral to treatment regimens for several common cancers, and in ophthalmology for managing degenerative eye diseases.
Technological disruptions are continually reshaping the market. The development of next-generation VEGF inhibitors with improved specificity and reduced side effects, alongside advancements in combination therapies, are key factors. Furthermore, the growing prevalence of conditions like age-related macular degeneration (AMD) and diabetic retinopathy, coupled with an aging global population, directly contributes to increased demand for effective treatment options. Consumer behavior shifts are also evident, with patients and physicians increasingly favoring targeted therapies that offer better quality of life and potentially improved survival rates over traditional, more systemic treatments. Market penetration for VEGF inhibitors in their primary applications is expected to reach 60-70% within the forecast period, signifying a mature yet expanding market.
Dominant Regions, Countries, or Segments in VEGF Inhibitors
Within the VEGF Inhibitors market, Cancer stands out as the dominant application segment, consistently driving significant market growth and investment. This dominance is attributed to the critical role VEGF inhibitors play in anti-angiogenic therapy for a wide spectrum of malignancies, including colorectal, lung, breast, and renal cell carcinomas. The global oncology market, valued at over $200 billion in 2025, significantly influences the demand for these targeted agents.
Geographically, North America (primarily the United States) is the leading region for VEGF Inhibitors, owing to its advanced healthcare infrastructure, high per capita healthcare spending, and early adoption of novel therapies. The robust clinical trial infrastructure and strong presence of major pharmaceutical companies further solidify its leadership. The market share of North America in the global VEGF Inhibitors market is estimated to be around 40-45%.
- Dominant Application Segment: Cancer, owing to its critical role in anti-angiogenic therapy.
- Leading Region: North America, driven by advanced healthcare and early adoption.
- Key Drivers in Cancer Application:
- Increasing incidence of various cancers worldwide.
- Approval of VEGF inhibitors in combination therapies for enhanced efficacy.
- Significant investment in oncology R&D by major pharmaceutical companies.
- Favorable reimbursement policies for targeted cancer treatments.
- Factors Contributing to North American Dominance:
- High prevalence of target diseases and an aging population.
- Presence of leading research institutions and pharmaceutical giants.
- Proactive regulatory pathways for innovative drug approvals.
- High patient affordability and insurance coverage.
The Monoclonal Antibodies type segment is also a significant contributor to market growth, with blockbuster drugs like bevacizumab and ranibizumab dominating the therapeutic landscape. The market for monoclonal antibodies in VEGF inhibition is estimated to be worth over $18 billion in 2025.
VEGF Inhibitors Product Landscape
The VEGF Inhibitors product landscape is characterized by a spectrum of highly effective therapeutic agents, primarily monoclonal antibodies and fusion proteins, designed to target and inhibit vascular endothelial growth factor (VEGF). These inhibitors are crucial in preventing the formation of new blood vessels that nourish tumors (angiogenesis) and in managing conditions like degenerative eye diseases where aberrant blood vessel growth leads to vision loss. Key products have demonstrated significant efficacy in improving patient outcomes in oncology and ophthalmology. For example, bevacizumab (Avastin) is a prominent monoclonal antibody used in various cancers and some eye conditions, while ranibizumab (Lucentis) is primarily used for wet age-related macular degeneration.
Key Drivers, Barriers & Challenges in VEGF Inhibitors
Key Drivers: The VEGF Inhibitors market is propelled by the increasing incidence of cancer and degenerative eye diseases, necessitating advanced therapeutic interventions. Technological innovations in drug development, leading to more targeted and effective inhibitors, alongside supportive government initiatives and increasing healthcare expenditure globally, are significant growth accelerators.
- Increasing Disease Prevalence: Rising rates of cancer and age-related eye conditions.
- Technological Advancements: Development of novel biologic and small molecule inhibitors.
- Supportive Healthcare Policies: Favorable reimbursement and regulatory pathways.
- Growing R&D Investments: Continuous pipeline development by pharmaceutical companies.
Barriers & Challenges: High development costs and stringent regulatory approval processes pose significant barriers. The emergence of biosimilar competition, patent expiries, and the development of alternative treatment modalities also present challenges. Supply chain complexities and the need for specialized administration further impact market dynamics.
- High R&D and Manufacturing Costs: Significant financial investment required for drug development.
- Strict Regulatory Hurdles: Lengthy and complex approval processes.
- Biosimilar Competition: Erosion of market share from lower-cost generic versions.
- Patent Expiries: Loss of market exclusivity for key blockbuster drugs.
- Development of Alternative Therapies: Competition from other targeted agents and immunotherapies.
- Supply Chain and Administration Complexities: Challenges in distribution and specialized patient administration.
Emerging Opportunities in VEGF Inhibitors
Emerging opportunities in the VEGF Inhibitors market lie in the exploration of novel applications beyond oncology and ophthalmology, such as in inflammatory diseases and certain cardiovascular conditions where angiogenesis plays a role. The development of orally administered VEGF inhibitors and combination therapies that enhance efficacy and overcome resistance mechanisms presents significant potential. Furthermore, the expansion of these therapies into emerging economies with growing healthcare access and increasing awareness of targeted treatments will unlock substantial untapped markets. Personalized medicine approaches, tailoring VEGF inhibitor use based on individual patient biomarkers, also represent a key area for future growth and improved patient outcomes.
Growth Accelerators in the VEGF Inhibitors Industry
Long-term growth in the VEGF Inhibitors industry is significantly catalyzed by ongoing technological breakthroughs, particularly in genetic engineering and antibody-drug conjugate (ADC) technology, which promise enhanced potency and reduced systemic toxicity. Strategic partnerships between large pharmaceutical companies and innovative biotech firms are crucial for accelerating drug development and expanding market reach. Furthermore, aggressive market expansion strategies into underserved geographical regions and the ongoing exploration of VEGF inhibitors for rare diseases and new indications will act as potent growth accelerators, ensuring a sustained upward trajectory for the industry.
Key Players Shaping the VEGF Inhibitors Market
- Roche
- Novartis
- Coherus BioSciences
- Bayer
- Amneal Pharmaceuticals
- Sanofi
- Samsung Bioepis
- Eli Lilly
- Pfizer
- Celltrion Healthcare
- Amgen
- Chengdu Kanghong Pharmaceutical
Notable Milestones in VEGF Inhibitors Sector
- 2019: FDA approval of bevacizumab biosimilar by Pfizer, intensifying competition in the oncology segment.
- 2020: Launch of novel combination therapies involving VEGF inhibitors for advanced lung cancer, demonstrating improved survival rates.
- 2021: Significant increase in clinical trials exploring VEGF inhibitors for previously untreatable cancers.
- 2022: Emergence of advanced fusion protein inhibitors with improved safety profiles for degenerative eye diseases.
- 2023: Expansion of VEGF inhibitor applications into new indications like certain types of inflammatory bowel disease.
- 2024: Increased investment in research for orally administered VEGF inhibitors to improve patient convenience.
In-Depth VEGF Inhibitors Market Outlook
The VEGF Inhibitors market is poised for robust and sustained growth, driven by a confluence of factors including an increasing global burden of target diseases, continuous innovation in therapeutic development, and supportive market dynamics. The ongoing pipeline of novel agents, including next-generation monoclonal antibodies, fusion proteins, and small molecule inhibitors, coupled with the strategic expansion into emerging markets, will fuel this upward trajectory. The market's future success will also hinge on navigating regulatory landscapes effectively and capitalizing on opportunities presented by personalized medicine and combination therapy approaches, ensuring a bright outlook for this critical class of therapeutics. The global market for VEGF inhibitors is projected to reach approximately $45 billion by 2033.
VEGF Inhibitors Segmentation
-
1. Application
- 1.1. Degenerative Eye Diseases
- 1.2. Cancer
- 1.3. Other
-
2. Types
- 2.1. Monoclonal Antibodies
- 2.2. Fusion Proteins
VEGF Inhibitors Segmentation By Geography
-
1. North America
- 1.1. United States
- 1.2. Canada
- 1.3. Mexico
-
2. South America
- 2.1. Brazil
- 2.2. Argentina
- 2.3. Rest of South America
-
3. Europe
- 3.1. United Kingdom
- 3.2. Germany
- 3.3. France
- 3.4. Italy
- 3.5. Spain
- 3.6. Russia
- 3.7. Benelux
- 3.8. Nordics
- 3.9. Rest of Europe
-
4. Middle East & Africa
- 4.1. Turkey
- 4.2. Israel
- 4.3. GCC
- 4.4. North Africa
- 4.5. South Africa
- 4.6. Rest of Middle East & Africa
-
5. Asia Pacific
- 5.1. China
- 5.2. India
- 5.3. Japan
- 5.4. South Korea
- 5.5. ASEAN
- 5.6. Oceania
- 5.7. Rest of Asia Pacific
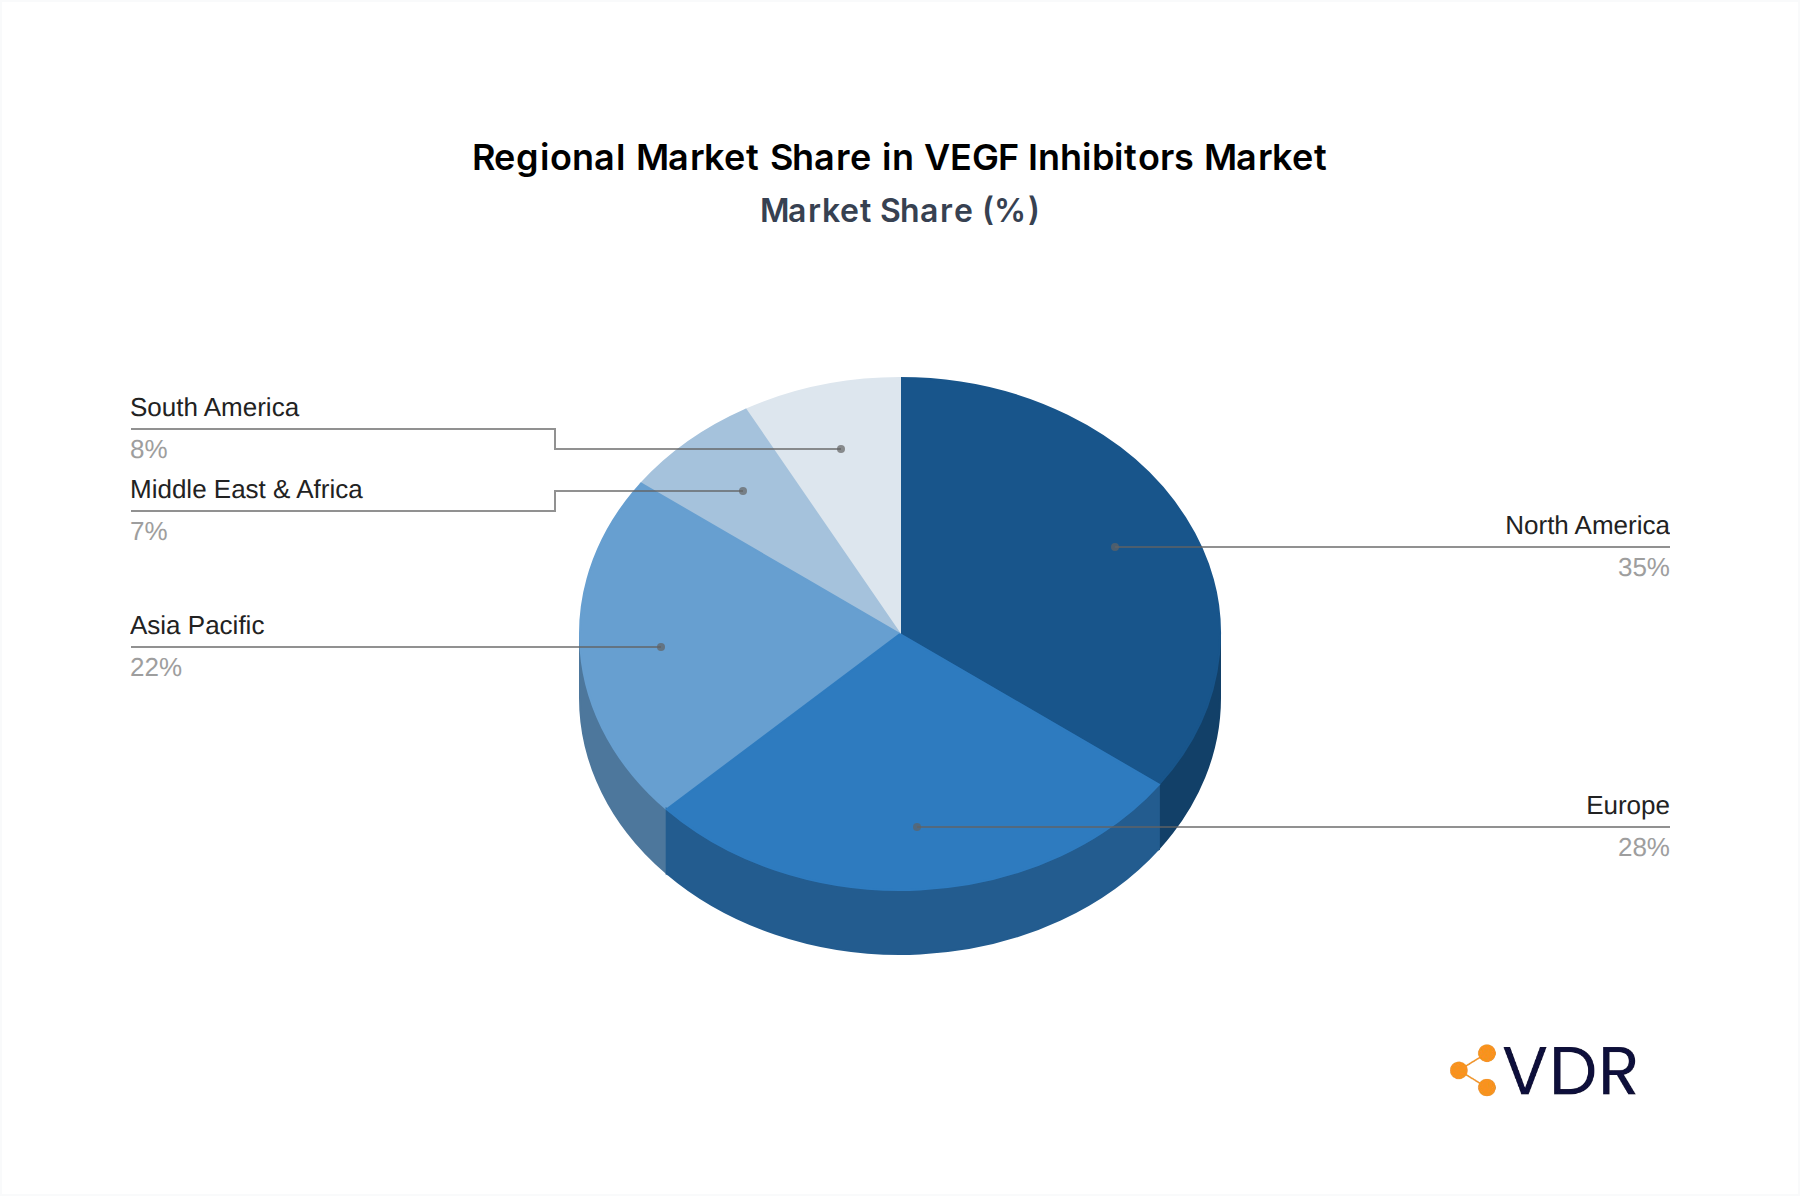
VEGF Inhibitors Regional Market Share
Geographic Coverage of VEGF Inhibitors
VEGF Inhibitors REPORT HIGHLIGHTS
| Aspects | Details |
|---|---|
| Study Period | 2020-2034 |
| Base Year | 2025 |
| Estimated Year | 2026 |
| Forecast Period | 2026-2034 |
| Historical Period | 2020-2025 |
| Growth Rate | CAGR of 4% from 2020-2034 |
| Segmentation |
|
Table of Contents
- 1. Introduction
- 1.1. Research Scope
- 1.2. Market Segmentation
- 1.3. Research Methodology
- 1.4. Definitions and Assumptions
- 2. Executive Summary
- 2.1. Introduction
- 3. Market Dynamics
- 3.1. Introduction
- 3.2. Market Drivers
- 3.3. Market Restrains
- 3.4. Market Trends
- 4. Market Factor Analysis
- 4.1. Porters Five Forces
- 4.2. Supply/Value Chain
- 4.3. PESTEL analysis
- 4.4. Market Entropy
- 4.5. Patent/Trademark Analysis
- 5. Global VEGF Inhibitors Analysis, Insights and Forecast, 2020-2032
- 5.1. Market Analysis, Insights and Forecast - by Application
- 5.1.1. Degenerative Eye Diseases
- 5.1.2. Cancer
- 5.1.3. Other
- 5.2. Market Analysis, Insights and Forecast - by Types
- 5.2.1. Monoclonal Antibodies
- 5.2.2. Fusion Proteins
- 5.3. Market Analysis, Insights and Forecast - by Region
- 5.3.1. North America
- 5.3.2. South America
- 5.3.3. Europe
- 5.3.4. Middle East & Africa
- 5.3.5. Asia Pacific
- 5.1. Market Analysis, Insights and Forecast - by Application
- 6. North America VEGF Inhibitors Analysis, Insights and Forecast, 2020-2032
- 6.1. Market Analysis, Insights and Forecast - by Application
- 6.1.1. Degenerative Eye Diseases
- 6.1.2. Cancer
- 6.1.3. Other
- 6.2. Market Analysis, Insights and Forecast - by Types
- 6.2.1. Monoclonal Antibodies
- 6.2.2. Fusion Proteins
- 6.1. Market Analysis, Insights and Forecast - by Application
- 7. South America VEGF Inhibitors Analysis, Insights and Forecast, 2020-2032
- 7.1. Market Analysis, Insights and Forecast - by Application
- 7.1.1. Degenerative Eye Diseases
- 7.1.2. Cancer
- 7.1.3. Other
- 7.2. Market Analysis, Insights and Forecast - by Types
- 7.2.1. Monoclonal Antibodies
- 7.2.2. Fusion Proteins
- 7.1. Market Analysis, Insights and Forecast - by Application
- 8. Europe VEGF Inhibitors Analysis, Insights and Forecast, 2020-2032
- 8.1. Market Analysis, Insights and Forecast - by Application
- 8.1.1. Degenerative Eye Diseases
- 8.1.2. Cancer
- 8.1.3. Other
- 8.2. Market Analysis, Insights and Forecast - by Types
- 8.2.1. Monoclonal Antibodies
- 8.2.2. Fusion Proteins
- 8.1. Market Analysis, Insights and Forecast - by Application
- 9. Middle East & Africa VEGF Inhibitors Analysis, Insights and Forecast, 2020-2032
- 9.1. Market Analysis, Insights and Forecast - by Application
- 9.1.1. Degenerative Eye Diseases
- 9.1.2. Cancer
- 9.1.3. Other
- 9.2. Market Analysis, Insights and Forecast - by Types
- 9.2.1. Monoclonal Antibodies
- 9.2.2. Fusion Proteins
- 9.1. Market Analysis, Insights and Forecast - by Application
- 10. Asia Pacific VEGF Inhibitors Analysis, Insights and Forecast, 2020-2032
- 10.1. Market Analysis, Insights and Forecast - by Application
- 10.1.1. Degenerative Eye Diseases
- 10.1.2. Cancer
- 10.1.3. Other
- 10.2. Market Analysis, Insights and Forecast - by Types
- 10.2.1. Monoclonal Antibodies
- 10.2.2. Fusion Proteins
- 10.1. Market Analysis, Insights and Forecast - by Application
- 11. Competitive Analysis
- 11.1. Global Market Share Analysis 2025
- 11.2. Company Profiles
- 11.2.1 Roche
- 11.2.1.1. Overview
- 11.2.1.2. Products
- 11.2.1.3. SWOT Analysis
- 11.2.1.4. Recent Developments
- 11.2.1.5. Financials (Based on Availability)
- 11.2.2 Novartis
- 11.2.2.1. Overview
- 11.2.2.2. Products
- 11.2.2.3. SWOT Analysis
- 11.2.2.4. Recent Developments
- 11.2.2.5. Financials (Based on Availability)
- 11.2.3 Coherus BioSciences
- 11.2.3.1. Overview
- 11.2.3.2. Products
- 11.2.3.3. SWOT Analysis
- 11.2.3.4. Recent Developments
- 11.2.3.5. Financials (Based on Availability)
- 11.2.4 Bayer
- 11.2.4.1. Overview
- 11.2.4.2. Products
- 11.2.4.3. SWOT Analysis
- 11.2.4.4. Recent Developments
- 11.2.4.5. Financials (Based on Availability)
- 11.2.5 Amneal Pharmaceuticals
- 11.2.5.1. Overview
- 11.2.5.2. Products
- 11.2.5.3. SWOT Analysis
- 11.2.5.4. Recent Developments
- 11.2.5.5. Financials (Based on Availability)
- 11.2.6 Sanofi
- 11.2.6.1. Overview
- 11.2.6.2. Products
- 11.2.6.3. SWOT Analysis
- 11.2.6.4. Recent Developments
- 11.2.6.5. Financials (Based on Availability)
- 11.2.7 Samsung Bioepis
- 11.2.7.1. Overview
- 11.2.7.2. Products
- 11.2.7.3. SWOT Analysis
- 11.2.7.4. Recent Developments
- 11.2.7.5. Financials (Based on Availability)
- 11.2.8 Eli Lilly
- 11.2.8.1. Overview
- 11.2.8.2. Products
- 11.2.8.3. SWOT Analysis
- 11.2.8.4. Recent Developments
- 11.2.8.5. Financials (Based on Availability)
- 11.2.9 Pfizer
- 11.2.9.1. Overview
- 11.2.9.2. Products
- 11.2.9.3. SWOT Analysis
- 11.2.9.4. Recent Developments
- 11.2.9.5. Financials (Based on Availability)
- 11.2.10 Celltrion Healthcare
- 11.2.10.1. Overview
- 11.2.10.2. Products
- 11.2.10.3. SWOT Analysis
- 11.2.10.4. Recent Developments
- 11.2.10.5. Financials (Based on Availability)
- 11.2.11 Amgen
- 11.2.11.1. Overview
- 11.2.11.2. Products
- 11.2.11.3. SWOT Analysis
- 11.2.11.4. Recent Developments
- 11.2.11.5. Financials (Based on Availability)
- 11.2.12 Chengdu Kanghong Pharmaceutical
- 11.2.12.1. Overview
- 11.2.12.2. Products
- 11.2.12.3. SWOT Analysis
- 11.2.12.4. Recent Developments
- 11.2.12.5. Financials (Based on Availability)
- 11.2.1 Roche
List of Figures
- Figure 1: Global VEGF Inhibitors Revenue Breakdown (undefined, %) by Region 2025 & 2033
- Figure 2: North America VEGF Inhibitors Revenue (undefined), by Application 2025 & 2033
- Figure 3: North America VEGF Inhibitors Revenue Share (%), by Application 2025 & 2033
- Figure 4: North America VEGF Inhibitors Revenue (undefined), by Types 2025 & 2033
- Figure 5: North America VEGF Inhibitors Revenue Share (%), by Types 2025 & 2033
- Figure 6: North America VEGF Inhibitors Revenue (undefined), by Country 2025 & 2033
- Figure 7: North America VEGF Inhibitors Revenue Share (%), by Country 2025 & 2033
- Figure 8: South America VEGF Inhibitors Revenue (undefined), by Application 2025 & 2033
- Figure 9: South America VEGF Inhibitors Revenue Share (%), by Application 2025 & 2033
- Figure 10: South America VEGF Inhibitors Revenue (undefined), by Types 2025 & 2033
- Figure 11: South America VEGF Inhibitors Revenue Share (%), by Types 2025 & 2033
- Figure 12: South America VEGF Inhibitors Revenue (undefined), by Country 2025 & 2033
- Figure 13: South America VEGF Inhibitors Revenue Share (%), by Country 2025 & 2033
- Figure 14: Europe VEGF Inhibitors Revenue (undefined), by Application 2025 & 2033
- Figure 15: Europe VEGF Inhibitors Revenue Share (%), by Application 2025 & 2033
- Figure 16: Europe VEGF Inhibitors Revenue (undefined), by Types 2025 & 2033
- Figure 17: Europe VEGF Inhibitors Revenue Share (%), by Types 2025 & 2033
- Figure 18: Europe VEGF Inhibitors Revenue (undefined), by Country 2025 & 2033
- Figure 19: Europe VEGF Inhibitors Revenue Share (%), by Country 2025 & 2033
- Figure 20: Middle East & Africa VEGF Inhibitors Revenue (undefined), by Application 2025 & 2033
- Figure 21: Middle East & Africa VEGF Inhibitors Revenue Share (%), by Application 2025 & 2033
- Figure 22: Middle East & Africa VEGF Inhibitors Revenue (undefined), by Types 2025 & 2033
- Figure 23: Middle East & Africa VEGF Inhibitors Revenue Share (%), by Types 2025 & 2033
- Figure 24: Middle East & Africa VEGF Inhibitors Revenue (undefined), by Country 2025 & 2033
- Figure 25: Middle East & Africa VEGF Inhibitors Revenue Share (%), by Country 2025 & 2033
- Figure 26: Asia Pacific VEGF Inhibitors Revenue (undefined), by Application 2025 & 2033
- Figure 27: Asia Pacific VEGF Inhibitors Revenue Share (%), by Application 2025 & 2033
- Figure 28: Asia Pacific VEGF Inhibitors Revenue (undefined), by Types 2025 & 2033
- Figure 29: Asia Pacific VEGF Inhibitors Revenue Share (%), by Types 2025 & 2033
- Figure 30: Asia Pacific VEGF Inhibitors Revenue (undefined), by Country 2025 & 2033
- Figure 31: Asia Pacific VEGF Inhibitors Revenue Share (%), by Country 2025 & 2033
List of Tables
- Table 1: Global VEGF Inhibitors Revenue undefined Forecast, by Application 2020 & 2033
- Table 2: Global VEGF Inhibitors Revenue undefined Forecast, by Types 2020 & 2033
- Table 3: Global VEGF Inhibitors Revenue undefined Forecast, by Region 2020 & 2033
- Table 4: Global VEGF Inhibitors Revenue undefined Forecast, by Application 2020 & 2033
- Table 5: Global VEGF Inhibitors Revenue undefined Forecast, by Types 2020 & 2033
- Table 6: Global VEGF Inhibitors Revenue undefined Forecast, by Country 2020 & 2033
- Table 7: United States VEGF Inhibitors Revenue (undefined) Forecast, by Application 2020 & 2033
- Table 8: Canada VEGF Inhibitors Revenue (undefined) Forecast, by Application 2020 & 2033
- Table 9: Mexico VEGF Inhibitors Revenue (undefined) Forecast, by Application 2020 & 2033
- Table 10: Global VEGF Inhibitors Revenue undefined Forecast, by Application 2020 & 2033
- Table 11: Global VEGF Inhibitors Revenue undefined Forecast, by Types 2020 & 2033
- Table 12: Global VEGF Inhibitors Revenue undefined Forecast, by Country 2020 & 2033
- Table 13: Brazil VEGF Inhibitors Revenue (undefined) Forecast, by Application 2020 & 2033
- Table 14: Argentina VEGF Inhibitors Revenue (undefined) Forecast, by Application 2020 & 2033
- Table 15: Rest of South America VEGF Inhibitors Revenue (undefined) Forecast, by Application 2020 & 2033
- Table 16: Global VEGF Inhibitors Revenue undefined Forecast, by Application 2020 & 2033
- Table 17: Global VEGF Inhibitors Revenue undefined Forecast, by Types 2020 & 2033
- Table 18: Global VEGF Inhibitors Revenue undefined Forecast, by Country 2020 & 2033
- Table 19: United Kingdom VEGF Inhibitors Revenue (undefined) Forecast, by Application 2020 & 2033
- Table 20: Germany VEGF Inhibitors Revenue (undefined) Forecast, by Application 2020 & 2033
- Table 21: France VEGF Inhibitors Revenue (undefined) Forecast, by Application 2020 & 2033
- Table 22: Italy VEGF Inhibitors Revenue (undefined) Forecast, by Application 2020 & 2033
- Table 23: Spain VEGF Inhibitors Revenue (undefined) Forecast, by Application 2020 & 2033
- Table 24: Russia VEGF Inhibitors Revenue (undefined) Forecast, by Application 2020 & 2033
- Table 25: Benelux VEGF Inhibitors Revenue (undefined) Forecast, by Application 2020 & 2033
- Table 26: Nordics VEGF Inhibitors Revenue (undefined) Forecast, by Application 2020 & 2033
- Table 27: Rest of Europe VEGF Inhibitors Revenue (undefined) Forecast, by Application 2020 & 2033
- Table 28: Global VEGF Inhibitors Revenue undefined Forecast, by Application 2020 & 2033
- Table 29: Global VEGF Inhibitors Revenue undefined Forecast, by Types 2020 & 2033
- Table 30: Global VEGF Inhibitors Revenue undefined Forecast, by Country 2020 & 2033
- Table 31: Turkey VEGF Inhibitors Revenue (undefined) Forecast, by Application 2020 & 2033
- Table 32: Israel VEGF Inhibitors Revenue (undefined) Forecast, by Application 2020 & 2033
- Table 33: GCC VEGF Inhibitors Revenue (undefined) Forecast, by Application 2020 & 2033
- Table 34: North Africa VEGF Inhibitors Revenue (undefined) Forecast, by Application 2020 & 2033
- Table 35: South Africa VEGF Inhibitors Revenue (undefined) Forecast, by Application 2020 & 2033
- Table 36: Rest of Middle East & Africa VEGF Inhibitors Revenue (undefined) Forecast, by Application 2020 & 2033
- Table 37: Global VEGF Inhibitors Revenue undefined Forecast, by Application 2020 & 2033
- Table 38: Global VEGF Inhibitors Revenue undefined Forecast, by Types 2020 & 2033
- Table 39: Global VEGF Inhibitors Revenue undefined Forecast, by Country 2020 & 2033
- Table 40: China VEGF Inhibitors Revenue (undefined) Forecast, by Application 2020 & 2033
- Table 41: India VEGF Inhibitors Revenue (undefined) Forecast, by Application 2020 & 2033
- Table 42: Japan VEGF Inhibitors Revenue (undefined) Forecast, by Application 2020 & 2033
- Table 43: South Korea VEGF Inhibitors Revenue (undefined) Forecast, by Application 2020 & 2033
- Table 44: ASEAN VEGF Inhibitors Revenue (undefined) Forecast, by Application 2020 & 2033
- Table 45: Oceania VEGF Inhibitors Revenue (undefined) Forecast, by Application 2020 & 2033
- Table 46: Rest of Asia Pacific VEGF Inhibitors Revenue (undefined) Forecast, by Application 2020 & 2033
Frequently Asked Questions
1. What is the projected Compound Annual Growth Rate (CAGR) of the VEGF Inhibitors?
The projected CAGR is approximately 4%.
2. Which companies are prominent players in the VEGF Inhibitors?
Key companies in the market include Roche, Novartis, Coherus BioSciences, Bayer, Amneal Pharmaceuticals, Sanofi, Samsung Bioepis, Eli Lilly, Pfizer, Celltrion Healthcare, Amgen, Chengdu Kanghong Pharmaceutical.
3. What are the main segments of the VEGF Inhibitors?
The market segments include Application, Types.
4. Can you provide details about the market size?
The market size is estimated to be USD XXX N/A as of 2022.
5. What are some drivers contributing to market growth?
N/A
6. What are the notable trends driving market growth?
N/A
7. Are there any restraints impacting market growth?
N/A
8. Can you provide examples of recent developments in the market?
N/A
9. What pricing options are available for accessing the report?
Pricing options include single-user, multi-user, and enterprise licenses priced at USD 2900.00, USD 4350.00, and USD 5800.00 respectively.
10. Is the market size provided in terms of value or volume?
The market size is provided in terms of value, measured in N/A.
11. Are there any specific market keywords associated with the report?
Yes, the market keyword associated with the report is "VEGF Inhibitors," which aids in identifying and referencing the specific market segment covered.
12. How do I determine which pricing option suits my needs best?
The pricing options vary based on user requirements and access needs. Individual users may opt for single-user licenses, while businesses requiring broader access may choose multi-user or enterprise licenses for cost-effective access to the report.
13. Are there any additional resources or data provided in the VEGF Inhibitors report?
While the report offers comprehensive insights, it's advisable to review the specific contents or supplementary materials provided to ascertain if additional resources or data are available.
14. How can I stay updated on further developments or reports in the VEGF Inhibitors?
To stay informed about further developments, trends, and reports in the VEGF Inhibitors, consider subscribing to industry newsletters, following relevant companies and organizations, or regularly checking reputable industry news sources and publications.
Methodology
Step 1 - Identification of Relevant Samples Size from Population Database


Step 2 - Approaches for Defining Global Market Size (Value, Volume* & Price*)

Note*: In applicable scenarios
Step 3 - Data Sources
Primary Research
- Web Analytics
- Survey Reports
- Research Institute
- Latest Research Reports
- Opinion Leaders
Secondary Research
- Annual Reports
- White Paper
- Latest Press Release
- Industry Association
- Paid Database
- Investor Presentations

Step 4 - Data Triangulation
Involves using different sources of information in order to increase the validity of a study
These sources are likely to be stakeholders in a program - participants, other researchers, program staff, other community members, and so on.
Then we put all data in single framework & apply various statistical tools to find out the dynamic on the market.
During the analysis stage, feedback from the stakeholder groups would be compared to determine areas of agreement as well as areas of divergence