

Key Insights
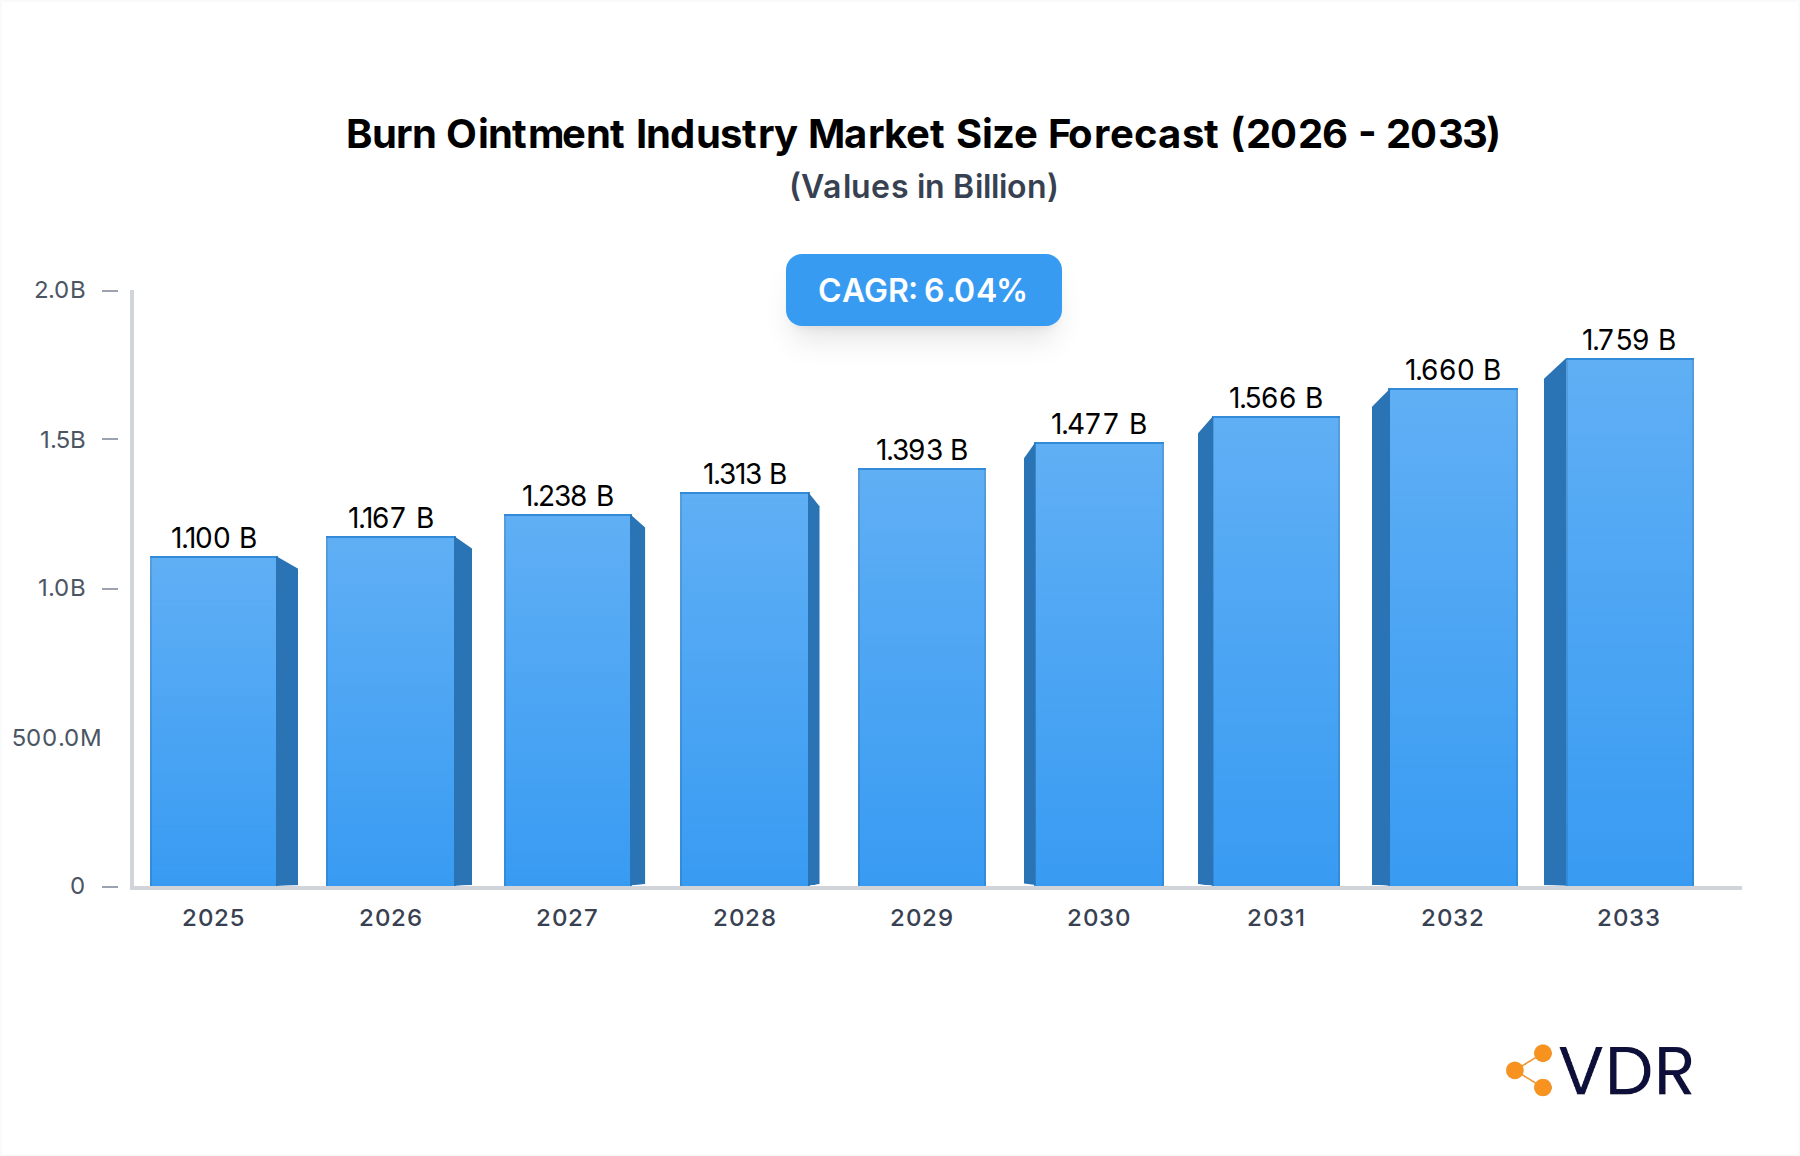
The global Burn Ointment Market is poised for significant expansion, projected to reach USD 1.1 Billion by 2025, with a robust Compound Annual Growth Rate (CAGR) of 5.95%. This upward trajectory is fueled by a confluence of factors, including the increasing incidence of burn injuries globally, advancements in wound care technologies, and a growing awareness of effective burn treatment protocols. The market is broadly segmented by product type, with Topical Antibiotics, Silver, and Iodine-based formulations dominating the landscape due to their proven efficacy in preventing and managing infections. The demand is also robust across different burn depths, from Minor Burns to more severe Partial and Full Thickness Burns, reflecting the comprehensive nature of burn care. Hospitals and Clinics represent a primary end-user segment, driven by the high volume of burn cases treated in healthcare settings, though a growing ‘Other End Users’ segment, encompassing home care and specialized clinics, is also contributing to market growth. Leading global players like Smith & Nephew PLC, Johnson & Johnson, and Pfizer Inc. are actively innovating and expanding their portfolios to cater to this expanding market, focusing on developing advanced formulations with enhanced healing properties and reduced side effects.

Burn Ointment Industry Market Size (In Billion)
The market's growth is further propelled by evolving trends such as the development of advanced wound dressings, the increasing adoption of telemedicine for burn management consultations, and a rising focus on antimicrobial resistance, leading to the demand for novel and effective antimicrobial burn ointments. Geographically, North America and Europe currently hold substantial market shares due to advanced healthcare infrastructure and high healthcare expenditure. However, the Asia Pacific region is anticipated to witness the fastest growth, driven by a large patient population, improving healthcare access, and increasing investments in medical infrastructure. Restraints, such as the high cost of advanced wound care products and the availability of generic alternatives, are being addressed by manufacturers through a focus on product differentiation and value-added solutions. The competitive landscape is characterized by strategic collaborations, mergers, and acquisitions, as companies strive to enhance their market presence and product offerings to capitalize on the burgeoning opportunities within the global Burn Ointment Market.
Burn Ointment Industry Company Market Share
Burn Ointment Industry Report Description
Unlock unparalleled insights into the global burn ointment market with this comprehensive, SEO-optimized industry report. Covering a critical study period from 2019–2033, with a base year of 2025, this report provides an in-depth analysis of market dynamics, growth trends, regional dominance, product landscape, key drivers, challenges, opportunities, and major industry players. Essential for healthcare professionals, pharmaceutical manufacturers, investors, and market analysts seeking to navigate the evolving burn care sector.
Keywords: Burn Ointment Market, Burn Care Products, Wound Management, Topical Antibiotics, Silver Sulfadiazine, Partial Thickness Burns, Full Thickness Burns, Hospitals, Clinics, Pharmaceutical Industry, Medical Devices, Healthcare Market, Market Research, Industry Analysis, Global Burn Ointment, Pediatric Burn Care, Burn Treatment, Wound Healing, Mediplex Ag, ConvaTec, Smith & Nephew, Perrigo, 3M, Johnson & Johnson.
Burn Ointment Industry Market Dynamics & Structure
The burn ointment industry is characterized by a moderate to high market concentration, driven by a blend of established giants and specialized players. Technological innovation remains a key driver, focusing on advanced wound healing technologies, antimicrobial efficacy, and pain management solutions. Regulatory frameworks, particularly concerning drug approvals and efficacy claims, play a significant role in shaping market entry and product development. The competitive landscape features a range of product substitutes, from basic dressings to advanced biologics, necessitating continuous innovation to maintain market share. End-user demographics are evolving, with an increasing demand for specialized pediatric burn ointments and products addressing chronic wound management. Mergers and acquisitions (M&A) are prevalent, with recent activity aimed at expanding product portfolios and geographical reach.
- Market Concentration: Dominated by a few key players but with significant room for specialized manufacturers.
- Technological Innovation: Focus on novel drug delivery systems, bioengineered dressings, and antimicrobial silver compounds.
- Regulatory Landscape: Stringent approval processes for new formulations and efficacy claims.
- Competitive Substitutes: Competition from advanced wound care technologies and alternative treatment modalities.
- End-User Demographics: Growing demand for solutions tailored to different age groups and burn severity.
- M&A Trends: Strategic acquisitions to broaden product offerings and market access.
Burn Ointment Industry Growth Trends & Insights
The global burn ointment market is poised for robust growth, projected to expand significantly from its 2025 estimated valuation. This expansion is fueled by an increasing incidence of burn injuries globally, coupled with rising awareness and adoption of advanced burn care solutions. Technological advancements in the development of novel formulations, such as hydrogels, silicone-based dressings, and antimicrobial-infused ointments, are acting as significant disruptors, enhancing treatment efficacy and patient comfort. Consumer behavior is shifting towards seeking more convenient, less painful, and faster-healing burn treatments, driving demand for innovative products. The market penetration of specialized burn ointments, particularly those targeting partial thickness and full thickness burns, is expected to rise. Key growth metrics include a projected Compound Annual Growth Rate (CAGR) of approximately 5.8% over the forecast period of 2025–2033. The market size is estimated to reach $XX Billion in 2025, with a projected expansion to $XX Billion by 2033. This growth is further bolstered by an increasing healthcare expenditure in emerging economies and a focus on improving emergency medical services for burn victims.
Dominant Regions, Countries, or Segments in Burn Ointment Industry
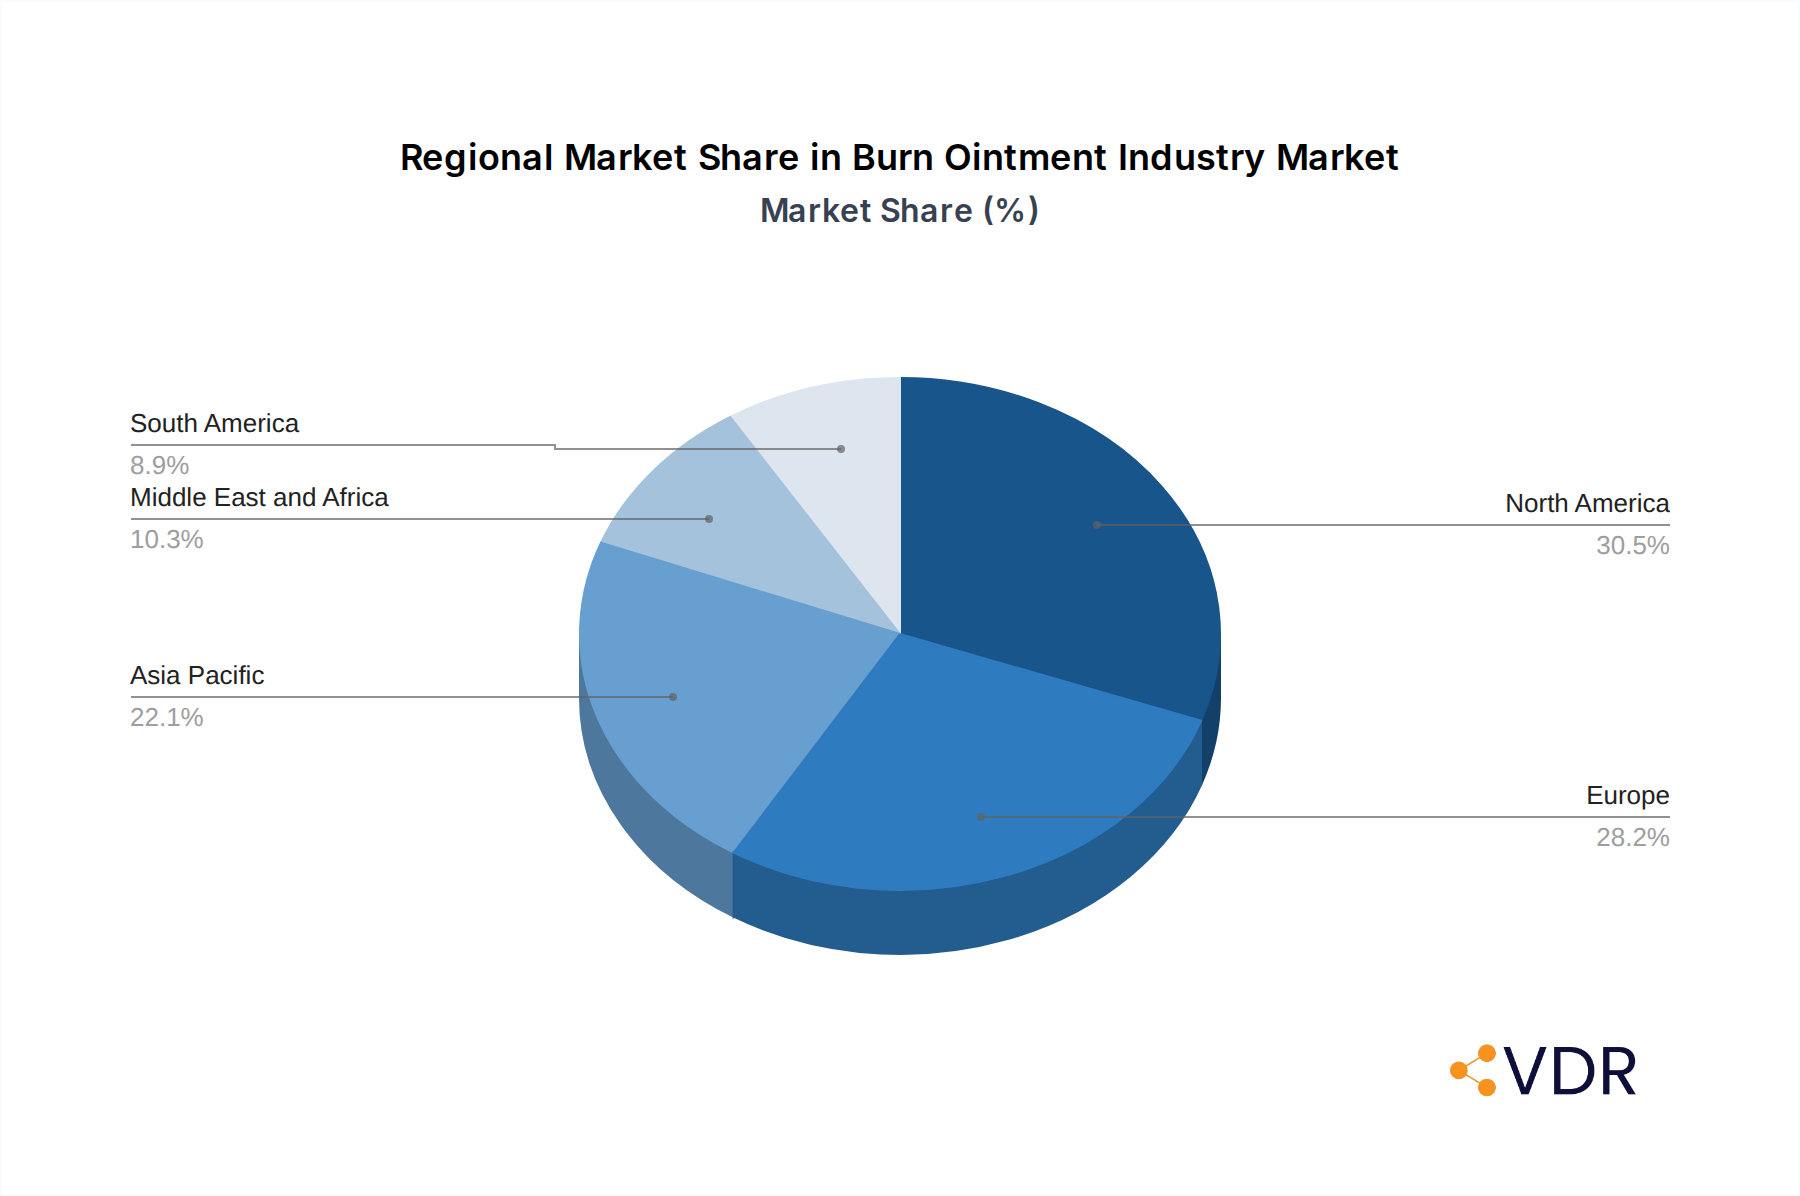
North America currently leads the burn ointment industry, driven by advanced healthcare infrastructure, high disposable incomes, and a strong emphasis on research and development in wound care. The United States, in particular, contributes significantly due to a high incidence of burn injuries and widespread adoption of advanced medical technologies. The Hospitals and Clinics end-user segment is a primary growth driver, owing to the critical role these institutions play in treating severe burns and managing post-operative wound care.
- North America: Dominant region due to advanced healthcare infrastructure and R&D investment.
- Key Drivers: High burn injury rates, government initiatives for improved healthcare, and strong presence of key players like Smith & Nephew PLC and Johnson & Johnson.
- Market Share: Estimated to hold over 35% of the global market share.
- Europe: A significant market with a growing emphasis on evidence-based wound management and an aging population prone to skin-related issues.
- Key Drivers: Favorable reimbursement policies, stringent quality standards, and the presence of companies like GlaxoSmithKline PLC.
- Asia Pacific: Fastest-growing region, fueled by a large patient pool, increasing healthcare expenditure, and rising awareness of advanced burn treatments.
- Key Drivers: Economic development, expanding healthcare access in countries like China and India, and the presence of key regional players like Sun Pharmaceutical Industries Ltd and Cipla Limited.
Within the Product Type segment, Silver-based ointments hold a substantial market share due to their proven antimicrobial properties and efficacy in preventing infection in burn wounds. The Partial Thickness Burns depth of burn segment is also a major contributor to market growth, reflecting the higher incidence of such injuries and the availability of effective topical treatments.
Burn Ointment Industry Product Landscape
The burn ointment product landscape is continuously evolving with a focus on enhanced efficacy and patient comfort. Innovations include advanced topical antibiotics with broader spectrum activity, silver-based formulations for superior antimicrobial control, and iodine-based products for antiseptic properties. Specialized ointments designed for minor burns offer rapid relief, while those for partial and full thickness burns emphasize advanced wound healing mechanisms. Key performance metrics include antimicrobial effectiveness, healing acceleration, pain reduction, and minimized scarring. Unique selling propositions often revolve around the unique delivery systems, biocompatibility, and clinically proven results.
Key Drivers, Barriers & Challenges in Burn Ointment Industry
Key Drivers:
- Increasing Incidence of Burn Injuries: Rising industrial accidents, home fires, and scald injuries globally.
- Technological Advancements: Development of novel antimicrobial agents, advanced wound dressings, and pain management formulations.
- Growing Healthcare Expenditure: Increased investment in healthcare infrastructure and advanced medical treatments.
- Awareness and Education: Greater understanding of proper burn wound management among healthcare professionals and the public.
Barriers & Challenges:
- Regulatory Hurdles: Stringent approval processes and the cost associated with clinical trials.
- High Development Costs: Research and development for new formulations can be expensive.
- Competition from Substitutes: Availability of alternative wound care products and treatments.
- Price Sensitivity: In some markets, cost remains a significant factor influencing product adoption.
- Supply Chain Disruptions: Geopolitical factors and global events can impact the availability of raw materials and finished products.
Emerging Opportunities in Burn Ointment Industry
Emerging opportunities lie in the development of bio-engineered burn ointments that mimic natural tissue regeneration, offering faster and scar-free healing. The pediatric burn care segment presents a largely untapped market with a growing demand for specialized, gentle formulations. Furthermore, the integration of telemedicine and digital wound monitoring solutions can enhance treatment adherence and outcomes, creating new avenues for product delivery and service provision. Expansion into underserved emerging markets with improving healthcare infrastructure also offers significant growth potential.
Growth Accelerators in the Burn Ointment Industry Industry
Long-term growth in the burn ointment industry will be accelerated by breakthroughs in regenerative medicine, leading to the development of ointments that promote complete tissue regrowth. Strategic partnerships between pharmaceutical companies and research institutions will foster innovation and expedite the translation of new technologies into marketable products. Furthermore, targeted market expansion strategies focusing on regions with a high prevalence of burn injuries and a growing healthcare sector will be crucial. The increasing focus on patient-centric care, emphasizing reduced pain and faster recovery, will also drive demand for advanced and innovative burn ointment solutions.
Key Players Shaping the Burn Ointment Industry Market
- Smith & Nephew PLC
- Perrigo Company PLC
- DeRoyal Industries Inc
- Integra LifeSciences
- 3M
- ConvaTec Group PLC
- Dr Morepen
- Mankind Pharma
- Cardinal Health
- Cipla Limited
- Trio Lifescience Pvt Ltd
- Johnson & Johnson
- Sun Pharmaceutical Industries Ltd (Ranbaxy Laboratories Limited)
- GlaxoSmithKline PLC
- Pfizer Inc
Notable Milestones in Burn Ointment Industry Sector
- May 2022: Molncyke Healthcare submitted clinical evidence in Wound International 2022 on the use of Mediplex Ag for the management of partial thickness burns, highlighting its soft silicone wound contact layer designed to minimize trauma and pain, aiding burn healing.
- April 2022: The Hospices Civils de Lyon sponsored a clinical trial to examine the use of silver sulphadiazine as an ointment for treating second-degree fibrinous burns, with the study estimated to commence in September 2022.
In-Depth Burn Ointment Industry Market Outlook
The future of the burn ointment market is exceptionally promising, driven by continuous innovation in wound healing technologies and a growing global demand for effective burn treatments. Market potential lies in the development of regenerative medicine-inspired ointments and personalized burn care solutions. Strategic opportunities include expanding into emerging economies, forging collaborations for advanced R&D, and leveraging digital health platforms to enhance patient care and product accessibility. The sector is set to witness significant advancements in antimicrobial efficacy, pain management, and scar reduction, further solidifying its growth trajectory.
Burn Ointment Industry Segmentation
-
1. Product Type
- 1.1. Topical Antibiotics
- 1.2. Silver
- 1.3. Iodine
-
2. Depth of Burn
- 2.1. Minor Burns
- 2.2. Partial Thickness Burns
- 2.3. Full Thickness Burns
-
3. End User
- 3.1. Hospitals and Clinics
- 3.2. Other End Users
Burn Ointment Industry Segmentation By Geography
-
1. North America
- 1.1. United States
- 1.2. Canada
- 1.3. Mexico
-
2. Europe
- 2.1. Germany
- 2.2. United Kingdom
- 2.3. France
- 2.4. Italy
- 2.5. Spain
- 2.6. Rest of Europe
-
3. Asia Pacific
- 3.1. China
- 3.2. Japan
- 3.3. India
- 3.4. Australia
- 3.5. South Korea
- 3.6. Rest of Asia Pacific
-
4. Middle East and Africa
- 4.1. GCC
- 4.2. South Africa
- 4.3. Rest of Middle East and Africa
-
5. South America
- 5.1. Brazil
- 5.2. Argentina
- 5.3. Rest of South America
Burn Ointment Industry Regional Market Share
Geographic Coverage of Burn Ointment Industry
Burn Ointment Industry REPORT HIGHLIGHTS
| Aspects | Details |
|---|---|
| Study Period | 2020-2034 |
| Base Year | 2025 |
| Estimated Year | 2026 |
| Forecast Period | 2026-2034 |
| Historical Period | 2020-2025 |
| Growth Rate | CAGR of 5.95% from 2020-2034 |
| Segmentation |
|
Table of Contents
- 1. Introduction
- 1.1. Research Scope
- 1.2. Market Segmentation
- 1.3. Research Objective
- 1.4. Definitions and Assumptions
- 2. Executive Summary
- 2.1. Market Snapshot
- 3. Market Dynamics
- 3.1. Market Drivers
- 3.2. Market Restrains
- 3.3. Market Trends
- 3.4. Market Opportunities
- 4. Market Factor Analysis
- 4.1. Porters Five Forces
- 4.1.1. Bargaining Power of Suppliers
- 4.1.2. Bargaining Power of Buyers
- 4.1.3. Threat of New Entrants
- 4.1.4. Threat of Substitutes
- 4.1.5. Competitive Rivalry
- 4.2. PESTEL analysis
- 4.3. BCG Analysis
- 4.3.1. Stars (High Growth, High Market Share)
- 4.3.2. Cash Cows (Low Growth, High Market Share)
- 4.3.3. Question Mark (High Growth, Low Market Share)
- 4.3.4. Dogs (Low Growth, Low Market Share)
- 4.4. Ansoff Matrix Analysis
- 4.5. Supply Chain Analysis
- 4.6. Regulatory Landscape
- 4.7. Current Market Potential and Opportunity Assessment (TAM–SAM–SOM Framework)
- 4.8. VDR Analyst Note
- 4.1. Porters Five Forces
- 5. Market Analysis, Insights and Forecast 2021-2033
- 5.1. Market Analysis, Insights and Forecast - by Product Type
- 5.1.1. Topical Antibiotics
- 5.1.2. Silver
- 5.1.3. Iodine
- 5.2. Market Analysis, Insights and Forecast - by Depth of Burn
- 5.2.1. Minor Burns
- 5.2.2. Partial Thickness Burns
- 5.2.3. Full Thickness Burns
- 5.3. Market Analysis, Insights and Forecast - by End User
- 5.3.1. Hospitals and Clinics
- 5.3.2. Other End Users
- 5.4. Market Analysis, Insights and Forecast - by Region
- 5.4.1. North America
- 5.4.2. Europe
- 5.4.3. Asia Pacific
- 5.4.4. Middle East and Africa
- 5.4.5. South America
- 5.1. Market Analysis, Insights and Forecast - by Product Type
- 6. Global Burn Ointment Industry Analysis, Insights and Forecast, 2021-2033
- 6.1. Market Analysis, Insights and Forecast - by Product Type
- 6.1.1. Topical Antibiotics
- 6.1.2. Silver
- 6.1.3. Iodine
- 6.2. Market Analysis, Insights and Forecast - by Depth of Burn
- 6.2.1. Minor Burns
- 6.2.2. Partial Thickness Burns
- 6.2.3. Full Thickness Burns
- 6.3. Market Analysis, Insights and Forecast - by End User
- 6.3.1. Hospitals and Clinics
- 6.3.2. Other End Users
- 6.1. Market Analysis, Insights and Forecast - by Product Type
- 7. North America Burn Ointment Industry Analysis, Insights and Forecast, 2021-2033
- 7.1. Market Analysis, Insights and Forecast - by Product Type
- 7.1.1. Topical Antibiotics
- 7.1.2. Silver
- 7.1.3. Iodine
- 7.2. Market Analysis, Insights and Forecast - by Depth of Burn
- 7.2.1. Minor Burns
- 7.2.2. Partial Thickness Burns
- 7.2.3. Full Thickness Burns
- 7.3. Market Analysis, Insights and Forecast - by End User
- 7.3.1. Hospitals and Clinics
- 7.3.2. Other End Users
- 7.1. Market Analysis, Insights and Forecast - by Product Type
- 8. Europe Burn Ointment Industry Analysis, Insights and Forecast, 2021-2033
- 8.1. Market Analysis, Insights and Forecast - by Product Type
- 8.1.1. Topical Antibiotics
- 8.1.2. Silver
- 8.1.3. Iodine
- 8.2. Market Analysis, Insights and Forecast - by Depth of Burn
- 8.2.1. Minor Burns
- 8.2.2. Partial Thickness Burns
- 8.2.3. Full Thickness Burns
- 8.3. Market Analysis, Insights and Forecast - by End User
- 8.3.1. Hospitals and Clinics
- 8.3.2. Other End Users
- 8.1. Market Analysis, Insights and Forecast - by Product Type
- 9. Asia Pacific Burn Ointment Industry Analysis, Insights and Forecast, 2021-2033
- 9.1. Market Analysis, Insights and Forecast - by Product Type
- 9.1.1. Topical Antibiotics
- 9.1.2. Silver
- 9.1.3. Iodine
- 9.2. Market Analysis, Insights and Forecast - by Depth of Burn
- 9.2.1. Minor Burns
- 9.2.2. Partial Thickness Burns
- 9.2.3. Full Thickness Burns
- 9.3. Market Analysis, Insights and Forecast - by End User
- 9.3.1. Hospitals and Clinics
- 9.3.2. Other End Users
- 9.1. Market Analysis, Insights and Forecast - by Product Type
- 10. Middle East and Africa Burn Ointment Industry Analysis, Insights and Forecast, 2021-2033
- 10.1. Market Analysis, Insights and Forecast - by Product Type
- 10.1.1. Topical Antibiotics
- 10.1.2. Silver
- 10.1.3. Iodine
- 10.2. Market Analysis, Insights and Forecast - by Depth of Burn
- 10.2.1. Minor Burns
- 10.2.2. Partial Thickness Burns
- 10.2.3. Full Thickness Burns
- 10.3. Market Analysis, Insights and Forecast - by End User
- 10.3.1. Hospitals and Clinics
- 10.3.2. Other End Users
- 10.1. Market Analysis, Insights and Forecast - by Product Type
- 11. South America Burn Ointment Industry Analysis, Insights and Forecast, 2021-2033
- 11.1. Market Analysis, Insights and Forecast - by Product Type
- 11.1.1. Topical Antibiotics
- 11.1.2. Silver
- 11.1.3. Iodine
- 11.2. Market Analysis, Insights and Forecast - by Depth of Burn
- 11.2.1. Minor Burns
- 11.2.2. Partial Thickness Burns
- 11.2.3. Full Thickness Burns
- 11.3. Market Analysis, Insights and Forecast - by End User
- 11.3.1. Hospitals and Clinics
- 11.3.2. Other End Users
- 11.1. Market Analysis, Insights and Forecast - by Product Type
- 12. Competitive Analysis
- 12.1. Company Profiles
- 12.1.1 Smith & Nephew PLC
- 12.1.1.1. Company Overview
- 12.1.1.2. Products
- 12.1.1.3. Company Financials
- 12.1.1.4. SWOT Analysis
- 12.1.2 Perrigo Company PLC
- 12.1.2.1. Company Overview
- 12.1.2.2. Products
- 12.1.2.3. Company Financials
- 12.1.2.4. SWOT Analysis
- 12.1.3 DeRoyal Industries Inc
- 12.1.3.1. Company Overview
- 12.1.3.2. Products
- 12.1.3.3. Company Financials
- 12.1.3.4. SWOT Analysis
- 12.1.4 Intergra LifeSciences
- 12.1.4.1. Company Overview
- 12.1.4.2. Products
- 12.1.4.3. Company Financials
- 12.1.4.4. SWOT Analysis
- 12.1.5 3M
- 12.1.5.1. Company Overview
- 12.1.5.2. Products
- 12.1.5.3. Company Financials
- 12.1.5.4. SWOT Analysis
- 12.1.6 ConvaTec Group PLC
- 12.1.6.1. Company Overview
- 12.1.6.2. Products
- 12.1.6.3. Company Financials
- 12.1.6.4. SWOT Analysis
- 12.1.7 Dr Morepen
- 12.1.7.1. Company Overview
- 12.1.7.2. Products
- 12.1.7.3. Company Financials
- 12.1.7.4. SWOT Analysis
- 12.1.8 Mankind Pharma
- 12.1.8.1. Company Overview
- 12.1.8.2. Products
- 12.1.8.3. Company Financials
- 12.1.8.4. SWOT Analysis
- 12.1.9 Cardinal Health
- 12.1.9.1. Company Overview
- 12.1.9.2. Products
- 12.1.9.3. Company Financials
- 12.1.9.4. SWOT Analysis
- 12.1.10 Cipla Limited
- 12.1.10.1. Company Overview
- 12.1.10.2. Products
- 12.1.10.3. Company Financials
- 12.1.10.4. SWOT Analysis
- 12.1.11 Trio Lifescience Pvt Ltd
- 12.1.11.1. Company Overview
- 12.1.11.2. Products
- 12.1.11.3. Company Financials
- 12.1.11.4. SWOT Analysis
- 12.1.12 Johnson & Johnson
- 12.1.12.1. Company Overview
- 12.1.12.2. Products
- 12.1.12.3. Company Financials
- 12.1.12.4. SWOT Analysis
- 12.1.13 Sun Pharmaceutical Industries Ltd (Ranbaxy Laboratories Limited)
- 12.1.13.1. Company Overview
- 12.1.13.2. Products
- 12.1.13.3. Company Financials
- 12.1.13.4. SWOT Analysis
- 12.1.14 GlaxoSmithKline PLC
- 12.1.14.1. Company Overview
- 12.1.14.2. Products
- 12.1.14.3. Company Financials
- 12.1.14.4. SWOT Analysis
- 12.1.15 Pfizer Inc
- 12.1.15.1. Company Overview
- 12.1.15.2. Products
- 12.1.15.3. Company Financials
- 12.1.15.4. SWOT Analysis
- 12.1.1 Smith & Nephew PLC
- 12.2. Market Entropy
- 12.2.1 Company's Key Areas Served
- 12.2.2 Recent Developments
- 12.3. Company Market Share Analysis 2025
- 12.3.1 Top 5 Companies Market Share Analysis
- 12.3.2 Top 3 Companies Market Share Analysis
- 12.4. List of Potential Customers
- 13. Research Methodology
List of Figures
- Figure 1: Global Burn Ointment Industry Revenue Breakdown (Billion, %) by Region 2025 & 2033
- Figure 2: Global Burn Ointment Industry Volume Breakdown (K Tons, %) by Region 2025 & 2033
- Figure 3: North America Burn Ointment Industry Revenue (Billion), by Product Type 2025 & 2033
- Figure 4: North America Burn Ointment Industry Volume (K Tons), by Product Type 2025 & 2033
- Figure 5: North America Burn Ointment Industry Revenue Share (%), by Product Type 2025 & 2033
- Figure 6: North America Burn Ointment Industry Volume Share (%), by Product Type 2025 & 2033
- Figure 7: North America Burn Ointment Industry Revenue (Billion), by Depth of Burn 2025 & 2033
- Figure 8: North America Burn Ointment Industry Volume (K Tons), by Depth of Burn 2025 & 2033
- Figure 9: North America Burn Ointment Industry Revenue Share (%), by Depth of Burn 2025 & 2033
- Figure 10: North America Burn Ointment Industry Volume Share (%), by Depth of Burn 2025 & 2033
- Figure 11: North America Burn Ointment Industry Revenue (Billion), by End User 2025 & 2033
- Figure 12: North America Burn Ointment Industry Volume (K Tons), by End User 2025 & 2033
- Figure 13: North America Burn Ointment Industry Revenue Share (%), by End User 2025 & 2033
- Figure 14: North America Burn Ointment Industry Volume Share (%), by End User 2025 & 2033
- Figure 15: North America Burn Ointment Industry Revenue (Billion), by Country 2025 & 2033
- Figure 16: North America Burn Ointment Industry Volume (K Tons), by Country 2025 & 2033
- Figure 17: North America Burn Ointment Industry Revenue Share (%), by Country 2025 & 2033
- Figure 18: North America Burn Ointment Industry Volume Share (%), by Country 2025 & 2033
- Figure 19: Europe Burn Ointment Industry Revenue (Billion), by Product Type 2025 & 2033
- Figure 20: Europe Burn Ointment Industry Volume (K Tons), by Product Type 2025 & 2033
- Figure 21: Europe Burn Ointment Industry Revenue Share (%), by Product Type 2025 & 2033
- Figure 22: Europe Burn Ointment Industry Volume Share (%), by Product Type 2025 & 2033
- Figure 23: Europe Burn Ointment Industry Revenue (Billion), by Depth of Burn 2025 & 2033
- Figure 24: Europe Burn Ointment Industry Volume (K Tons), by Depth of Burn 2025 & 2033
- Figure 25: Europe Burn Ointment Industry Revenue Share (%), by Depth of Burn 2025 & 2033
- Figure 26: Europe Burn Ointment Industry Volume Share (%), by Depth of Burn 2025 & 2033
- Figure 27: Europe Burn Ointment Industry Revenue (Billion), by End User 2025 & 2033
- Figure 28: Europe Burn Ointment Industry Volume (K Tons), by End User 2025 & 2033
- Figure 29: Europe Burn Ointment Industry Revenue Share (%), by End User 2025 & 2033
- Figure 30: Europe Burn Ointment Industry Volume Share (%), by End User 2025 & 2033
- Figure 31: Europe Burn Ointment Industry Revenue (Billion), by Country 2025 & 2033
- Figure 32: Europe Burn Ointment Industry Volume (K Tons), by Country 2025 & 2033
- Figure 33: Europe Burn Ointment Industry Revenue Share (%), by Country 2025 & 2033
- Figure 34: Europe Burn Ointment Industry Volume Share (%), by Country 2025 & 2033
- Figure 35: Asia Pacific Burn Ointment Industry Revenue (Billion), by Product Type 2025 & 2033
- Figure 36: Asia Pacific Burn Ointment Industry Volume (K Tons), by Product Type 2025 & 2033
- Figure 37: Asia Pacific Burn Ointment Industry Revenue Share (%), by Product Type 2025 & 2033
- Figure 38: Asia Pacific Burn Ointment Industry Volume Share (%), by Product Type 2025 & 2033
- Figure 39: Asia Pacific Burn Ointment Industry Revenue (Billion), by Depth of Burn 2025 & 2033
- Figure 40: Asia Pacific Burn Ointment Industry Volume (K Tons), by Depth of Burn 2025 & 2033
- Figure 41: Asia Pacific Burn Ointment Industry Revenue Share (%), by Depth of Burn 2025 & 2033
- Figure 42: Asia Pacific Burn Ointment Industry Volume Share (%), by Depth of Burn 2025 & 2033
- Figure 43: Asia Pacific Burn Ointment Industry Revenue (Billion), by End User 2025 & 2033
- Figure 44: Asia Pacific Burn Ointment Industry Volume (K Tons), by End User 2025 & 2033
- Figure 45: Asia Pacific Burn Ointment Industry Revenue Share (%), by End User 2025 & 2033
- Figure 46: Asia Pacific Burn Ointment Industry Volume Share (%), by End User 2025 & 2033
- Figure 47: Asia Pacific Burn Ointment Industry Revenue (Billion), by Country 2025 & 2033
- Figure 48: Asia Pacific Burn Ointment Industry Volume (K Tons), by Country 2025 & 2033
- Figure 49: Asia Pacific Burn Ointment Industry Revenue Share (%), by Country 2025 & 2033
- Figure 50: Asia Pacific Burn Ointment Industry Volume Share (%), by Country 2025 & 2033
- Figure 51: Middle East and Africa Burn Ointment Industry Revenue (Billion), by Product Type 2025 & 2033
- Figure 52: Middle East and Africa Burn Ointment Industry Volume (K Tons), by Product Type 2025 & 2033
- Figure 53: Middle East and Africa Burn Ointment Industry Revenue Share (%), by Product Type 2025 & 2033
- Figure 54: Middle East and Africa Burn Ointment Industry Volume Share (%), by Product Type 2025 & 2033
- Figure 55: Middle East and Africa Burn Ointment Industry Revenue (Billion), by Depth of Burn 2025 & 2033
- Figure 56: Middle East and Africa Burn Ointment Industry Volume (K Tons), by Depth of Burn 2025 & 2033
- Figure 57: Middle East and Africa Burn Ointment Industry Revenue Share (%), by Depth of Burn 2025 & 2033
- Figure 58: Middle East and Africa Burn Ointment Industry Volume Share (%), by Depth of Burn 2025 & 2033
- Figure 59: Middle East and Africa Burn Ointment Industry Revenue (Billion), by End User 2025 & 2033
- Figure 60: Middle East and Africa Burn Ointment Industry Volume (K Tons), by End User 2025 & 2033
- Figure 61: Middle East and Africa Burn Ointment Industry Revenue Share (%), by End User 2025 & 2033
- Figure 62: Middle East and Africa Burn Ointment Industry Volume Share (%), by End User 2025 & 2033
- Figure 63: Middle East and Africa Burn Ointment Industry Revenue (Billion), by Country 2025 & 2033
- Figure 64: Middle East and Africa Burn Ointment Industry Volume (K Tons), by Country 2025 & 2033
- Figure 65: Middle East and Africa Burn Ointment Industry Revenue Share (%), by Country 2025 & 2033
- Figure 66: Middle East and Africa Burn Ointment Industry Volume Share (%), by Country 2025 & 2033
- Figure 67: South America Burn Ointment Industry Revenue (Billion), by Product Type 2025 & 2033
- Figure 68: South America Burn Ointment Industry Volume (K Tons), by Product Type 2025 & 2033
- Figure 69: South America Burn Ointment Industry Revenue Share (%), by Product Type 2025 & 2033
- Figure 70: South America Burn Ointment Industry Volume Share (%), by Product Type 2025 & 2033
- Figure 71: South America Burn Ointment Industry Revenue (Billion), by Depth of Burn 2025 & 2033
- Figure 72: South America Burn Ointment Industry Volume (K Tons), by Depth of Burn 2025 & 2033
- Figure 73: South America Burn Ointment Industry Revenue Share (%), by Depth of Burn 2025 & 2033
- Figure 74: South America Burn Ointment Industry Volume Share (%), by Depth of Burn 2025 & 2033
- Figure 75: South America Burn Ointment Industry Revenue (Billion), by End User 2025 & 2033
- Figure 76: South America Burn Ointment Industry Volume (K Tons), by End User 2025 & 2033
- Figure 77: South America Burn Ointment Industry Revenue Share (%), by End User 2025 & 2033
- Figure 78: South America Burn Ointment Industry Volume Share (%), by End User 2025 & 2033
- Figure 79: South America Burn Ointment Industry Revenue (Billion), by Country 2025 & 2033
- Figure 80: South America Burn Ointment Industry Volume (K Tons), by Country 2025 & 2033
- Figure 81: South America Burn Ointment Industry Revenue Share (%), by Country 2025 & 2033
- Figure 82: South America Burn Ointment Industry Volume Share (%), by Country 2025 & 2033
List of Tables
- Table 1: Global Burn Ointment Industry Revenue Billion Forecast, by Product Type 2020 & 2033
- Table 2: Global Burn Ointment Industry Volume K Tons Forecast, by Product Type 2020 & 2033
- Table 3: Global Burn Ointment Industry Revenue Billion Forecast, by Depth of Burn 2020 & 2033
- Table 4: Global Burn Ointment Industry Volume K Tons Forecast, by Depth of Burn 2020 & 2033
- Table 5: Global Burn Ointment Industry Revenue Billion Forecast, by End User 2020 & 2033
- Table 6: Global Burn Ointment Industry Volume K Tons Forecast, by End User 2020 & 2033
- Table 7: Global Burn Ointment Industry Revenue Billion Forecast, by Region 2020 & 2033
- Table 8: Global Burn Ointment Industry Volume K Tons Forecast, by Region 2020 & 2033
- Table 9: Global Burn Ointment Industry Revenue Billion Forecast, by Product Type 2020 & 2033
- Table 10: Global Burn Ointment Industry Volume K Tons Forecast, by Product Type 2020 & 2033
- Table 11: Global Burn Ointment Industry Revenue Billion Forecast, by Depth of Burn 2020 & 2033
- Table 12: Global Burn Ointment Industry Volume K Tons Forecast, by Depth of Burn 2020 & 2033
- Table 13: Global Burn Ointment Industry Revenue Billion Forecast, by End User 2020 & 2033
- Table 14: Global Burn Ointment Industry Volume K Tons Forecast, by End User 2020 & 2033
- Table 15: Global Burn Ointment Industry Revenue Billion Forecast, by Country 2020 & 2033
- Table 16: Global Burn Ointment Industry Volume K Tons Forecast, by Country 2020 & 2033
- Table 17: United States Burn Ointment Industry Revenue (Billion) Forecast, by Application 2020 & 2033
- Table 18: United States Burn Ointment Industry Volume (K Tons) Forecast, by Application 2020 & 2033
- Table 19: Canada Burn Ointment Industry Revenue (Billion) Forecast, by Application 2020 & 2033
- Table 20: Canada Burn Ointment Industry Volume (K Tons) Forecast, by Application 2020 & 2033
- Table 21: Mexico Burn Ointment Industry Revenue (Billion) Forecast, by Application 2020 & 2033
- Table 22: Mexico Burn Ointment Industry Volume (K Tons) Forecast, by Application 2020 & 2033
- Table 23: Global Burn Ointment Industry Revenue Billion Forecast, by Product Type 2020 & 2033
- Table 24: Global Burn Ointment Industry Volume K Tons Forecast, by Product Type 2020 & 2033
- Table 25: Global Burn Ointment Industry Revenue Billion Forecast, by Depth of Burn 2020 & 2033
- Table 26: Global Burn Ointment Industry Volume K Tons Forecast, by Depth of Burn 2020 & 2033
- Table 27: Global Burn Ointment Industry Revenue Billion Forecast, by End User 2020 & 2033
- Table 28: Global Burn Ointment Industry Volume K Tons Forecast, by End User 2020 & 2033
- Table 29: Global Burn Ointment Industry Revenue Billion Forecast, by Country 2020 & 2033
- Table 30: Global Burn Ointment Industry Volume K Tons Forecast, by Country 2020 & 2033
- Table 31: Germany Burn Ointment Industry Revenue (Billion) Forecast, by Application 2020 & 2033
- Table 32: Germany Burn Ointment Industry Volume (K Tons) Forecast, by Application 2020 & 2033
- Table 33: United Kingdom Burn Ointment Industry Revenue (Billion) Forecast, by Application 2020 & 2033
- Table 34: United Kingdom Burn Ointment Industry Volume (K Tons) Forecast, by Application 2020 & 2033
- Table 35: France Burn Ointment Industry Revenue (Billion) Forecast, by Application 2020 & 2033
- Table 36: France Burn Ointment Industry Volume (K Tons) Forecast, by Application 2020 & 2033
- Table 37: Italy Burn Ointment Industry Revenue (Billion) Forecast, by Application 2020 & 2033
- Table 38: Italy Burn Ointment Industry Volume (K Tons) Forecast, by Application 2020 & 2033
- Table 39: Spain Burn Ointment Industry Revenue (Billion) Forecast, by Application 2020 & 2033
- Table 40: Spain Burn Ointment Industry Volume (K Tons) Forecast, by Application 2020 & 2033
- Table 41: Rest of Europe Burn Ointment Industry Revenue (Billion) Forecast, by Application 2020 & 2033
- Table 42: Rest of Europe Burn Ointment Industry Volume (K Tons) Forecast, by Application 2020 & 2033
- Table 43: Global Burn Ointment Industry Revenue Billion Forecast, by Product Type 2020 & 2033
- Table 44: Global Burn Ointment Industry Volume K Tons Forecast, by Product Type 2020 & 2033
- Table 45: Global Burn Ointment Industry Revenue Billion Forecast, by Depth of Burn 2020 & 2033
- Table 46: Global Burn Ointment Industry Volume K Tons Forecast, by Depth of Burn 2020 & 2033
- Table 47: Global Burn Ointment Industry Revenue Billion Forecast, by End User 2020 & 2033
- Table 48: Global Burn Ointment Industry Volume K Tons Forecast, by End User 2020 & 2033
- Table 49: Global Burn Ointment Industry Revenue Billion Forecast, by Country 2020 & 2033
- Table 50: Global Burn Ointment Industry Volume K Tons Forecast, by Country 2020 & 2033
- Table 51: China Burn Ointment Industry Revenue (Billion) Forecast, by Application 2020 & 2033
- Table 52: China Burn Ointment Industry Volume (K Tons) Forecast, by Application 2020 & 2033
- Table 53: Japan Burn Ointment Industry Revenue (Billion) Forecast, by Application 2020 & 2033
- Table 54: Japan Burn Ointment Industry Volume (K Tons) Forecast, by Application 2020 & 2033
- Table 55: India Burn Ointment Industry Revenue (Billion) Forecast, by Application 2020 & 2033
- Table 56: India Burn Ointment Industry Volume (K Tons) Forecast, by Application 2020 & 2033
- Table 57: Australia Burn Ointment Industry Revenue (Billion) Forecast, by Application 2020 & 2033
- Table 58: Australia Burn Ointment Industry Volume (K Tons) Forecast, by Application 2020 & 2033
- Table 59: South Korea Burn Ointment Industry Revenue (Billion) Forecast, by Application 2020 & 2033
- Table 60: South Korea Burn Ointment Industry Volume (K Tons) Forecast, by Application 2020 & 2033
- Table 61: Rest of Asia Pacific Burn Ointment Industry Revenue (Billion) Forecast, by Application 2020 & 2033
- Table 62: Rest of Asia Pacific Burn Ointment Industry Volume (K Tons) Forecast, by Application 2020 & 2033
- Table 63: Global Burn Ointment Industry Revenue Billion Forecast, by Product Type 2020 & 2033
- Table 64: Global Burn Ointment Industry Volume K Tons Forecast, by Product Type 2020 & 2033
- Table 65: Global Burn Ointment Industry Revenue Billion Forecast, by Depth of Burn 2020 & 2033
- Table 66: Global Burn Ointment Industry Volume K Tons Forecast, by Depth of Burn 2020 & 2033
- Table 67: Global Burn Ointment Industry Revenue Billion Forecast, by End User 2020 & 2033
- Table 68: Global Burn Ointment Industry Volume K Tons Forecast, by End User 2020 & 2033
- Table 69: Global Burn Ointment Industry Revenue Billion Forecast, by Country 2020 & 2033
- Table 70: Global Burn Ointment Industry Volume K Tons Forecast, by Country 2020 & 2033
- Table 71: GCC Burn Ointment Industry Revenue (Billion) Forecast, by Application 2020 & 2033
- Table 72: GCC Burn Ointment Industry Volume (K Tons) Forecast, by Application 2020 & 2033
- Table 73: South Africa Burn Ointment Industry Revenue (Billion) Forecast, by Application 2020 & 2033
- Table 74: South Africa Burn Ointment Industry Volume (K Tons) Forecast, by Application 2020 & 2033
- Table 75: Rest of Middle East and Africa Burn Ointment Industry Revenue (Billion) Forecast, by Application 2020 & 2033
- Table 76: Rest of Middle East and Africa Burn Ointment Industry Volume (K Tons) Forecast, by Application 2020 & 2033
- Table 77: Global Burn Ointment Industry Revenue Billion Forecast, by Product Type 2020 & 2033
- Table 78: Global Burn Ointment Industry Volume K Tons Forecast, by Product Type 2020 & 2033
- Table 79: Global Burn Ointment Industry Revenue Billion Forecast, by Depth of Burn 2020 & 2033
- Table 80: Global Burn Ointment Industry Volume K Tons Forecast, by Depth of Burn 2020 & 2033
- Table 81: Global Burn Ointment Industry Revenue Billion Forecast, by End User 2020 & 2033
- Table 82: Global Burn Ointment Industry Volume K Tons Forecast, by End User 2020 & 2033
- Table 83: Global Burn Ointment Industry Revenue Billion Forecast, by Country 2020 & 2033
- Table 84: Global Burn Ointment Industry Volume K Tons Forecast, by Country 2020 & 2033
- Table 85: Brazil Burn Ointment Industry Revenue (Billion) Forecast, by Application 2020 & 2033
- Table 86: Brazil Burn Ointment Industry Volume (K Tons) Forecast, by Application 2020 & 2033
- Table 87: Argentina Burn Ointment Industry Revenue (Billion) Forecast, by Application 2020 & 2033
- Table 88: Argentina Burn Ointment Industry Volume (K Tons) Forecast, by Application 2020 & 2033
- Table 89: Rest of South America Burn Ointment Industry Revenue (Billion) Forecast, by Application 2020 & 2033
- Table 90: Rest of South America Burn Ointment Industry Volume (K Tons) Forecast, by Application 2020 & 2033
Frequently Asked Questions
1. What is the projected Compound Annual Growth Rate (CAGR) of the Burn Ointment Industry?
The projected CAGR is approximately 5.95%.
2. Which companies are prominent players in the Burn Ointment Industry?
Key companies in the market include Smith & Nephew PLC, Perrigo Company PLC, DeRoyal Industries Inc, Intergra LifeSciences, 3M, ConvaTec Group PLC, Dr Morepen, Mankind Pharma, Cardinal Health, Cipla Limited, Trio Lifescience Pvt Ltd, Johnson & Johnson, Sun Pharmaceutical Industries Ltd (Ranbaxy Laboratories Limited), GlaxoSmithKline PLC, Pfizer Inc.
3. What are the main segments of the Burn Ointment Industry?
The market segments include Product Type, Depth of Burn, End User.
4. Can you provide details about the market size?
The market size is estimated to be USD 1.1 Billion as of 2022.
5. What are some drivers contributing to market growth?
Rising Incidences of Burn; Increasing Awareness Regarding Treatment Options.
6. What are the notable trends driving market growth?
The Topical Antibiotics Segment is Expected to Hold a Significant Market Share Over the Forecast Period.
7. Are there any restraints impacting market growth?
Side Effects Associated with Burn Ointment.
8. Can you provide examples of recent developments in the market?
In May 2022, Molncyke Healthcare sunmitted the clinical evidence in Wound International 2022 on the use of Mediplex Ag for the management of partial thickness burns. The soft silicone wound contact layer in Mediplex designed to help minimise wound and peri-wound trauma and associated pain aided in the burn healing.
9. What pricing options are available for accessing the report?
Pricing options include single-user, multi-user, and enterprise licenses priced at USD 4750, USD 5250, and USD 8750 respectively.
10. Is the market size provided in terms of value or volume?
The market size is provided in terms of value, measured in Billion and volume, measured in K Tons.
11. Are there any specific market keywords associated with the report?
Yes, the market keyword associated with the report is "Burn Ointment Industry," which aids in identifying and referencing the specific market segment covered.
12. How do I determine which pricing option suits my needs best?
The pricing options vary based on user requirements and access needs. Individual users may opt for single-user licenses, while businesses requiring broader access may choose multi-user or enterprise licenses for cost-effective access to the report.
13. Are there any additional resources or data provided in the Burn Ointment Industry report?
While the report offers comprehensive insights, it's advisable to review the specific contents or supplementary materials provided to ascertain if additional resources or data are available.
14. How can I stay updated on further developments or reports in the Burn Ointment Industry?
To stay informed about further developments, trends, and reports in the Burn Ointment Industry, consider subscribing to industry newsletters, following relevant companies and organizations, or regularly checking reputable industry news sources and publications.
Methodology
Step 1 - Identification of Relevant Samples Size from Population Database


Step 2 - Approaches for Defining Global Market Size (Value, Volume* & Price*)

Note*: In applicable scenarios
Step 3 - Data Sources
Primary Research
- Web Analytics
- Survey Reports
- Research Institute
- Latest Research Reports
- Opinion Leaders
Secondary Research
- Annual Reports
- White Paper
- Latest Press Release
- Industry Association
- Paid Database
- Investor Presentations

Step 4 - Data Triangulation
Involves using different sources of information in order to increase the validity of a study
These sources are likely to be stakeholders in a program - participants, other researchers, program staff, other community members, and so on.
Then we put all data in single framework & apply various statistical tools to find out the dynamic on the market.
During the analysis stage, feedback from the stakeholder groups would be compared to determine areas of agreement as well as areas of divergence