

Key Insights
The global Photopheresis Products Market is poised for significant growth, projected to reach $342.86 million in 2025. This expansion is driven by an anticipated Compound Annual Growth Rate (CAGR) of 5.6% from 2025 to 2033, indicating robust demand for photopheresis solutions. The increasing prevalence of chronic and autoimmune diseases, coupled with advancements in therapeutic technologies, are key factors propelling the market forward. Specifically, the growing application of photopheresis in managing Graft versus Host Disease (GvHD), Cutaneous T-Cell Lymphoma (CTCL), transplant rejections, and various autoimmune conditions is a major market stimulant. Furthermore, technological innovations leading to more efficient and patient-friendly photopheresis devices and consumables are expected to enhance accessibility and adoption rates across healthcare settings.

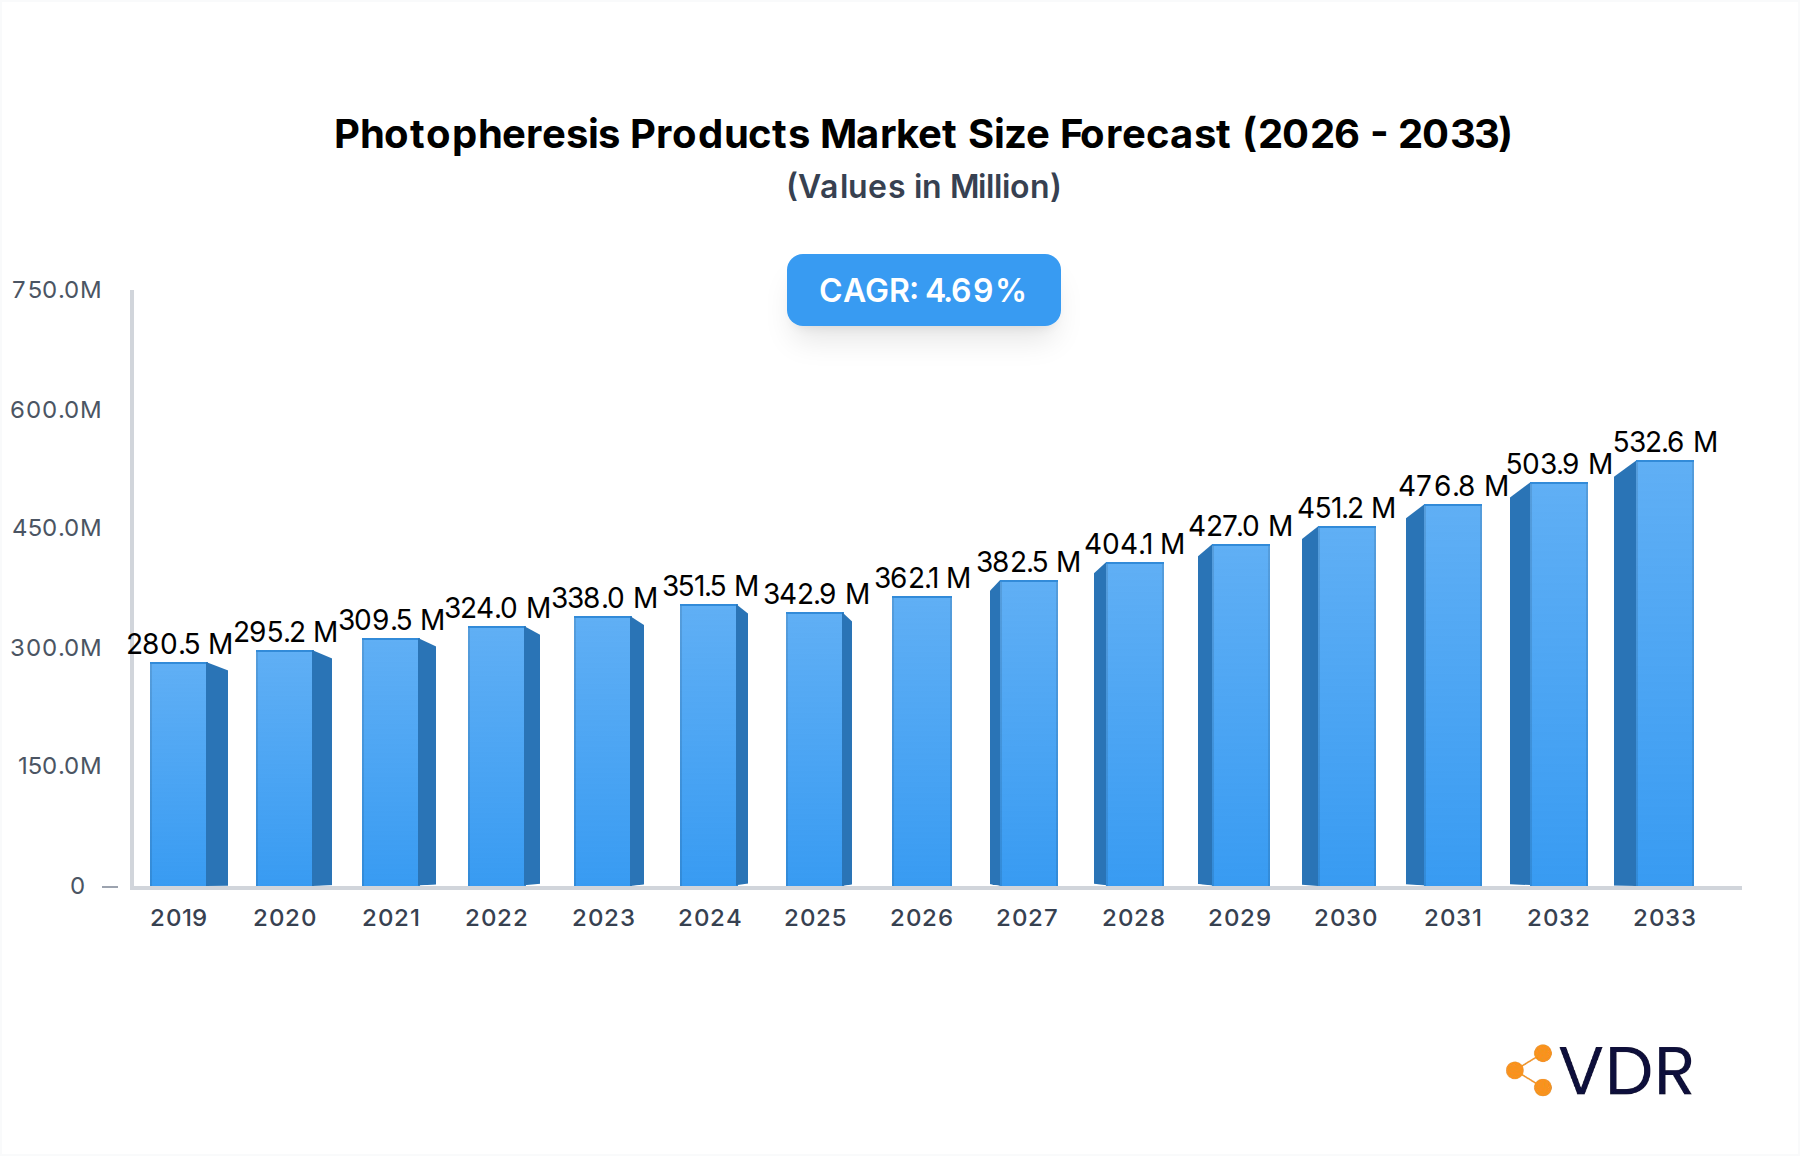
Photopheresis Products Market Market Size (In Million)
The market is segmented into distinct product types: Open System and Closed System photopheresis. While both segments cater to specific clinical needs, the Closed System is likely to witness substantial growth due to its enhanced safety features and reduced risk of infection. In terms of application, GvHD and CTCL are significant contributors to market revenue, reflecting the critical role of photopheresis in managing these complex conditions. Hospitals and Ambulatory Centers represent the primary end-user segments, with a growing trend towards outpatient photopheresis treatments. Geographically, North America and Europe are expected to maintain their dominant positions, driven by established healthcare infrastructures and high adoption rates of advanced medical technologies. However, the Asia Pacific region is anticipated to emerge as a high-growth market due to increasing healthcare expenditure and a rising patient pool. Leading companies like Terumo Corporation and Fresenius Kabi AG are actively investing in research and development, further shaping the market's trajectory.
Photopheresis Products Market Company Market Share
This in-depth report provides a comprehensive analysis of the global photopheresis products market, exploring its intricate dynamics, growth trajectory, and future outlook. The study leverages extensive primary and secondary research to deliver actionable insights for stakeholders, including manufacturers, healthcare providers, and investors. The market is segmented by product type, application, and end-user, with a detailed examination of key industry developments and leading players. The report forecasts the market to reach XX million units by 2033, exhibiting a robust CAGR of XX% during the forecast period.
Photopheresis Products Market Dynamics & Structure
The photopheresis products market exhibits a moderate level of concentration, with key players continually investing in technological innovation and strategic expansions. The market is primarily driven by advancements in apheresis technology, leading to more efficient and patient-friendly treatment delivery. Regulatory frameworks, particularly those surrounding medical devices and therapeutic procedures, play a significant role in shaping market access and product development. Competitive product substitutes, while present in broader hematology and oncology treatment landscapes, are less direct due to the specialized nature of photopheresis. End-user demographics, characterized by an aging population and a rising incidence of target diseases, fuel market demand. Mergers and acquisitions (M&A) are also a notable trend, as companies seek to consolidate their market position and expand their product portfolios.
- Technological Innovation Drivers: Development of closed-system photopheresis devices, enhanced UV light delivery mechanisms, and improved anticoagulation protocols.
- Regulatory Frameworks: Stringent FDA, EMA, and other regional approvals for medical devices and therapeutic applications, influencing product lifecycle and market entry.
- Competitive Product Substitutes: Broadly, treatments for graft-versus-host disease (GVHD), cutaneous T-cell lymphoma (CTCL), and autoimmune disorders, but direct substitutes for the photopheresis procedure itself are limited.
- End-User Demographics: Increasing prevalence of chronic and autoimmune diseases, coupled with an aging global population requiring specialized therapies.
- M&A Trends: Strategic acquisitions by larger medical device companies to gain access to niche photopheresis technologies and expand patient reach. For instance, the acquisition of specialized apheresis technology providers.
Photopheresis Products Market Growth Trends & Insights
The photopheresis products market is poised for significant expansion driven by a confluence of factors, including an increasing global burden of diseases treated by this therapy and continuous technological advancements. The market size evolution is directly correlated with the rising adoption rates of photopheresis as a frontline or adjunctive therapy for conditions like Graft versus Host Disease (GVHD) and Cutaneous T-Cell Lymphoma (CTCL). Technological disruptions are continuously enhancing the efficiency, safety, and patient comfort of photopheresis procedures. The development of closed-system devices has been a major catalyst, minimizing risks of infection and simplifying the process for both clinicians and patients. Furthermore, consumer behavior shifts are leaning towards less invasive and more targeted therapeutic approaches, directly benefiting photopheresis.
The market penetration of photopheresis is steadily increasing, particularly in developed nations with advanced healthcare infrastructures and higher healthcare spending. This growth is further propelled by growing awareness among healthcare professionals regarding the efficacy of photopheresis for specific indications. For example, the market has witnessed a substantial increase in the utilization of extracorporeal photopheresis (ECP) for managing steroid-refractory chronic GVHD, a debilitating complication following allogeneic stem cell transplantation. The market size, estimated at XX million units in the base year of 2025, is projected to grow at a Compound Annual Growth Rate (CAGR) of XX% during the forecast period (2025–2033). This growth trajectory is supported by ongoing research and clinical trials exploring new applications of photopheresis, further expanding its therapeutic horizon. The shift towards personalized medicine also plays a crucial role, as photopheresis offers a targeted immunomodulatory approach. The increasing number of hospitals and ambulatory centers investing in apheresis units underscores the growing acceptance and demand for photopheresis therapies.
Dominant Regions, Countries, or Segments in Photopheresis Products Market
The photopheresis products market is experiencing robust growth across various segments, with North America currently leading in terms of market share and adoption rates, driven by a high prevalence of target diseases and advanced healthcare infrastructure. Within North America, the United States stands out due to its well-established reimbursement policies for advanced therapies and a strong research and development ecosystem. This dominance is further bolstered by a high concentration of specialized treatment centers and a proactive approach to adopting innovative medical technologies. The economic policies in the region, including government initiatives promoting healthcare access and technological innovation, have created a conducive environment for market expansion.
- Dominant Region: North America
- Key Drivers: High incidence of CTCL and GVHD, extensive research and clinical trials, favorable reimbursement policies, and a high density of specialized apheresis centers.
- Market Share & Growth Potential: North America is estimated to hold over XX% of the global photopheresis products market share, with a projected growth rate of XX% during the forecast period. The region's investment in R&D for new applications and continuous technological upgrades in apheresis devices contribute to its sustained leadership.
- Dominant Country: United States
- Infrastructure: Advanced healthcare facilities, including major academic medical centers and specialized transplant centers, are well-equipped to perform photopheresis.
- Economic Policies: Government funding for medical research and development, coupled with private sector investments, fuels innovation and market growth.
- Dominant Segment (Product Type): Closed System
- Rationale: Closed systems offer enhanced safety, reduced risk of contamination, and improved patient comfort compared to open systems, leading to higher adoption in clinical settings. The THERAKOS CELLEX Photopheresis System, for example, represents a significant advancement in closed-system technology, improving treatment efficacy and workflow.
- Dominant Segment (Application): Graft versus Host Disease (GVHD)
- Rationale: GVHD remains a critical complication of allogeneic stem cell transplantation, and photopheresis has emerged as a cornerstone therapy for its management, particularly in steroid-refractory cases. The efficacy and increasing acceptance of photopheresis in preventing and treating GVHD contribute significantly to its dominance.
- Dominant Segment (End User): Hospitals
- Rationale: Hospitals, especially those with dedicated apheresis units and transplant centers, are the primary providers of photopheresis therapy due to the complexity of the procedure and the need for specialized medical staff and intensive care facilities.
Photopheresis Products Market Product Landscape
The photopheresis products market is characterized by ongoing product innovation focused on enhancing therapeutic efficacy, patient safety, and procedural convenience. Key advancements include the development of sophisticated closed-system photopheresis devices that integrate apheresis, UV light exposure, and reinfusion into a single, streamlined process. These systems, such as the THERAKOS CELLEX Photopheresis System, minimize the risk of infection and reduce treatment time. Innovations in UV light delivery mechanisms ensure precise and effective photoactivation of the administered photoactive drug. Furthermore, manufacturers are focusing on developing user-friendly interfaces and automated features to optimize workflow in clinical settings, thereby increasing the overall adoption of photopheresis.
Key Drivers, Barriers & Challenges in Photopheresis Products Market
The photopheresis products market is propelled by several key drivers. The increasing incidence of Graft versus Host Disease (GVHD) and Cutaneous T-Cell Lymphoma (CTCL), coupled with the growing adoption of photopheresis as a standard treatment for these conditions, is a primary growth catalyst. Technological advancements in apheresis devices, leading to more efficient and patient-friendly procedures, further fuel market expansion. The expanding applications of photopheresis in treating autoimmune diseases and transplant rejections also contribute to its growth.
Conversely, the market faces significant barriers and challenges. High initial costs associated with acquiring photopheresis equipment and the ongoing operational expenses can be a deterrent, particularly for smaller healthcare facilities. Limited reimbursement coverage in certain regions and for specific indications can also hinder market growth. Furthermore, the need for specialized training for healthcare professionals to operate the equipment and administer the therapy presents a challenge. Supply chain disruptions and regulatory hurdles in obtaining approvals for new devices and indications can also impede market progress. Competitive pressures from alternative therapies, although less direct, also warrant consideration.
Emerging Opportunities in Photopheresis Products Market
Emerging opportunities in the photopheresis products market lie in the exploration of novel therapeutic applications. Research into the efficacy of photopheresis for a wider range of autoimmune diseases, such as multiple sclerosis and rheumatoid arthritis, presents a significant untapped market. The expansion of photopheresis into emerging economies, where healthcare infrastructure is developing, offers substantial growth potential. Advancements in personalized medicine, enabling tailored photopheresis protocols based on individual patient responses, could further enhance treatment outcomes and market demand. The development of more portable and cost-effective photopheresis devices could also broaden access to this therapy.
Growth Accelerators in the Photopheresis Products Market Industry
Several factors are accelerating the growth of the photopheresis products market. Continuous technological breakthroughs in apheresis technology, including enhanced UV light delivery systems and integrated closed-loop processes, are making photopheresis more efficient and accessible. Strategic partnerships between photopheresis device manufacturers and pharmaceutical companies developing photoactive drugs are crucial for synergistic market expansion. Furthermore, market expansion strategies, including increased awareness campaigns targeted at healthcare professionals and patient advocacy groups, are playing a vital role in driving adoption. The growing body of clinical evidence demonstrating the efficacy of photopheresis in managing complex diseases is a significant growth accelerator.
Key Players Shaping the Photopheresis Products Market Market
- Macopharma
- Terumo Corporation
- Fresenius Kabi AG
- PIT Medical Systems
- Haemonetics Corporation
- Mallinckrodt Pharmaceuticals
Notable Milestones in Photopheresis Products Market Sector
- September 2022: UAE opened a new apheresis unit in the Sheikh Shakhbout Medical City (SSMC) as a collaboration between Abu Dhabi Health Services Company (SEHA) and Mayo Clinic, widening the treatment scope for diseases, including rare lymphoma of the skin.
- August 2022: Ikaria Australia Pty Ltd, a Mallinckrodt Pharmaceuticals company, launched THERAKOS CELLEX Photopheresis System to the Australian market. The CELLEX instrument performs the extraction, treatment, and reinfusion of white blood cells for an integrated, closed photopheresis procedure.
In-Depth Photopheresis Products Market Market Outlook
The photopheresis products market is poised for substantial future growth, driven by ongoing advancements in therapeutic applications and device technology. The increasing global burden of Graft versus Host Disease (GVHD) and Cutaneous T-Cell Lymphoma (CTCL) will continue to be a primary demand driver. Strategic initiatives by key players to expand their product portfolios and geographic reach, coupled with increasing investments in research and development, will further fuel market expansion. The growing awareness of photopheresis's efficacy in managing a broader spectrum of autoimmune disorders presents significant untapped potential. The market's future trajectory will also be shaped by evolving reimbursement policies and the development of more cost-effective solutions, making photopheresis accessible to a wider patient population worldwide.
Photopheresis Products Market Segmentation
-
1. Product Type
- 1.1. Open System
- 1.2. Closed System
-
2. Application
- 2.1. Graft versus Host Disease
- 2.2. Cutaneous T-Cell Lymphoma
- 2.3. Transplant Rejections
- 2.4. Autoimmune Diseases
-
3. End User
- 3.1. Hospitals
- 3.2. Ambulatory Centers
- 3.3. Other End Users
Photopheresis Products Market Segmentation By Geography
-
1. North America
- 1.1. United States
- 1.2. Canada
- 1.3. Mexico
-
2. Europe
- 2.1. Germany
- 2.2. United Kingdom
- 2.3. France
- 2.4. Italy
- 2.5. Spain
- 2.6. Rest of Europe
-
3. Asia Pacific
- 3.1. China
- 3.2. Japan
- 3.3. India
- 3.4. Australia
- 3.5. South Korea
- 3.6. Rest of Asia Pacific
-
4. Middle East and Africa
- 4.1. GCC
- 4.2. South Africa
- 4.3. Rest of Middle East and Africa
-
5. South America
- 5.1. Brazil
- 5.2. Argentina
- 5.3. Rest of South America

Photopheresis Products Market Regional Market Share
Geographic Coverage of Photopheresis Products Market
Photopheresis Products Market REPORT HIGHLIGHTS
| Aspects | Details |
|---|---|
| Study Period | 2020-2034 |
| Base Year | 2025 |
| Estimated Year | 2026 |
| Forecast Period | 2026-2034 |
| Historical Period | 2020-2025 |
| Growth Rate | CAGR of 5.6% from 2020-2034 |
| Segmentation |
|
Table of Contents
- 1. Introduction
- 1.1. Research Scope
- 1.2. Market Segmentation
- 1.3. Research Objective
- 1.4. Definitions and Assumptions
- 2. Executive Summary
- 2.1. Market Snapshot
- 3. Market Dynamics
- 3.1. Market Drivers
- 3.2. Market Restrains
- 3.3. Market Trends
- 3.4. Market Opportunities
- 4. Market Factor Analysis
- 4.1. Porters Five Forces
- 4.1.1. Bargaining Power of Suppliers
- 4.1.2. Bargaining Power of Buyers
- 4.1.3. Threat of New Entrants
- 4.1.4. Threat of Substitutes
- 4.1.5. Competitive Rivalry
- 4.2. PESTEL analysis
- 4.3. BCG Analysis
- 4.3.1. Stars (High Growth, High Market Share)
- 4.3.2. Cash Cows (Low Growth, High Market Share)
- 4.3.3. Question Mark (High Growth, Low Market Share)
- 4.3.4. Dogs (Low Growth, Low Market Share)
- 4.4. Ansoff Matrix Analysis
- 4.5. Supply Chain Analysis
- 4.6. Regulatory Landscape
- 4.7. Current Market Potential and Opportunity Assessment (TAM–SAM–SOM Framework)
- 4.8. VDR Analyst Note
- 4.1. Porters Five Forces
- 5. Market Analysis, Insights and Forecast 2021-2033
- 5.1. Market Analysis, Insights and Forecast - by Product Type
- 5.1.1. Open System
- 5.1.2. Closed System
- 5.2. Market Analysis, Insights and Forecast - by Application
- 5.2.1. Graft versus Host Disease
- 5.2.2. Cutaneous T-Cell Lymphoma
- 5.2.3. Transplant Rejections
- 5.2.4. Autoimmune Diseases
- 5.3. Market Analysis, Insights and Forecast - by End User
- 5.3.1. Hospitals
- 5.3.2. Ambulatory Centers
- 5.3.3. Other End Users
- 5.4. Market Analysis, Insights and Forecast - by Region
- 5.4.1. North America
- 5.4.2. Europe
- 5.4.3. Asia Pacific
- 5.4.4. Middle East and Africa
- 5.4.5. South America
- 5.1. Market Analysis, Insights and Forecast - by Product Type
- 6. Global Photopheresis Products Market Analysis, Insights and Forecast, 2021-2033
- 6.1. Market Analysis, Insights and Forecast - by Product Type
- 6.1.1. Open System
- 6.1.2. Closed System
- 6.2. Market Analysis, Insights and Forecast - by Application
- 6.2.1. Graft versus Host Disease
- 6.2.2. Cutaneous T-Cell Lymphoma
- 6.2.3. Transplant Rejections
- 6.2.4. Autoimmune Diseases
- 6.3. Market Analysis, Insights and Forecast - by End User
- 6.3.1. Hospitals
- 6.3.2. Ambulatory Centers
- 6.3.3. Other End Users
- 6.1. Market Analysis, Insights and Forecast - by Product Type
- 7. North America Photopheresis Products Market Analysis, Insights and Forecast, 2021-2033
- 7.1. Market Analysis, Insights and Forecast - by Product Type
- 7.1.1. Open System
- 7.1.2. Closed System
- 7.2. Market Analysis, Insights and Forecast - by Application
- 7.2.1. Graft versus Host Disease
- 7.2.2. Cutaneous T-Cell Lymphoma
- 7.2.3. Transplant Rejections
- 7.2.4. Autoimmune Diseases
- 7.3. Market Analysis, Insights and Forecast - by End User
- 7.3.1. Hospitals
- 7.3.2. Ambulatory Centers
- 7.3.3. Other End Users
- 7.1. Market Analysis, Insights and Forecast - by Product Type
- 8. Europe Photopheresis Products Market Analysis, Insights and Forecast, 2021-2033
- 8.1. Market Analysis, Insights and Forecast - by Product Type
- 8.1.1. Open System
- 8.1.2. Closed System
- 8.2. Market Analysis, Insights and Forecast - by Application
- 8.2.1. Graft versus Host Disease
- 8.2.2. Cutaneous T-Cell Lymphoma
- 8.2.3. Transplant Rejections
- 8.2.4. Autoimmune Diseases
- 8.3. Market Analysis, Insights and Forecast - by End User
- 8.3.1. Hospitals
- 8.3.2. Ambulatory Centers
- 8.3.3. Other End Users
- 8.1. Market Analysis, Insights and Forecast - by Product Type
- 9. Asia Pacific Photopheresis Products Market Analysis, Insights and Forecast, 2021-2033
- 9.1. Market Analysis, Insights and Forecast - by Product Type
- 9.1.1. Open System
- 9.1.2. Closed System
- 9.2. Market Analysis, Insights and Forecast - by Application
- 9.2.1. Graft versus Host Disease
- 9.2.2. Cutaneous T-Cell Lymphoma
- 9.2.3. Transplant Rejections
- 9.2.4. Autoimmune Diseases
- 9.3. Market Analysis, Insights and Forecast - by End User
- 9.3.1. Hospitals
- 9.3.2. Ambulatory Centers
- 9.3.3. Other End Users
- 9.1. Market Analysis, Insights and Forecast - by Product Type
- 10. Middle East and Africa Photopheresis Products Market Analysis, Insights and Forecast, 2021-2033
- 10.1. Market Analysis, Insights and Forecast - by Product Type
- 10.1.1. Open System
- 10.1.2. Closed System
- 10.2. Market Analysis, Insights and Forecast - by Application
- 10.2.1. Graft versus Host Disease
- 10.2.2. Cutaneous T-Cell Lymphoma
- 10.2.3. Transplant Rejections
- 10.2.4. Autoimmune Diseases
- 10.3. Market Analysis, Insights and Forecast - by End User
- 10.3.1. Hospitals
- 10.3.2. Ambulatory Centers
- 10.3.3. Other End Users
- 10.1. Market Analysis, Insights and Forecast - by Product Type
- 11. South America Photopheresis Products Market Analysis, Insights and Forecast, 2021-2033
- 11.1. Market Analysis, Insights and Forecast - by Product Type
- 11.1.1. Open System
- 11.1.2. Closed System
- 11.2. Market Analysis, Insights and Forecast - by Application
- 11.2.1. Graft versus Host Disease
- 11.2.2. Cutaneous T-Cell Lymphoma
- 11.2.3. Transplant Rejections
- 11.2.4. Autoimmune Diseases
- 11.3. Market Analysis, Insights and Forecast - by End User
- 11.3.1. Hospitals
- 11.3.2. Ambulatory Centers
- 11.3.3. Other End Users
- 11.1. Market Analysis, Insights and Forecast - by Product Type
- 12. Competitive Analysis
- 12.1. Company Profiles
- 12.1.1 Macopharma
- 12.1.1.1. Company Overview
- 12.1.1.2. Products
- 12.1.1.3. Company Financials
- 12.1.1.4. SWOT Analysis
- 12.1.2 Terumo Corporation*List Not Exhaustive
- 12.1.2.1. Company Overview
- 12.1.2.2. Products
- 12.1.2.3. Company Financials
- 12.1.2.4. SWOT Analysis
- 12.1.3 Fresenius Kabi AG
- 12.1.3.1. Company Overview
- 12.1.3.2. Products
- 12.1.3.3. Company Financials
- 12.1.3.4. SWOT Analysis
- 12.1.4 PIT Medical Systems
- 12.1.4.1. Company Overview
- 12.1.4.2. Products
- 12.1.4.3. Company Financials
- 12.1.4.4. SWOT Analysis
- 12.1.5 Haemonetics Corporation
- 12.1.5.1. Company Overview
- 12.1.5.2. Products
- 12.1.5.3. Company Financials
- 12.1.5.4. SWOT Analysis
- 12.1.6 Mallinckrodt Pharmaceuticals
- 12.1.6.1. Company Overview
- 12.1.6.2. Products
- 12.1.6.3. Company Financials
- 12.1.6.4. SWOT Analysis
- 12.1.1 Macopharma
- 12.2. Market Entropy
- 12.2.1 Company's Key Areas Served
- 12.2.2 Recent Developments
- 12.3. Company Market Share Analysis 2025
- 12.3.1 Top 5 Companies Market Share Analysis
- 12.3.2 Top 3 Companies Market Share Analysis
- 12.4. List of Potential Customers
- 13. Research Methodology
List of Figures
- Figure 1: Global Photopheresis Products Market Revenue Breakdown (million, %) by Region 2025 & 2033
- Figure 2: North America Photopheresis Products Market Revenue (million), by Product Type 2025 & 2033
- Figure 3: North America Photopheresis Products Market Revenue Share (%), by Product Type 2025 & 2033
- Figure 4: North America Photopheresis Products Market Revenue (million), by Application 2025 & 2033
- Figure 5: North America Photopheresis Products Market Revenue Share (%), by Application 2025 & 2033
- Figure 6: North America Photopheresis Products Market Revenue (million), by End User 2025 & 2033
- Figure 7: North America Photopheresis Products Market Revenue Share (%), by End User 2025 & 2033
- Figure 8: North America Photopheresis Products Market Revenue (million), by Country 2025 & 2033
- Figure 9: North America Photopheresis Products Market Revenue Share (%), by Country 2025 & 2033
- Figure 10: Europe Photopheresis Products Market Revenue (million), by Product Type 2025 & 2033
- Figure 11: Europe Photopheresis Products Market Revenue Share (%), by Product Type 2025 & 2033
- Figure 12: Europe Photopheresis Products Market Revenue (million), by Application 2025 & 2033
- Figure 13: Europe Photopheresis Products Market Revenue Share (%), by Application 2025 & 2033
- Figure 14: Europe Photopheresis Products Market Revenue (million), by End User 2025 & 2033
- Figure 15: Europe Photopheresis Products Market Revenue Share (%), by End User 2025 & 2033
- Figure 16: Europe Photopheresis Products Market Revenue (million), by Country 2025 & 2033
- Figure 17: Europe Photopheresis Products Market Revenue Share (%), by Country 2025 & 2033
- Figure 18: Asia Pacific Photopheresis Products Market Revenue (million), by Product Type 2025 & 2033
- Figure 19: Asia Pacific Photopheresis Products Market Revenue Share (%), by Product Type 2025 & 2033
- Figure 20: Asia Pacific Photopheresis Products Market Revenue (million), by Application 2025 & 2033
- Figure 21: Asia Pacific Photopheresis Products Market Revenue Share (%), by Application 2025 & 2033
- Figure 22: Asia Pacific Photopheresis Products Market Revenue (million), by End User 2025 & 2033
- Figure 23: Asia Pacific Photopheresis Products Market Revenue Share (%), by End User 2025 & 2033
- Figure 24: Asia Pacific Photopheresis Products Market Revenue (million), by Country 2025 & 2033
- Figure 25: Asia Pacific Photopheresis Products Market Revenue Share (%), by Country 2025 & 2033
- Figure 26: Middle East and Africa Photopheresis Products Market Revenue (million), by Product Type 2025 & 2033
- Figure 27: Middle East and Africa Photopheresis Products Market Revenue Share (%), by Product Type 2025 & 2033
- Figure 28: Middle East and Africa Photopheresis Products Market Revenue (million), by Application 2025 & 2033
- Figure 29: Middle East and Africa Photopheresis Products Market Revenue Share (%), by Application 2025 & 2033
- Figure 30: Middle East and Africa Photopheresis Products Market Revenue (million), by End User 2025 & 2033
- Figure 31: Middle East and Africa Photopheresis Products Market Revenue Share (%), by End User 2025 & 2033
- Figure 32: Middle East and Africa Photopheresis Products Market Revenue (million), by Country 2025 & 2033
- Figure 33: Middle East and Africa Photopheresis Products Market Revenue Share (%), by Country 2025 & 2033
- Figure 34: South America Photopheresis Products Market Revenue (million), by Product Type 2025 & 2033
- Figure 35: South America Photopheresis Products Market Revenue Share (%), by Product Type 2025 & 2033
- Figure 36: South America Photopheresis Products Market Revenue (million), by Application 2025 & 2033
- Figure 37: South America Photopheresis Products Market Revenue Share (%), by Application 2025 & 2033
- Figure 38: South America Photopheresis Products Market Revenue (million), by End User 2025 & 2033
- Figure 39: South America Photopheresis Products Market Revenue Share (%), by End User 2025 & 2033
- Figure 40: South America Photopheresis Products Market Revenue (million), by Country 2025 & 2033
- Figure 41: South America Photopheresis Products Market Revenue Share (%), by Country 2025 & 2033
List of Tables
- Table 1: Global Photopheresis Products Market Revenue million Forecast, by Product Type 2020 & 2033
- Table 2: Global Photopheresis Products Market Revenue million Forecast, by Application 2020 & 2033
- Table 3: Global Photopheresis Products Market Revenue million Forecast, by End User 2020 & 2033
- Table 4: Global Photopheresis Products Market Revenue million Forecast, by Region 2020 & 2033
- Table 5: Global Photopheresis Products Market Revenue million Forecast, by Product Type 2020 & 2033
- Table 6: Global Photopheresis Products Market Revenue million Forecast, by Application 2020 & 2033
- Table 7: Global Photopheresis Products Market Revenue million Forecast, by End User 2020 & 2033
- Table 8: Global Photopheresis Products Market Revenue million Forecast, by Country 2020 & 2033
- Table 9: United States Photopheresis Products Market Revenue (million) Forecast, by Application 2020 & 2033
- Table 10: Canada Photopheresis Products Market Revenue (million) Forecast, by Application 2020 & 2033
- Table 11: Mexico Photopheresis Products Market Revenue (million) Forecast, by Application 2020 & 2033
- Table 12: Global Photopheresis Products Market Revenue million Forecast, by Product Type 2020 & 2033
- Table 13: Global Photopheresis Products Market Revenue million Forecast, by Application 2020 & 2033
- Table 14: Global Photopheresis Products Market Revenue million Forecast, by End User 2020 & 2033
- Table 15: Global Photopheresis Products Market Revenue million Forecast, by Country 2020 & 2033
- Table 16: Germany Photopheresis Products Market Revenue (million) Forecast, by Application 2020 & 2033
- Table 17: United Kingdom Photopheresis Products Market Revenue (million) Forecast, by Application 2020 & 2033
- Table 18: France Photopheresis Products Market Revenue (million) Forecast, by Application 2020 & 2033
- Table 19: Italy Photopheresis Products Market Revenue (million) Forecast, by Application 2020 & 2033
- Table 20: Spain Photopheresis Products Market Revenue (million) Forecast, by Application 2020 & 2033
- Table 21: Rest of Europe Photopheresis Products Market Revenue (million) Forecast, by Application 2020 & 2033
- Table 22: Global Photopheresis Products Market Revenue million Forecast, by Product Type 2020 & 2033
- Table 23: Global Photopheresis Products Market Revenue million Forecast, by Application 2020 & 2033
- Table 24: Global Photopheresis Products Market Revenue million Forecast, by End User 2020 & 2033
- Table 25: Global Photopheresis Products Market Revenue million Forecast, by Country 2020 & 2033
- Table 26: China Photopheresis Products Market Revenue (million) Forecast, by Application 2020 & 2033
- Table 27: Japan Photopheresis Products Market Revenue (million) Forecast, by Application 2020 & 2033
- Table 28: India Photopheresis Products Market Revenue (million) Forecast, by Application 2020 & 2033
- Table 29: Australia Photopheresis Products Market Revenue (million) Forecast, by Application 2020 & 2033
- Table 30: South Korea Photopheresis Products Market Revenue (million) Forecast, by Application 2020 & 2033
- Table 31: Rest of Asia Pacific Photopheresis Products Market Revenue (million) Forecast, by Application 2020 & 2033
- Table 32: Global Photopheresis Products Market Revenue million Forecast, by Product Type 2020 & 2033
- Table 33: Global Photopheresis Products Market Revenue million Forecast, by Application 2020 & 2033
- Table 34: Global Photopheresis Products Market Revenue million Forecast, by End User 2020 & 2033
- Table 35: Global Photopheresis Products Market Revenue million Forecast, by Country 2020 & 2033
- Table 36: GCC Photopheresis Products Market Revenue (million) Forecast, by Application 2020 & 2033
- Table 37: South Africa Photopheresis Products Market Revenue (million) Forecast, by Application 2020 & 2033
- Table 38: Rest of Middle East and Africa Photopheresis Products Market Revenue (million) Forecast, by Application 2020 & 2033
- Table 39: Global Photopheresis Products Market Revenue million Forecast, by Product Type 2020 & 2033
- Table 40: Global Photopheresis Products Market Revenue million Forecast, by Application 2020 & 2033
- Table 41: Global Photopheresis Products Market Revenue million Forecast, by End User 2020 & 2033
- Table 42: Global Photopheresis Products Market Revenue million Forecast, by Country 2020 & 2033
- Table 43: Brazil Photopheresis Products Market Revenue (million) Forecast, by Application 2020 & 2033
- Table 44: Argentina Photopheresis Products Market Revenue (million) Forecast, by Application 2020 & 2033
- Table 45: Rest of South America Photopheresis Products Market Revenue (million) Forecast, by Application 2020 & 2033
Frequently Asked Questions
1. What is the projected Compound Annual Growth Rate (CAGR) of the Photopheresis Products Market?
The projected CAGR is approximately 5.6%.
2. Which companies are prominent players in the Photopheresis Products Market?
Key companies in the market include Macopharma, Terumo Corporation*List Not Exhaustive, Fresenius Kabi AG, PIT Medical Systems, Haemonetics Corporation, Mallinckrodt Pharmaceuticals.
3. What are the main segments of the Photopheresis Products Market?
The market segments include Product Type, Application, End User.
4. Can you provide details about the market size?
The market size is estimated to be USD 342.86 million as of 2022.
5. What are some drivers contributing to market growth?
Rise in Prevalence of Autoimmune Diseases; Increasing Technological Advancements.
6. What are the notable trends driving market growth?
Chronic Graft Versus Host Disease (GvHD) is Expected to Hold a Significant Market Share in the Market Studied..
7. Are there any restraints impacting market growth?
Low Adoption of Photopheresis in Pediatric Patients and Lack of Skilled Professionals.
8. Can you provide examples of recent developments in the market?
In September 2022, UAE opened a new apheresis unit in the Sheikh Shakhbout Medical City (SSMC) as a collaboration between Abu Dhabi Health Services Company (SEHA) and Mayo Clinic. Sheikh Shakhbout Medical City widens the treatment scope for diseases, including rare lymphoma of the skin.
9. What pricing options are available for accessing the report?
Pricing options include single-user, multi-user, and enterprise licenses priced at USD 4750, USD 5250, and USD 8750 respectively.
10. Is the market size provided in terms of value or volume?
The market size is provided in terms of value, measured in million.
11. Are there any specific market keywords associated with the report?
Yes, the market keyword associated with the report is "Photopheresis Products Market," which aids in identifying and referencing the specific market segment covered.
12. How do I determine which pricing option suits my needs best?
The pricing options vary based on user requirements and access needs. Individual users may opt for single-user licenses, while businesses requiring broader access may choose multi-user or enterprise licenses for cost-effective access to the report.
13. Are there any additional resources or data provided in the Photopheresis Products Market report?
While the report offers comprehensive insights, it's advisable to review the specific contents or supplementary materials provided to ascertain if additional resources or data are available.
14. How can I stay updated on further developments or reports in the Photopheresis Products Market?
To stay informed about further developments, trends, and reports in the Photopheresis Products Market, consider subscribing to industry newsletters, following relevant companies and organizations, or regularly checking reputable industry news sources and publications.
Methodology
Step 1 - Identification of Relevant Samples Size from Population Database


Step 2 - Approaches for Defining Global Market Size (Value, Volume* & Price*)

Note*: In applicable scenarios
Step 3 - Data Sources
Primary Research
- Web Analytics
- Survey Reports
- Research Institute
- Latest Research Reports
- Opinion Leaders
Secondary Research
- Annual Reports
- White Paper
- Latest Press Release
- Industry Association
- Paid Database
- Investor Presentations

Step 4 - Data Triangulation
Involves using different sources of information in order to increase the validity of a study
These sources are likely to be stakeholders in a program - participants, other researchers, program staff, other community members, and so on.
Then we put all data in single framework & apply various statistical tools to find out the dynamic on the market.
During the analysis stage, feedback from the stakeholder groups would be compared to determine areas of agreement as well as areas of divergence