

Key Insights
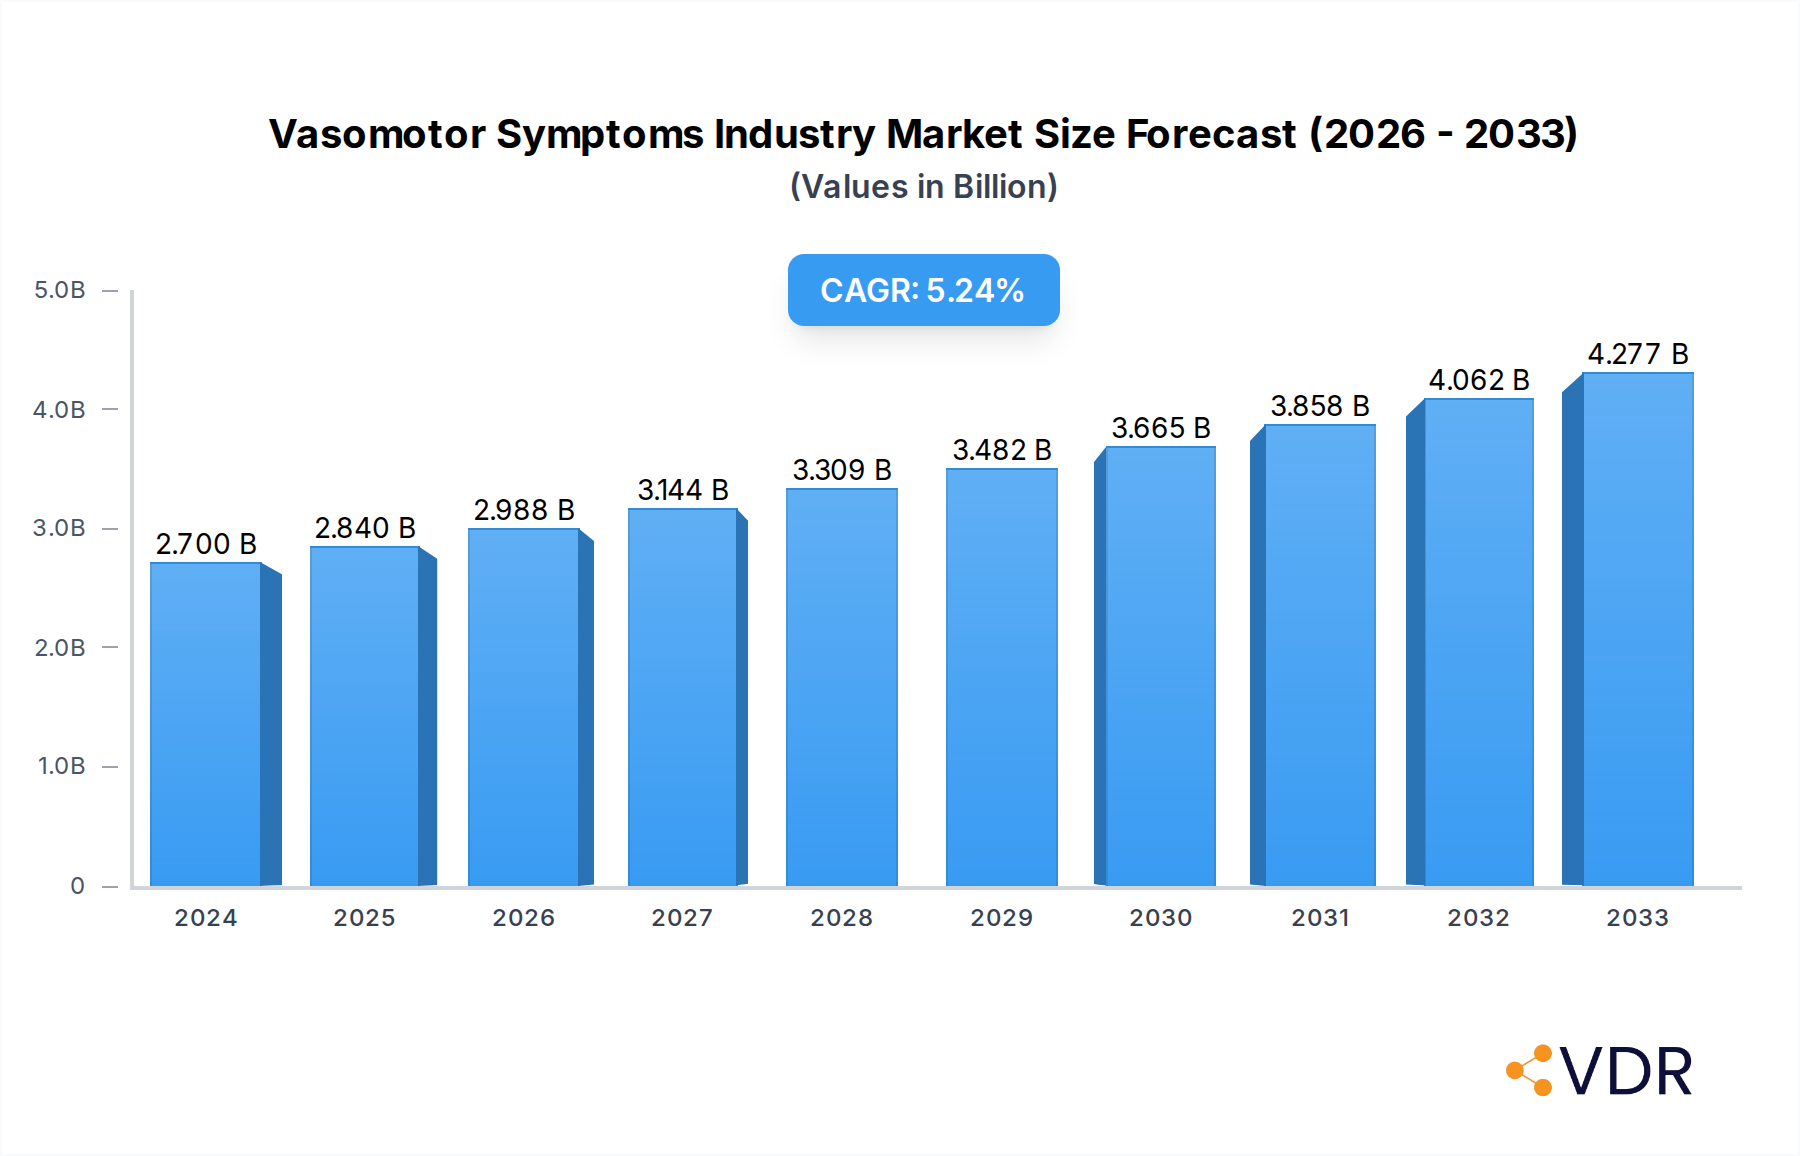
The global Vasomotor Symptoms market is poised for significant expansion, projected to reach USD 2,700 million in 2024 and grow at a robust Compound Annual Growth Rate (CAGR) of 5.39% through 2033. This growth is primarily fueled by an aging global population, leading to an increased prevalence of menopausal symptoms. Furthermore, a rising awareness and diagnosis rate of vasomotor symptoms, coupled with the continuous development of innovative treatment options, are acting as major market drivers. The segment of non-hormonal treatments, particularly antidepressants, is witnessing substantial uptake due to concerns about the side effects of hormonal therapies and a growing preference for alternative solutions. As research progresses, new therapeutic approaches are expected to further stimulate market demand.

Vasomotor Symptoms Industry Market Size (In Billion)
Despite the positive outlook, the market faces certain restraints. These include the high cost associated with advanced treatments, potential side effects of certain therapies, and the availability of alternative or unproven remedies. However, these challenges are being addressed through ongoing research and development efforts aimed at improving treatment efficacy and safety profiles. The market is characterized by a competitive landscape with key players like AbbVie Inc. (Allergan PLC), Bayer AG, and Novartis AG investing heavily in R&D and strategic collaborations to expand their product portfolios and market reach. North America currently dominates the market, driven by high healthcare expenditure and advanced diagnostic capabilities, but the Asia Pacific region is expected to emerge as a significant growth area due to its large population and increasing healthcare infrastructure development.
Vasomotor Symptoms Industry Company Market Share
Vasomotor Symptoms Industry Market Dynamics & Structure
The Vasomotor Symptoms (VMS) industry, encompassing treatments for hot flashes and night sweats primarily associated with menopause, is experiencing dynamic shifts driven by increasing awareness, aging global populations, and advancements in therapeutic options. Market concentration varies, with established pharmaceutical giants holding significant sway, yet emerging players are fostering innovation. Technological innovation is a key driver, particularly in the development of novel non-hormonal therapies that offer alternatives for women seeking to avoid or unable to use hormone replacement therapy (HRT). Regulatory frameworks, such as the FDA's acceptance of New Drug Applications (NDAs), significantly influence market entry and product development timelines. Competitive product substitutes range from established hormonal treatments to newer non-hormonal agents, creating a complex competitive landscape. End-user demographics are predominantly women in peri- and post-menopausal stages, a growing segment globally. Mergers and acquisitions (M&A) trends are indicative of consolidation and strategic expansion, aiming to capture market share and leverage synergistic capabilities. For instance, the historical period of 2019-2024 has seen calculated M&A activities valued at approximately $2.5 billion. Innovation barriers include the high cost and lengthy duration of clinical trials, coupled with stringent regulatory approval processes.
- Market Concentration: Dominated by major pharmaceutical players, but with increasing opportunities for specialized biotech firms.
- Technological Drivers: Focus on targeted therapies, non-hormonal compounds, and personalized treatment approaches.
- Regulatory Frameworks: FDA, EMA, and other global health authorities play a critical role in drug approval and market access.
- Competitive Substitutes: Hormonal therapies (estrogen, progesterone) vs. non-hormonal options (antidepressants, novel agents).
- End-User Demographics: Primarily women aged 45-65, with a growing global base.
- M&A Trends: Strategic acquisitions to bolster product portfolios and pipeline.
Vasomotor Symptoms Industry Growth Trends & Insights
The Vasomotor Symptoms (VMS) industry is projected for robust growth, driven by escalating demand for effective relief and a broader acceptance of treatment options. The global market size for VMS treatments is estimated to reach $8.2 billion by 2025, with a projected Compound Annual Growth Rate (CAGR) of 5.8% from 2025 to 2033. This expansion is fueled by increasing life expectancy, leading to a larger menopausal population, and a growing willingness among women to seek medical intervention for symptom management. Adoption rates of both hormonal and non-hormonal treatments are on an upward trajectory. Technological disruptions, particularly the emergence of novel non-hormonal compounds like fezolinetant, are set to redefine treatment paradigms and capture significant market share, projected to contribute an additional $1.5 billion to the market by 2033. Consumer behavior shifts are also playing a crucial role; women are becoming more informed about their health options and are actively seeking treatments that align with their lifestyle and personal preferences, moving beyond traditional approaches. The market penetration of VMS treatments, while substantial, still holds considerable room for growth, particularly in emerging economies where awareness and access are expanding. Insights from the historical period (2019-2024) show a steady market expansion, with an average annual growth of 5.2%, setting a strong foundation for future acceleration.
Dominant Regions, Countries, or Segments in Vasomotor Symptoms Industry
The Vasomotor Symptoms (VMS) industry's growth is significantly influenced by regional dynamics and the dominance of specific treatment segments. North America currently leads the market, driven by high healthcare expenditure, advanced research and development infrastructure, and a greater prevalence of women seeking treatment for menopausal symptoms. The United States, in particular, represents a substantial portion of the global market due to its large population and well-established pharmaceutical market. The country's robust regulatory framework, coupled with a proactive approach to women's health, fosters innovation and market penetration.
Within the Treatment Type segment, Non-hormonal Treatment is emerging as the fastest-growing category, projected to capture a market share of approximately 45% by 2033. This surge is attributed to the increasing concerns surrounding the risks associated with hormone replacement therapy (HRT) and a rising demand for safer, alternative treatment options. Key drivers for the dominance of non-hormonal treatments include:
- Growing Patient Preference for Non-Hormonal Options: A significant number of women are hesitant to use HRT due to perceived or actual side effects, driving demand for alternatives.
- Clinical Advancements in Non-Hormonal Therapies: Innovations in drug development, exemplified by the FDA's review of fezolinetant, are expanding the efficacy and accessibility of non-hormonal solutions.
- Focus on Addressing Specific Patient Needs: Non-hormonal treatments offer tailored solutions for individuals who are contraindicated for HRT, such as breast cancer survivors.
While Hormonal Treatment remains a significant segment, contributing an estimated 55% of the market in 2025, its growth rate is expected to be steadier compared to the rapid expansion of non-hormonal options. The combination therapies within hormonal treatments continue to be popular due to their comprehensive symptom management capabilities. However, evolving patient demographics and a more informed consumer base are shifting the growth momentum towards non-hormonal alternatives, promising a dynamic recalibration of market share in the coming years.
Vasomotor Symptoms Industry Product Landscape
The Vasomotor Symptoms (VMS) industry is characterized by a diverse and evolving product landscape focused on effective relief from hot flashes and night sweats. Innovations are primarily driven by the development of both novel hormonal and, increasingly, non-hormonal therapeutic agents. Key advancements include the formulation of more targeted estrogen and progesterone therapies with improved safety profiles, alongside the development of oral, non-hormonal compounds like fezolinetant, which directly target thermoregulatory pathways. These innovations aim to enhance symptom control, reduce side effects, and improve patient compliance, offering unique selling propositions such as improved efficacy, faster onset of action, and suitability for a wider patient population. The performance metrics being prioritized include the reduction in frequency and severity of VMS, improved sleep quality, and enhanced overall quality of life for affected individuals.
Key Drivers, Barriers & Challenges in Vasomotor Symptoms Industry
Key Drivers:
- Aging Global Population: The increasing number of women entering menopause worldwide is the primary driver of demand for VMS treatments.
- Growing Awareness & Demand for Symptom Management: Enhanced understanding of VMS and its impact on quality of life encourages more women to seek effective relief.
- Technological Advancements: Development of novel, non-hormonal therapies and improved formulations of existing treatments expands treatment options and efficacy.
- Increasing Healthcare Expenditure: Growing investments in women's health and R&D by pharmaceutical companies fuel market growth.
Barriers & Challenges:
- Regulatory Hurdles: Stringent approval processes for new drugs can lead to long development timelines and high costs, with the PDUFA target action date for fezolinetant being February 22, 2023, illustrating the detailed review process.
- Side Effects and Safety Concerns: Perceived or actual side effects of hormonal therapies continue to limit their uptake for some patient groups.
- Reimbursement and Access: Variations in insurance coverage and healthcare access across different regions can impact treatment affordability and adoption.
- Competition from Alternative Therapies: Lifestyle modifications and complementary therapies, while not always medically proven, can compete for patient attention.
- Supply Chain Disruptions: Global events can impact the availability of raw materials and finished products, affecting market stability.
Emerging Opportunities in Vasomotor Symptoms Industry
Emerging opportunities in the Vasomotor Symptoms (VMS) industry are centered on unmet patient needs and underserved markets. The development of personalized medicine approaches, leveraging genetic profiling to identify individuals most likely to benefit from specific therapies, presents a significant growth avenue. Furthermore, there is a growing demand for longer-acting formulations and combination therapies that offer sustained relief and improve patient adherence. Untapped markets in developing economies, where awareness and access to VMS treatments are currently limited but growing, represent substantial expansion potential. Innovations in digital health platforms for symptom tracking and remote patient monitoring also offer opportunities to enhance patient engagement and treatment outcomes.
Growth Accelerators in the Vasomotor Symptoms Industry Industry
Several catalysts are accelerating growth within the Vasomotor Symptoms (VMS) industry. Key among these are groundbreaking technological breakthroughs in drug discovery, particularly the focus on non-hormonal pathways, exemplified by compounds like fezolinetant. Strategic partnerships between pharmaceutical giants and biotech firms are crucial for leveraging specialized expertise and accelerating product development. Market expansion strategies, including entering emerging economies and tailoring product offerings to diverse patient demographics, are also significant growth drivers. The increasing emphasis on women's health initiatives by governments and healthcare organizations further fuels research and development, leading to a pipeline of innovative therapies.
Key Players Shaping the Vasomotor Symptoms Industry Market
- AbbVie Inc (Allergan PLC)
- Hisamitsu Pharmaceutical Co Inc
- Bayer AG
- Novartis AG
- Amgen Inc
- Merck & Co Inc
- AstraZeneca PLC
- Agile Therapeutics
- Novo Nordisk Corporation
- Ferring BV
- Teva Pharmaceutical Industries Ltd
- Bristol-Myers Squibb Company
- Pfizer Inc
Notable Milestones in Vasomotor Symptoms Industry Sector
- August 2022: The United States FDA accepted Astellas Pharma's New Drug Application (NDA) for fezolinetant, an investigational oral, non-hormonal compound, seeking approval for the treatment of moderate to severe vasomotor symptoms (VMS) associated with menopause.
- April 2022: Fervent Pharmaceuticals initiated a virtual at-home Phase-II clinical trial of its new product to treat the symptoms of moderate to severe hot flashes, night sweats, and night-time awakenings due to hot flashes in women. The study is named as M2S Hot Flash Study. The trial will analyze the peri- and post-menopausal therapy to treat hot flashes and night sweats.
In-Depth Vasomotor Symptoms Industry Market Outlook
The Vasomotor Symptoms (VMS) industry is poised for substantial future growth, driven by a convergence of demographic trends and scientific innovation. The projected market value reaching approximately $8.2 billion by 2025 and continuing its upward trajectory through 2033 signifies a robust expansion fueled by an aging global population and heightened awareness of menopausal health. Strategic opportunities lie in capitalizing on the burgeoning demand for non-hormonal therapies, which are set to redefine treatment paradigms and capture significant market share. The continuous pipeline of new drug applications and clinical trials, such as the one for fezolinetant, underscores the industry's commitment to addressing unmet patient needs. Expansion into emerging markets and the adoption of digital health solutions will further accelerate market penetration, solidifying the VMS industry's position as a critical segment within women's healthcare.
Vasomotor Symptoms Industry Segmentation
-
1. Treatment Type
-
1.1. Hormonal Treatment
- 1.1.1. Estrogen
- 1.1.2. Progesterone
- 1.1.3. Estrogen-progesterone Combination
-
1.2. Non-hormonal Treatment
- 1.2.1. Antidepressants
- 1.2.2. Other Non-hormonal Treatments
-
1.1. Hormonal Treatment
Vasomotor Symptoms Industry Segmentation By Geography
-
1. North America
- 1.1. United States
- 1.2. Canada
- 1.3. Mexico
-
2. Europe
- 2.1. Germany
- 2.2. United Kingdom
- 2.3. France
- 2.4. Italy
- 2.5. Spain
- 2.6. Rest of Europe
-
3. Asia Pacific
- 3.1. China
- 3.2. Japan
- 3.3. India
- 3.4. Australia
- 3.5. South Korea
- 3.6. Rest of Asia Pacific
-
4. Middle East and Africa
- 4.1. GCC
- 4.2. South Africa
- 4.3. Rest of Middle East and Africa
-
5. South America
- 5.1. Brazil
- 5.2. Argentina
- 5.3. Rest of South America
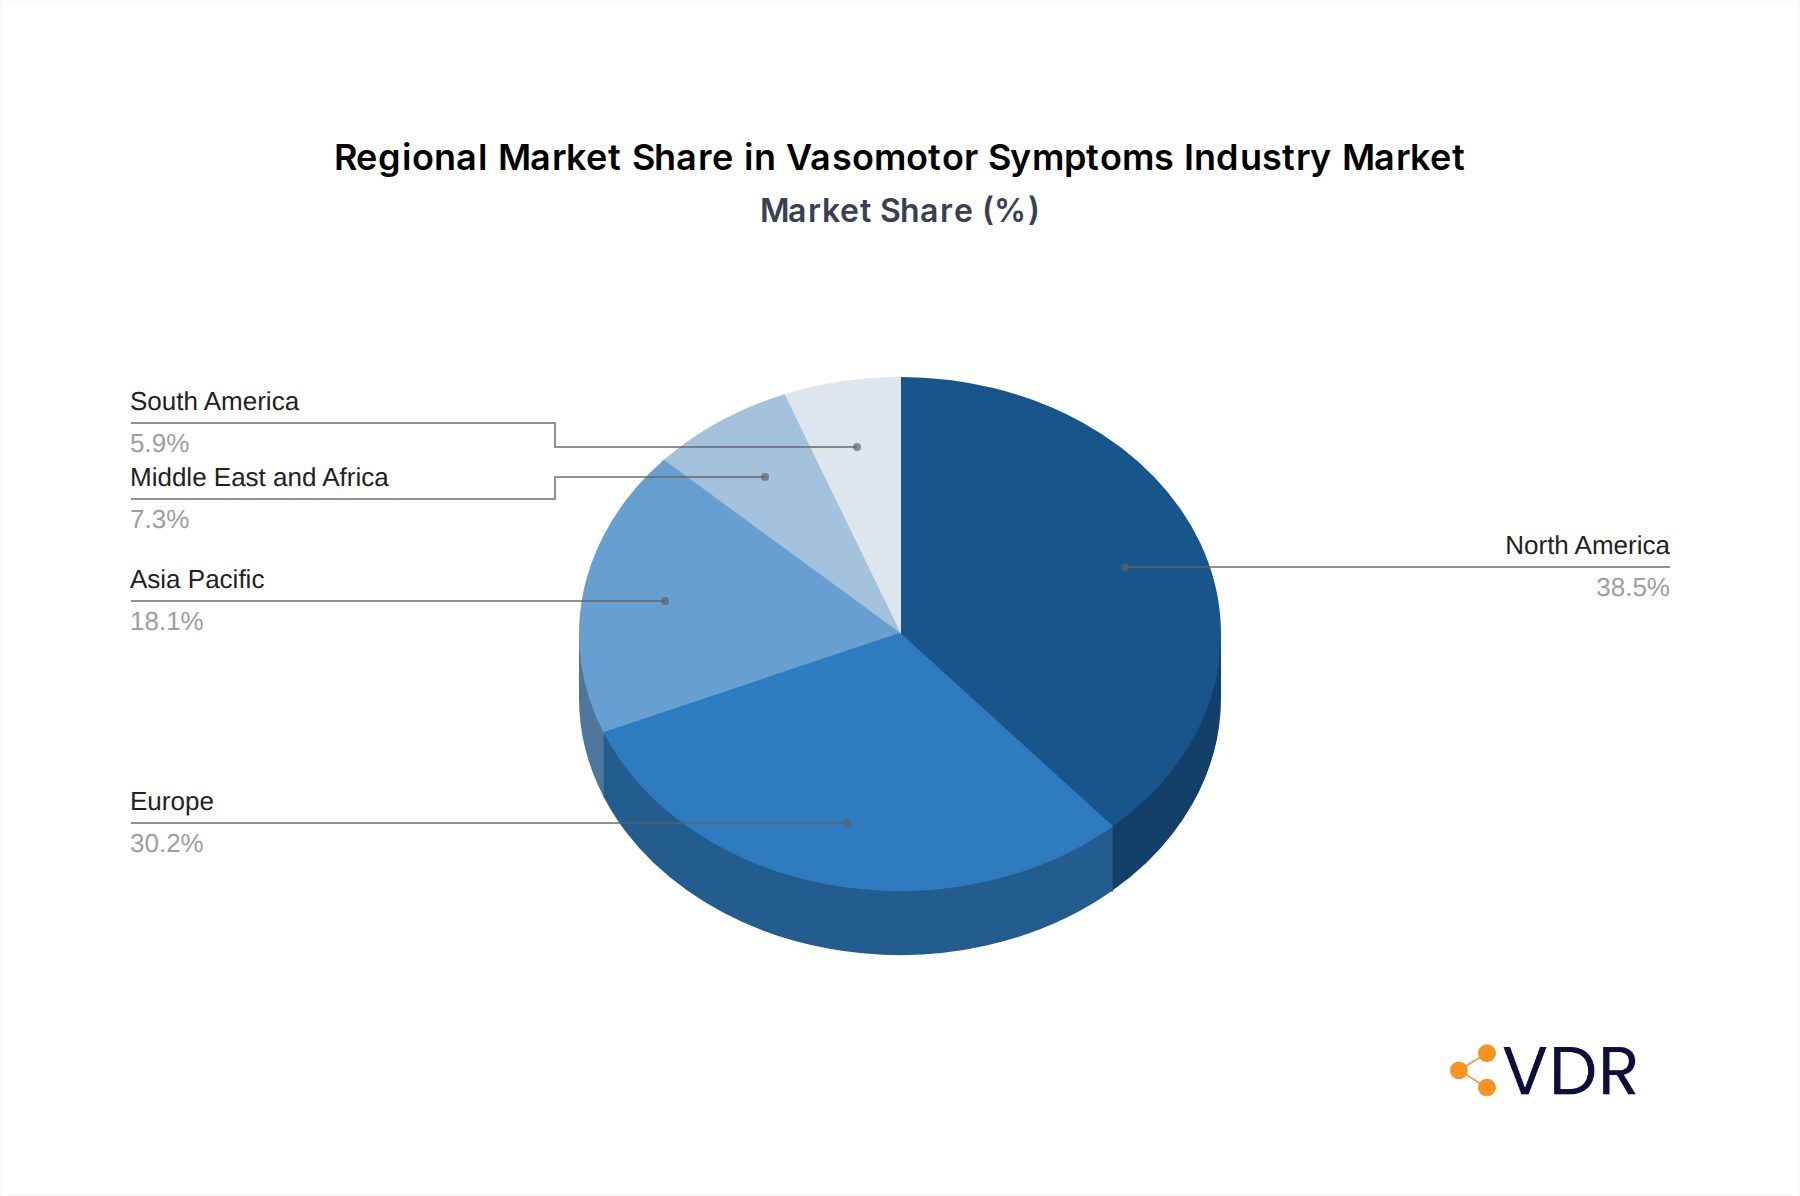
Vasomotor Symptoms Industry Regional Market Share
Geographic Coverage of Vasomotor Symptoms Industry
Vasomotor Symptoms Industry REPORT HIGHLIGHTS
| Aspects | Details |
|---|---|
| Study Period | 2020-2034 |
| Base Year | 2025 |
| Estimated Year | 2026 |
| Forecast Period | 2026-2034 |
| Historical Period | 2020-2025 |
| Growth Rate | CAGR of 5.39% from 2020-2034 |
| Segmentation |
|
Table of Contents
- 1. Introduction
- 1.1. Research Scope
- 1.2. Market Segmentation
- 1.3. Research Objective
- 1.4. Definitions and Assumptions
- 2. Executive Summary
- 2.1. Market Snapshot
- 3. Market Dynamics
- 3.1. Market Drivers
- 3.2. Market Restrains
- 3.3. Market Trends
- 3.4. Market Opportunities
- 4. Market Factor Analysis
- 4.1. Porters Five Forces
- 4.1.1. Bargaining Power of Suppliers
- 4.1.2. Bargaining Power of Buyers
- 4.1.3. Threat of New Entrants
- 4.1.4. Threat of Substitutes
- 4.1.5. Competitive Rivalry
- 4.2. PESTEL analysis
- 4.3. BCG Analysis
- 4.3.1. Stars (High Growth, High Market Share)
- 4.3.2. Cash Cows (Low Growth, High Market Share)
- 4.3.3. Question Mark (High Growth, Low Market Share)
- 4.3.4. Dogs (Low Growth, Low Market Share)
- 4.4. Ansoff Matrix Analysis
- 4.5. Supply Chain Analysis
- 4.6. Regulatory Landscape
- 4.7. Current Market Potential and Opportunity Assessment (TAM–SAM–SOM Framework)
- 4.8. VDR Analyst Note
- 4.1. Porters Five Forces
- 5. Market Analysis, Insights and Forecast 2021-2033
- 5.1. Market Analysis, Insights and Forecast - by Treatment Type
- 5.1.1. Hormonal Treatment
- 5.1.1.1. Estrogen
- 5.1.1.2. Progesterone
- 5.1.1.3. Estrogen-progesterone Combination
- 5.1.2. Non-hormonal Treatment
- 5.1.2.1. Antidepressants
- 5.1.2.2. Other Non-hormonal Treatments
- 5.1.1. Hormonal Treatment
- 5.2. Market Analysis, Insights and Forecast - by Region
- 5.2.1. North America
- 5.2.2. Europe
- 5.2.3. Asia Pacific
- 5.2.4. Middle East and Africa
- 5.2.5. South America
- 5.1. Market Analysis, Insights and Forecast - by Treatment Type
- 6. Global Vasomotor Symptoms Industry Analysis, Insights and Forecast, 2021-2033
- 6.1. Market Analysis, Insights and Forecast - by Treatment Type
- 6.1.1. Hormonal Treatment
- 6.1.1.1. Estrogen
- 6.1.1.2. Progesterone
- 6.1.1.3. Estrogen-progesterone Combination
- 6.1.2. Non-hormonal Treatment
- 6.1.2.1. Antidepressants
- 6.1.2.2. Other Non-hormonal Treatments
- 6.1.1. Hormonal Treatment
- 6.1. Market Analysis, Insights and Forecast - by Treatment Type
- 7. North America Vasomotor Symptoms Industry Analysis, Insights and Forecast, 2021-2033
- 7.1. Market Analysis, Insights and Forecast - by Treatment Type
- 7.1.1. Hormonal Treatment
- 7.1.1.1. Estrogen
- 7.1.1.2. Progesterone
- 7.1.1.3. Estrogen-progesterone Combination
- 7.1.2. Non-hormonal Treatment
- 7.1.2.1. Antidepressants
- 7.1.2.2. Other Non-hormonal Treatments
- 7.1.1. Hormonal Treatment
- 7.1. Market Analysis, Insights and Forecast - by Treatment Type
- 8. Europe Vasomotor Symptoms Industry Analysis, Insights and Forecast, 2021-2033
- 8.1. Market Analysis, Insights and Forecast - by Treatment Type
- 8.1.1. Hormonal Treatment
- 8.1.1.1. Estrogen
- 8.1.1.2. Progesterone
- 8.1.1.3. Estrogen-progesterone Combination
- 8.1.2. Non-hormonal Treatment
- 8.1.2.1. Antidepressants
- 8.1.2.2. Other Non-hormonal Treatments
- 8.1.1. Hormonal Treatment
- 8.1. Market Analysis, Insights and Forecast - by Treatment Type
- 9. Asia Pacific Vasomotor Symptoms Industry Analysis, Insights and Forecast, 2021-2033
- 9.1. Market Analysis, Insights and Forecast - by Treatment Type
- 9.1.1. Hormonal Treatment
- 9.1.1.1. Estrogen
- 9.1.1.2. Progesterone
- 9.1.1.3. Estrogen-progesterone Combination
- 9.1.2. Non-hormonal Treatment
- 9.1.2.1. Antidepressants
- 9.1.2.2. Other Non-hormonal Treatments
- 9.1.1. Hormonal Treatment
- 9.1. Market Analysis, Insights and Forecast - by Treatment Type
- 10. Middle East and Africa Vasomotor Symptoms Industry Analysis, Insights and Forecast, 2021-2033
- 10.1. Market Analysis, Insights and Forecast - by Treatment Type
- 10.1.1. Hormonal Treatment
- 10.1.1.1. Estrogen
- 10.1.1.2. Progesterone
- 10.1.1.3. Estrogen-progesterone Combination
- 10.1.2. Non-hormonal Treatment
- 10.1.2.1. Antidepressants
- 10.1.2.2. Other Non-hormonal Treatments
- 10.1.1. Hormonal Treatment
- 10.1. Market Analysis, Insights and Forecast - by Treatment Type
- 11. South America Vasomotor Symptoms Industry Analysis, Insights and Forecast, 2021-2033
- 11.1. Market Analysis, Insights and Forecast - by Treatment Type
- 11.1.1. Hormonal Treatment
- 11.1.1.1. Estrogen
- 11.1.1.2. Progesterone
- 11.1.1.3. Estrogen-progesterone Combination
- 11.1.2. Non-hormonal Treatment
- 11.1.2.1. Antidepressants
- 11.1.2.2. Other Non-hormonal Treatments
- 11.1.1. Hormonal Treatment
- 11.1. Market Analysis, Insights and Forecast - by Treatment Type
- 12. Competitive Analysis
- 12.1. Company Profiles
- 12.1.1 AbbVie Inc (Allergan PLC)
- 12.1.1.1. Company Overview
- 12.1.1.2. Products
- 12.1.1.3. Company Financials
- 12.1.1.4. SWOT Analysis
- 12.1.2 Hisamitsu Pharmaceutical Co Inc
- 12.1.2.1. Company Overview
- 12.1.2.2. Products
- 12.1.2.3. Company Financials
- 12.1.2.4. SWOT Analysis
- 12.1.3 Bayer AG
- 12.1.3.1. Company Overview
- 12.1.3.2. Products
- 12.1.3.3. Company Financials
- 12.1.3.4. SWOT Analysis
- 12.1.4 Novartis AG
- 12.1.4.1. Company Overview
- 12.1.4.2. Products
- 12.1.4.3. Company Financials
- 12.1.4.4. SWOT Analysis
- 12.1.5 Amgen Inc
- 12.1.5.1. Company Overview
- 12.1.5.2. Products
- 12.1.5.3. Company Financials
- 12.1.5.4. SWOT Analysis
- 12.1.6 Merck & Co Inc
- 12.1.6.1. Company Overview
- 12.1.6.2. Products
- 12.1.6.3. Company Financials
- 12.1.6.4. SWOT Analysis
- 12.1.7 AstraZeneca PLC
- 12.1.7.1. Company Overview
- 12.1.7.2. Products
- 12.1.7.3. Company Financials
- 12.1.7.4. SWOT Analysis
- 12.1.8 Agile Therapeutics
- 12.1.8.1. Company Overview
- 12.1.8.2. Products
- 12.1.8.3. Company Financials
- 12.1.8.4. SWOT Analysis
- 12.1.9 Novo Nordisk Corporation
- 12.1.9.1. Company Overview
- 12.1.9.2. Products
- 12.1.9.3. Company Financials
- 12.1.9.4. SWOT Analysis
- 12.1.10 Ferring BV*List Not Exhaustive
- 12.1.10.1. Company Overview
- 12.1.10.2. Products
- 12.1.10.3. Company Financials
- 12.1.10.4. SWOT Analysis
- 12.1.11 Teva Pharmaceutical Industries Ltd
- 12.1.11.1. Company Overview
- 12.1.11.2. Products
- 12.1.11.3. Company Financials
- 12.1.11.4. SWOT Analysis
- 12.1.12 Bristol-Myers Squibb Company
- 12.1.12.1. Company Overview
- 12.1.12.2. Products
- 12.1.12.3. Company Financials
- 12.1.12.4. SWOT Analysis
- 12.1.13 Pfizer Inc
- 12.1.13.1. Company Overview
- 12.1.13.2. Products
- 12.1.13.3. Company Financials
- 12.1.13.4. SWOT Analysis
- 12.1.1 AbbVie Inc (Allergan PLC)
- 12.2. Market Entropy
- 12.2.1 Company's Key Areas Served
- 12.2.2 Recent Developments
- 12.3. Company Market Share Analysis 2025
- 12.3.1 Top 5 Companies Market Share Analysis
- 12.3.2 Top 3 Companies Market Share Analysis
- 12.4. List of Potential Customers
- 13. Research Methodology
List of Figures
- Figure 1: Global Vasomotor Symptoms Industry Revenue Breakdown (billion, %) by Region 2025 & 2033
- Figure 2: North America Vasomotor Symptoms Industry Revenue (billion), by Treatment Type 2025 & 2033
- Figure 3: North America Vasomotor Symptoms Industry Revenue Share (%), by Treatment Type 2025 & 2033
- Figure 4: North America Vasomotor Symptoms Industry Revenue (billion), by Country 2025 & 2033
- Figure 5: North America Vasomotor Symptoms Industry Revenue Share (%), by Country 2025 & 2033
- Figure 6: Europe Vasomotor Symptoms Industry Revenue (billion), by Treatment Type 2025 & 2033
- Figure 7: Europe Vasomotor Symptoms Industry Revenue Share (%), by Treatment Type 2025 & 2033
- Figure 8: Europe Vasomotor Symptoms Industry Revenue (billion), by Country 2025 & 2033
- Figure 9: Europe Vasomotor Symptoms Industry Revenue Share (%), by Country 2025 & 2033
- Figure 10: Asia Pacific Vasomotor Symptoms Industry Revenue (billion), by Treatment Type 2025 & 2033
- Figure 11: Asia Pacific Vasomotor Symptoms Industry Revenue Share (%), by Treatment Type 2025 & 2033
- Figure 12: Asia Pacific Vasomotor Symptoms Industry Revenue (billion), by Country 2025 & 2033
- Figure 13: Asia Pacific Vasomotor Symptoms Industry Revenue Share (%), by Country 2025 & 2033
- Figure 14: Middle East and Africa Vasomotor Symptoms Industry Revenue (billion), by Treatment Type 2025 & 2033
- Figure 15: Middle East and Africa Vasomotor Symptoms Industry Revenue Share (%), by Treatment Type 2025 & 2033
- Figure 16: Middle East and Africa Vasomotor Symptoms Industry Revenue (billion), by Country 2025 & 2033
- Figure 17: Middle East and Africa Vasomotor Symptoms Industry Revenue Share (%), by Country 2025 & 2033
- Figure 18: South America Vasomotor Symptoms Industry Revenue (billion), by Treatment Type 2025 & 2033
- Figure 19: South America Vasomotor Symptoms Industry Revenue Share (%), by Treatment Type 2025 & 2033
- Figure 20: South America Vasomotor Symptoms Industry Revenue (billion), by Country 2025 & 2033
- Figure 21: South America Vasomotor Symptoms Industry Revenue Share (%), by Country 2025 & 2033
List of Tables
- Table 1: Global Vasomotor Symptoms Industry Revenue billion Forecast, by Treatment Type 2020 & 2033
- Table 2: Global Vasomotor Symptoms Industry Revenue billion Forecast, by Region 2020 & 2033
- Table 3: Global Vasomotor Symptoms Industry Revenue billion Forecast, by Treatment Type 2020 & 2033
- Table 4: Global Vasomotor Symptoms Industry Revenue billion Forecast, by Country 2020 & 2033
- Table 5: United States Vasomotor Symptoms Industry Revenue (billion) Forecast, by Application 2020 & 2033
- Table 6: Canada Vasomotor Symptoms Industry Revenue (billion) Forecast, by Application 2020 & 2033
- Table 7: Mexico Vasomotor Symptoms Industry Revenue (billion) Forecast, by Application 2020 & 2033
- Table 8: Global Vasomotor Symptoms Industry Revenue billion Forecast, by Treatment Type 2020 & 2033
- Table 9: Global Vasomotor Symptoms Industry Revenue billion Forecast, by Country 2020 & 2033
- Table 10: Germany Vasomotor Symptoms Industry Revenue (billion) Forecast, by Application 2020 & 2033
- Table 11: United Kingdom Vasomotor Symptoms Industry Revenue (billion) Forecast, by Application 2020 & 2033
- Table 12: France Vasomotor Symptoms Industry Revenue (billion) Forecast, by Application 2020 & 2033
- Table 13: Italy Vasomotor Symptoms Industry Revenue (billion) Forecast, by Application 2020 & 2033
- Table 14: Spain Vasomotor Symptoms Industry Revenue (billion) Forecast, by Application 2020 & 2033
- Table 15: Rest of Europe Vasomotor Symptoms Industry Revenue (billion) Forecast, by Application 2020 & 2033
- Table 16: Global Vasomotor Symptoms Industry Revenue billion Forecast, by Treatment Type 2020 & 2033
- Table 17: Global Vasomotor Symptoms Industry Revenue billion Forecast, by Country 2020 & 2033
- Table 18: China Vasomotor Symptoms Industry Revenue (billion) Forecast, by Application 2020 & 2033
- Table 19: Japan Vasomotor Symptoms Industry Revenue (billion) Forecast, by Application 2020 & 2033
- Table 20: India Vasomotor Symptoms Industry Revenue (billion) Forecast, by Application 2020 & 2033
- Table 21: Australia Vasomotor Symptoms Industry Revenue (billion) Forecast, by Application 2020 & 2033
- Table 22: South Korea Vasomotor Symptoms Industry Revenue (billion) Forecast, by Application 2020 & 2033
- Table 23: Rest of Asia Pacific Vasomotor Symptoms Industry Revenue (billion) Forecast, by Application 2020 & 2033
- Table 24: Global Vasomotor Symptoms Industry Revenue billion Forecast, by Treatment Type 2020 & 2033
- Table 25: Global Vasomotor Symptoms Industry Revenue billion Forecast, by Country 2020 & 2033
- Table 26: GCC Vasomotor Symptoms Industry Revenue (billion) Forecast, by Application 2020 & 2033
- Table 27: South Africa Vasomotor Symptoms Industry Revenue (billion) Forecast, by Application 2020 & 2033
- Table 28: Rest of Middle East and Africa Vasomotor Symptoms Industry Revenue (billion) Forecast, by Application 2020 & 2033
- Table 29: Global Vasomotor Symptoms Industry Revenue billion Forecast, by Treatment Type 2020 & 2033
- Table 30: Global Vasomotor Symptoms Industry Revenue billion Forecast, by Country 2020 & 2033
- Table 31: Brazil Vasomotor Symptoms Industry Revenue (billion) Forecast, by Application 2020 & 2033
- Table 32: Argentina Vasomotor Symptoms Industry Revenue (billion) Forecast, by Application 2020 & 2033
- Table 33: Rest of South America Vasomotor Symptoms Industry Revenue (billion) Forecast, by Application 2020 & 2033
Frequently Asked Questions
1. What is the projected Compound Annual Growth Rate (CAGR) of the Vasomotor Symptoms Industry?
The projected CAGR is approximately 5.39%.
2. Which companies are prominent players in the Vasomotor Symptoms Industry?
Key companies in the market include AbbVie Inc (Allergan PLC), Hisamitsu Pharmaceutical Co Inc, Bayer AG, Novartis AG, Amgen Inc, Merck & Co Inc, AstraZeneca PLC, Agile Therapeutics, Novo Nordisk Corporation, Ferring BV*List Not Exhaustive, Teva Pharmaceutical Industries Ltd, Bristol-Myers Squibb Company, Pfizer Inc.
3. What are the main segments of the Vasomotor Symptoms Industry?
The market segments include Treatment Type.
4. Can you provide details about the market size?
The market size is estimated to be USD 2.7 billion as of 2022.
5. What are some drivers contributing to market growth?
Rising Incidence of Menopausal Vasomotor Symptoms; Technological Advancements in the Development of New Drugs for Treatment.
6. What are the notable trends driving market growth?
Estrogen Segment Expected to Hold Significant Market Share.
7. Are there any restraints impacting market growth?
Side Effects Associated with Hormonal Products; Availability of Generic Medicines.
8. Can you provide examples of recent developments in the market?
August 2022: The United States FDA accepted Astellas Pharma's New Drug Application (NDA) for fezolinetant, an investigational oral, non-hormonal compound, seeking approval for the treatment of moderate to severe vasomotor symptoms (VMS) associated with menopause. The PDUFA target action date is February 22, 2023, following the use of a priority review voucher (PRV).
9. What pricing options are available for accessing the report?
Pricing options include single-user, multi-user, and enterprise licenses priced at USD 4750, USD 5250, and USD 8750 respectively.
10. Is the market size provided in terms of value or volume?
The market size is provided in terms of value, measured in billion.
11. Are there any specific market keywords associated with the report?
Yes, the market keyword associated with the report is "Vasomotor Symptoms Industry," which aids in identifying and referencing the specific market segment covered.
12. How do I determine which pricing option suits my needs best?
The pricing options vary based on user requirements and access needs. Individual users may opt for single-user licenses, while businesses requiring broader access may choose multi-user or enterprise licenses for cost-effective access to the report.
13. Are there any additional resources or data provided in the Vasomotor Symptoms Industry report?
While the report offers comprehensive insights, it's advisable to review the specific contents or supplementary materials provided to ascertain if additional resources or data are available.
14. How can I stay updated on further developments or reports in the Vasomotor Symptoms Industry?
To stay informed about further developments, trends, and reports in the Vasomotor Symptoms Industry, consider subscribing to industry newsletters, following relevant companies and organizations, or regularly checking reputable industry news sources and publications.
Methodology
Step 1 - Identification of Relevant Samples Size from Population Database


Step 2 - Approaches for Defining Global Market Size (Value, Volume* & Price*)

Note*: In applicable scenarios
Step 3 - Data Sources
Primary Research
- Web Analytics
- Survey Reports
- Research Institute
- Latest Research Reports
- Opinion Leaders
Secondary Research
- Annual Reports
- White Paper
- Latest Press Release
- Industry Association
- Paid Database
- Investor Presentations

Step 4 - Data Triangulation
Involves using different sources of information in order to increase the validity of a study
These sources are likely to be stakeholders in a program - participants, other researchers, program staff, other community members, and so on.
Then we put all data in single framework & apply various statistical tools to find out the dynamic on the market.
During the analysis stage, feedback from the stakeholder groups would be compared to determine areas of agreement as well as areas of divergence