

Key Insights
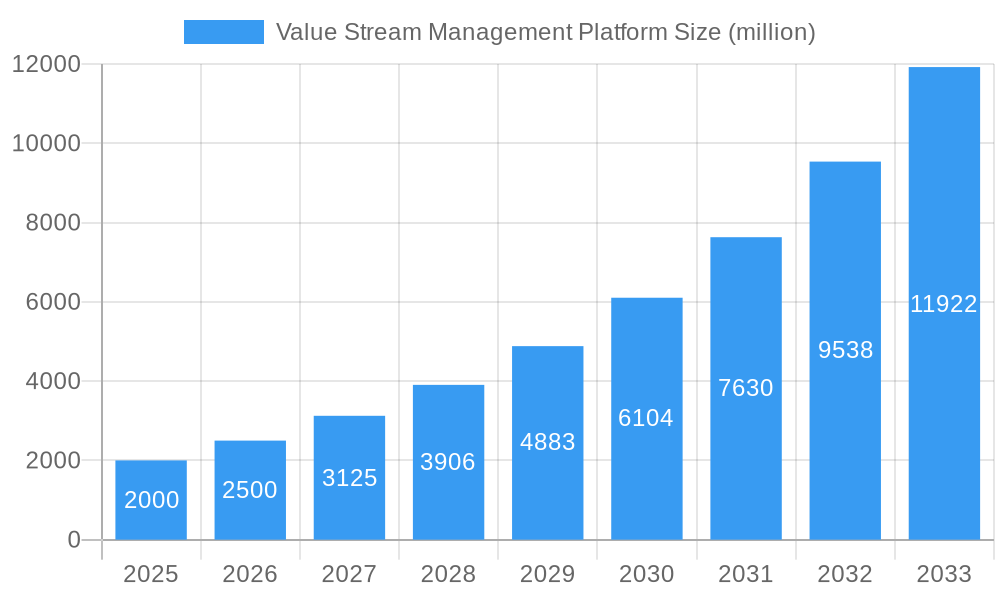
The Value Stream Management (VSM) Platform market is experiencing robust growth, driven by the increasing need for organizations to optimize their software delivery processes and enhance overall business agility. The market, estimated at $2 billion in 2025, is projected to achieve a Compound Annual Growth Rate (CAGR) of 25% from 2025 to 2033, reaching an estimated $10 billion by 2033. This significant expansion is fueled by several key factors. Firstly, the rising adoption of DevOps and Agile methodologies necessitates comprehensive visibility into the entire software delivery lifecycle, a capability VSM platforms excel at providing. Secondly, the increasing complexity of modern software development, coupled with the pressure to deliver faster and more frequently, is pushing businesses to seek out solutions that streamline their workflows and eliminate bottlenecks. Thirdly, the growing demand for enhanced collaboration and communication across different teams involved in the software development process is further contributing to the market's growth. Key market segments include large enterprises across various industries, with a significant focus on the financial services, technology, and retail sectors.
Value Stream Management Platform Market Size (In Billion)
The competitive landscape is dynamic, with a mix of established players and emerging startups vying for market share. Companies like LeanIX, Apptio, and ServiceNow are prominent players, leveraging their existing enterprise software portfolios to expand into the VSM space. Meanwhile, specialized VSM vendors like Tasktop and Digital.ai are aggressively innovating to meet the evolving needs of businesses. The market is also witnessing increased investments in research and development, resulting in the emergence of innovative features like AI-powered analytics and automated workflows. Challenges remain, however, including the need for better integration with existing enterprise systems and the complexities of implementing and adopting VSM across large organizations. Despite these hurdles, the long-term outlook for the VSM platform market remains exceptionally positive, underpinned by the ongoing digital transformation efforts of businesses worldwide and the sustained demand for faster, more efficient software delivery.
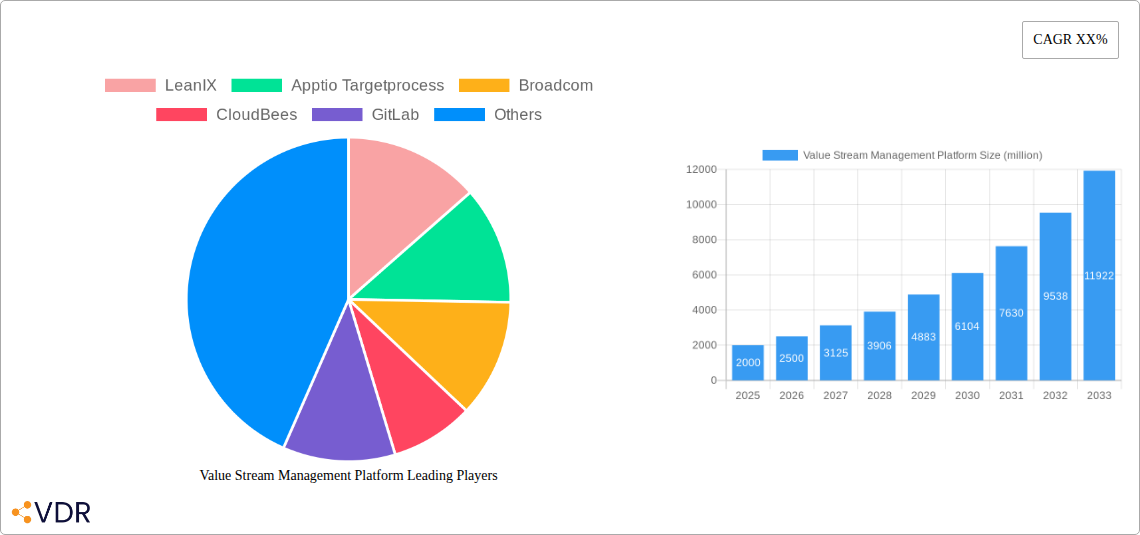
Value Stream Management Platform Company Market Share
Value Stream Management Platform Market Report: 2019-2033
This comprehensive report provides an in-depth analysis of the Value Stream Management (VSM) Platform market, encompassing market dynamics, growth trends, regional segmentation, competitive landscape, and future outlook. The study period covers 2019-2033, with a base year of 2025 and a forecast period of 2025-2033. This report is crucial for businesses operating in the DevOps, Agile, and IT Operations Management (ITOM) sectors, providing actionable insights for strategic decision-making. The market is segmented by deployment (cloud, on-premise), organization size (SMEs, large enterprises), and industry vertical.
Value Stream Management Platform Market Dynamics & Structure
The Value Stream Management Platform market is experiencing robust growth driven by increasing adoption of Agile and DevOps methodologies, the need for improved software delivery speed and efficiency, and a growing focus on digital transformation initiatives. Market concentration is moderate, with several key players vying for market share. Technological innovation, particularly in AI and automation, is a major growth driver. Regulatory frameworks, such as GDPR and CCPA, are increasingly influencing data security and privacy practices within VSM platforms. Competitive substitutes include traditional project management tools and application performance monitoring (APM) solutions. The end-user demographic is largely comprised of IT professionals, software developers, and business leaders across various industries. M&A activity has been significant, with larger players acquiring smaller companies to expand their capabilities and market reach. The estimated market size in 2025 is $xx million.
- Market Concentration: Moderate, with top 5 players holding approximately 40% market share in 2025.
- Technological Innovation Drivers: AI/ML for predictive analytics, automation of workflow processes, integration with existing DevOps tools.
- Regulatory Frameworks: GDPR, CCPA, driving focus on data security and compliance within VSM platforms.
- M&A Activity: xx deals recorded between 2019 and 2024, with an average deal value of $xx million.
- Innovation Barriers: High initial investment costs, integration complexities, lack of skilled workforce.
Value Stream Management Platform Growth Trends & Insights
The VSM Platform market has witnessed significant growth in recent years, driven by increasing demand for faster software delivery cycles and improved operational efficiency. The market size grew from $xx million in 2019 to an estimated $xx million in 2025, exhibiting a Compound Annual Growth Rate (CAGR) of xx% during the historical period. Market penetration is currently at approximately xx%, with significant growth potential in untapped markets. Technological disruptions, such as the rise of cloud-native architectures and serverless computing, are impacting platform adoption. Consumer behavior shifts towards more agile and iterative development processes are driving demand for VSM platforms capable of supporting these methodologies. The forecast period (2025-2033) projects continued strong growth, reaching an estimated $xx million by 2033, with a CAGR of xx%.
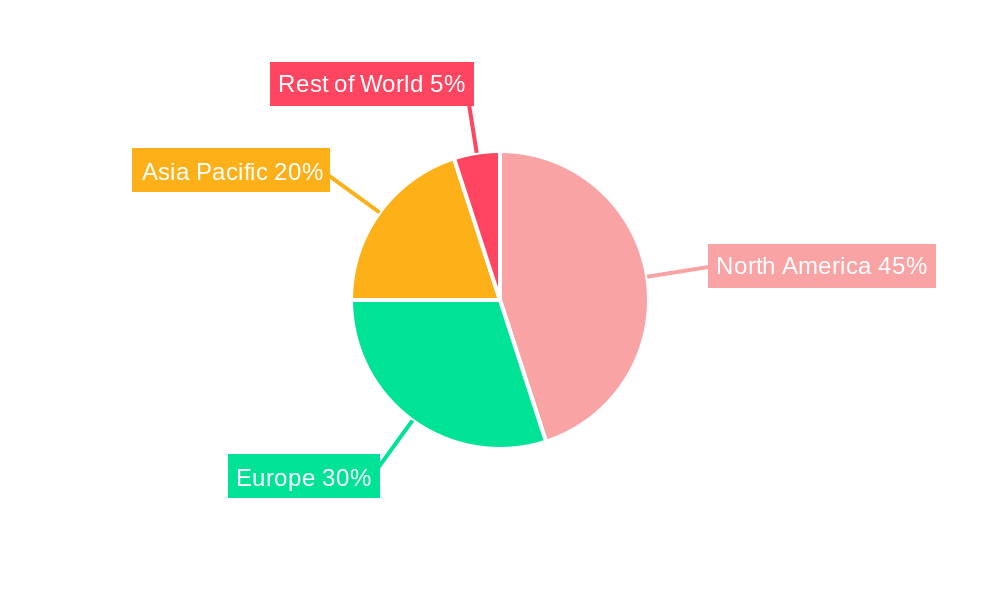
Dominant Regions, Countries, or Segments in Value Stream Management Platform
North America currently dominates the VSM Platform market, followed by Europe and Asia-Pacific. The high adoption rate in North America is attributed to the presence of numerous large enterprises, advanced technological infrastructure, and a robust IT ecosystem. The strong focus on digital transformation in this region fuels the demand for VSM solutions. Europe is witnessing rapid growth, driven by increasing investments in digitalization across various sectors. The Asia-Pacific region shows significant growth potential, with expanding economies and increasing investments in technology infrastructure.
- North America: High market share (xx%), driven by early adoption of Agile and DevOps practices.
- Europe: Rapid growth (xx% CAGR), fueled by increasing digital transformation initiatives.
- Asia-Pacific: High growth potential (xx% CAGR), driven by expanding economies and technological advancements.
- Key Drivers: Strong government support for digitalization initiatives, high concentration of tech companies, skilled workforce.
Value Stream Management Platform Product Landscape
VSM platforms offer a range of features, including workflow visualization, bottleneck identification, performance metrics, and automated reporting. Recent product innovations focus on enhanced AI/ML capabilities, improved integration with existing DevOps tools, and support for cloud-native architectures. Unique selling propositions include real-time visibility into the value stream, predictive analytics for identifying potential risks, and automated remediation of bottlenecks. Technological advancements are driving the convergence of VSM platforms with other enterprise solutions, such as APM and ITSM tools.
Key Drivers, Barriers & Challenges in Value Stream Management Platform
Key Drivers:
- Increasing adoption of Agile and DevOps methodologies.
- Growing need for faster software delivery cycles.
- Focus on improving operational efficiency and reducing costs.
- Rise of cloud-native architectures and serverless computing.
Key Challenges:
- High implementation costs and complexity.
- Integration challenges with existing systems.
- Lack of skilled workforce to implement and manage VSM platforms.
- Competition from established project management and APM solutions. This leads to an estimated xx% market penetration loss annually.
Emerging Opportunities in Value Stream Management Platform
- Expansion into untapped markets, particularly in emerging economies.
- Development of VSM solutions tailored to specific industry verticals.
- Integration of VSM platforms with AI and ML capabilities for advanced analytics and automation.
- Adoption of VSM in non-software development areas, such as manufacturing and healthcare.
Growth Accelerators in the Value Stream Management Platform Industry
Strategic partnerships between VSM platform providers and other enterprise software vendors are accelerating market growth. Technological breakthroughs, particularly in AI/ML and automation, are enhancing platform capabilities and expanding their applications. Expansion into new markets and industry verticals is another key growth driver.
Key Players Shaping the Value Stream Management Platform Market
- LeanIX
- Apptio
- Targetprocess
- Broadcom
- CloudBees
- GitLab
- codeBeamer
- Infosys (Panaya)
- Storyteller
- Digital.ai
- ConnectALL
- Plutora
- Tasktop
- Opsera
- Jellyfish
- LinearB
- Propelo
- HCL Technologies
- Plandek
- ServiceNow
Notable Milestones in Value Stream Management Platform Sector
- 2020: Increased adoption of cloud-based VSM platforms.
- 2021: Significant investments in AI/ML capabilities for VSM platforms.
- 2022: Launch of several new VSM platforms with enhanced integration capabilities.
- 2023: Merger and acquisition activity amongst major players in the market.
- 2024: Increased focus on data security and compliance within VSM platforms.
In-Depth Value Stream Management Platform Market Outlook
The VSM Platform market is poised for continued strong growth over the forecast period, driven by ongoing digital transformation initiatives and the increasing demand for improved software delivery efficiency. Strategic opportunities exist in expanding into new markets, developing innovative product features, and forging strategic partnerships. The market is projected to reach significant scale by 2033, presenting considerable investment and growth potential for companies in the space.
Value Stream Management Platform Segmentation
-
1. Application
- 1.1. Large Enterprises
- 1.2. SMEs
-
2. Types
- 2.1. Cloud-based
- 2.2. On-premise
Value Stream Management Platform Segmentation By Geography
-
1. North America
- 1.1. United States
- 1.2. Canada
- 1.3. Mexico
-
2. South America
- 2.1. Brazil
- 2.2. Argentina
- 2.3. Rest of South America
-
3. Europe
- 3.1. United Kingdom
- 3.2. Germany
- 3.3. France
- 3.4. Italy
- 3.5. Spain
- 3.6. Russia
- 3.7. Benelux
- 3.8. Nordics
- 3.9. Rest of Europe
-
4. Middle East & Africa
- 4.1. Turkey
- 4.2. Israel
- 4.3. GCC
- 4.4. North Africa
- 4.5. South Africa
- 4.6. Rest of Middle East & Africa
-
5. Asia Pacific
- 5.1. China
- 5.2. India
- 5.3. Japan
- 5.4. South Korea
- 5.5. ASEAN
- 5.6. Oceania
- 5.7. Rest of Asia Pacific
Value Stream Management Platform Regional Market Share
Geographic Coverage of Value Stream Management Platform
Value Stream Management Platform REPORT HIGHLIGHTS
| Aspects | Details |
|---|---|
| Study Period | 2020-2034 |
| Base Year | 2025 |
| Estimated Year | 2026 |
| Forecast Period | 2026-2034 |
| Historical Period | 2020-2025 |
| Growth Rate | CAGR of 9.8% from 2020-2034 |
| Segmentation |
|
Table of Contents
- 1. Introduction
- 1.1. Research Scope
- 1.2. Market Segmentation
- 1.3. Research Objective
- 1.4. Definitions and Assumptions
- 2. Executive Summary
- 2.1. Market Snapshot
- 3. Market Dynamics
- 3.1. Market Drivers
- 3.2. Market Restrains
- 3.3. Market Trends
- 3.4. Market Opportunities
- 4. Market Factor Analysis
- 4.1. Porters Five Forces
- 4.1.1. Bargaining Power of Suppliers
- 4.1.2. Bargaining Power of Buyers
- 4.1.3. Threat of New Entrants
- 4.1.4. Threat of Substitutes
- 4.1.5. Competitive Rivalry
- 4.2. PESTEL analysis
- 4.3. BCG Analysis
- 4.3.1. Stars (High Growth, High Market Share)
- 4.3.2. Cash Cows (Low Growth, High Market Share)
- 4.3.3. Question Mark (High Growth, Low Market Share)
- 4.3.4. Dogs (Low Growth, Low Market Share)
- 4.4. Ansoff Matrix Analysis
- 4.5. Supply Chain Analysis
- 4.6. Regulatory Landscape
- 4.7. Current Market Potential and Opportunity Assessment (TAM–SAM–SOM Framework)
- 4.8. VDR Analyst Note
- 4.1. Porters Five Forces
- 5. Market Analysis, Insights and Forecast 2021-2033
- 5.1. Market Analysis, Insights and Forecast - by Application
- 5.1.1. Large Enterprises
- 5.1.2. SMEs
- 5.2. Market Analysis, Insights and Forecast - by Types
- 5.2.1. Cloud-based
- 5.2.2. On-premise
- 5.3. Market Analysis, Insights and Forecast - by Region
- 5.3.1. North America
- 5.3.2. South America
- 5.3.3. Europe
- 5.3.4. Middle East & Africa
- 5.3.5. Asia Pacific
- 5.1. Market Analysis, Insights and Forecast - by Application
- 6. Global Value Stream Management Platform Analysis, Insights and Forecast, 2021-2033
- 6.1. Market Analysis, Insights and Forecast - by Application
- 6.1.1. Large Enterprises
- 6.1.2. SMEs
- 6.2. Market Analysis, Insights and Forecast - by Types
- 6.2.1. Cloud-based
- 6.2.2. On-premise
- 6.1. Market Analysis, Insights and Forecast - by Application
- 7. North America Value Stream Management Platform Analysis, Insights and Forecast, 2021-2033
- 7.1. Market Analysis, Insights and Forecast - by Application
- 7.1.1. Large Enterprises
- 7.1.2. SMEs
- 7.2. Market Analysis, Insights and Forecast - by Types
- 7.2.1. Cloud-based
- 7.2.2. On-premise
- 7.1. Market Analysis, Insights and Forecast - by Application
- 8. South America Value Stream Management Platform Analysis, Insights and Forecast, 2021-2033
- 8.1. Market Analysis, Insights and Forecast - by Application
- 8.1.1. Large Enterprises
- 8.1.2. SMEs
- 8.2. Market Analysis, Insights and Forecast - by Types
- 8.2.1. Cloud-based
- 8.2.2. On-premise
- 8.1. Market Analysis, Insights and Forecast - by Application
- 9. Europe Value Stream Management Platform Analysis, Insights and Forecast, 2021-2033
- 9.1. Market Analysis, Insights and Forecast - by Application
- 9.1.1. Large Enterprises
- 9.1.2. SMEs
- 9.2. Market Analysis, Insights and Forecast - by Types
- 9.2.1. Cloud-based
- 9.2.2. On-premise
- 9.1. Market Analysis, Insights and Forecast - by Application
- 10. Middle East & Africa Value Stream Management Platform Analysis, Insights and Forecast, 2021-2033
- 10.1. Market Analysis, Insights and Forecast - by Application
- 10.1.1. Large Enterprises
- 10.1.2. SMEs
- 10.2. Market Analysis, Insights and Forecast - by Types
- 10.2.1. Cloud-based
- 10.2.2. On-premise
- 10.1. Market Analysis, Insights and Forecast - by Application
- 11. Asia Pacific Value Stream Management Platform Analysis, Insights and Forecast, 2021-2033
- 11.1. Market Analysis, Insights and Forecast - by Application
- 11.1.1. Large Enterprises
- 11.1.2. SMEs
- 11.2. Market Analysis, Insights and Forecast - by Types
- 11.2.1. Cloud-based
- 11.2.2. On-premise
- 11.1. Market Analysis, Insights and Forecast - by Application
- 12. Competitive Analysis
- 12.1. Company Profiles
- 12.1.1 LeanIX
- 12.1.1.1. Company Overview
- 12.1.1.2. Products
- 12.1.1.3. Company Financials
- 12.1.1.4. SWOT Analysis
- 12.1.2 Apptio Targetprocess
- 12.1.2.1. Company Overview
- 12.1.2.2. Products
- 12.1.2.3. Company Financials
- 12.1.2.4. SWOT Analysis
- 12.1.3 Broadcom
- 12.1.3.1. Company Overview
- 12.1.3.2. Products
- 12.1.3.3. Company Financials
- 12.1.3.4. SWOT Analysis
- 12.1.4 CloudBees
- 12.1.4.1. Company Overview
- 12.1.4.2. Products
- 12.1.4.3. Company Financials
- 12.1.4.4. SWOT Analysis
- 12.1.5 GitLab
- 12.1.5.1. Company Overview
- 12.1.5.2. Products
- 12.1.5.3. Company Financials
- 12.1.5.4. SWOT Analysis
- 12.1.6 codeBeamer
- 12.1.6.1. Company Overview
- 12.1.6.2. Products
- 12.1.6.3. Company Financials
- 12.1.6.4. SWOT Analysis
- 12.1.7 Infosys (Panaya)
- 12.1.7.1. Company Overview
- 12.1.7.2. Products
- 12.1.7.3. Company Financials
- 12.1.7.4. SWOT Analysis
- 12.1.8 Storyteller
- 12.1.8.1. Company Overview
- 12.1.8.2. Products
- 12.1.8.3. Company Financials
- 12.1.8.4. SWOT Analysis
- 12.1.9 Digital.ai
- 12.1.9.1. Company Overview
- 12.1.9.2. Products
- 12.1.9.3. Company Financials
- 12.1.9.4. SWOT Analysis
- 12.1.10 ConnectALL
- 12.1.10.1. Company Overview
- 12.1.10.2. Products
- 12.1.10.3. Company Financials
- 12.1.10.4. SWOT Analysis
- 12.1.11 Plutora
- 12.1.11.1. Company Overview
- 12.1.11.2. Products
- 12.1.11.3. Company Financials
- 12.1.11.4. SWOT Analysis
- 12.1.12 Tasktop
- 12.1.12.1. Company Overview
- 12.1.12.2. Products
- 12.1.12.3. Company Financials
- 12.1.12.4. SWOT Analysis
- 12.1.13 Opsera
- 12.1.13.1. Company Overview
- 12.1.13.2. Products
- 12.1.13.3. Company Financials
- 12.1.13.4. SWOT Analysis
- 12.1.14 Jellyfish
- 12.1.14.1. Company Overview
- 12.1.14.2. Products
- 12.1.14.3. Company Financials
- 12.1.14.4. SWOT Analysis
- 12.1.15 LinearB
- 12.1.15.1. Company Overview
- 12.1.15.2. Products
- 12.1.15.3. Company Financials
- 12.1.15.4. SWOT Analysis
- 12.1.16 Propelo
- 12.1.16.1. Company Overview
- 12.1.16.2. Products
- 12.1.16.3. Company Financials
- 12.1.16.4. SWOT Analysis
- 12.1.17 HCL Technologies
- 12.1.17.1. Company Overview
- 12.1.17.2. Products
- 12.1.17.3. Company Financials
- 12.1.17.4. SWOT Analysis
- 12.1.18 Plandek
- 12.1.18.1. Company Overview
- 12.1.18.2. Products
- 12.1.18.3. Company Financials
- 12.1.18.4. SWOT Analysis
- 12.1.19 ServiceNow
- 12.1.19.1. Company Overview
- 12.1.19.2. Products
- 12.1.19.3. Company Financials
- 12.1.19.4. SWOT Analysis
- 12.1.1 LeanIX
- 12.2. Market Entropy
- 12.2.1 Company's Key Areas Served
- 12.2.2 Recent Developments
- 12.3. Company Market Share Analysis 2025
- 12.3.1 Top 5 Companies Market Share Analysis
- 12.3.2 Top 3 Companies Market Share Analysis
- 12.4. List of Potential Customers
- 13. Research Methodology
List of Figures
- Figure 1: Global Value Stream Management Platform Revenue Breakdown (million, %) by Region 2025 & 2033
- Figure 2: North America Value Stream Management Platform Revenue (million), by Application 2025 & 2033
- Figure 3: North America Value Stream Management Platform Revenue Share (%), by Application 2025 & 2033
- Figure 4: North America Value Stream Management Platform Revenue (million), by Types 2025 & 2033
- Figure 5: North America Value Stream Management Platform Revenue Share (%), by Types 2025 & 2033
- Figure 6: North America Value Stream Management Platform Revenue (million), by Country 2025 & 2033
- Figure 7: North America Value Stream Management Platform Revenue Share (%), by Country 2025 & 2033
- Figure 8: South America Value Stream Management Platform Revenue (million), by Application 2025 & 2033
- Figure 9: South America Value Stream Management Platform Revenue Share (%), by Application 2025 & 2033
- Figure 10: South America Value Stream Management Platform Revenue (million), by Types 2025 & 2033
- Figure 11: South America Value Stream Management Platform Revenue Share (%), by Types 2025 & 2033
- Figure 12: South America Value Stream Management Platform Revenue (million), by Country 2025 & 2033
- Figure 13: South America Value Stream Management Platform Revenue Share (%), by Country 2025 & 2033
- Figure 14: Europe Value Stream Management Platform Revenue (million), by Application 2025 & 2033
- Figure 15: Europe Value Stream Management Platform Revenue Share (%), by Application 2025 & 2033
- Figure 16: Europe Value Stream Management Platform Revenue (million), by Types 2025 & 2033
- Figure 17: Europe Value Stream Management Platform Revenue Share (%), by Types 2025 & 2033
- Figure 18: Europe Value Stream Management Platform Revenue (million), by Country 2025 & 2033
- Figure 19: Europe Value Stream Management Platform Revenue Share (%), by Country 2025 & 2033
- Figure 20: Middle East & Africa Value Stream Management Platform Revenue (million), by Application 2025 & 2033
- Figure 21: Middle East & Africa Value Stream Management Platform Revenue Share (%), by Application 2025 & 2033
- Figure 22: Middle East & Africa Value Stream Management Platform Revenue (million), by Types 2025 & 2033
- Figure 23: Middle East & Africa Value Stream Management Platform Revenue Share (%), by Types 2025 & 2033
- Figure 24: Middle East & Africa Value Stream Management Platform Revenue (million), by Country 2025 & 2033
- Figure 25: Middle East & Africa Value Stream Management Platform Revenue Share (%), by Country 2025 & 2033
- Figure 26: Asia Pacific Value Stream Management Platform Revenue (million), by Application 2025 & 2033
- Figure 27: Asia Pacific Value Stream Management Platform Revenue Share (%), by Application 2025 & 2033
- Figure 28: Asia Pacific Value Stream Management Platform Revenue (million), by Types 2025 & 2033
- Figure 29: Asia Pacific Value Stream Management Platform Revenue Share (%), by Types 2025 & 2033
- Figure 30: Asia Pacific Value Stream Management Platform Revenue (million), by Country 2025 & 2033
- Figure 31: Asia Pacific Value Stream Management Platform Revenue Share (%), by Country 2025 & 2033
List of Tables
- Table 1: Global Value Stream Management Platform Revenue million Forecast, by Application 2020 & 2033
- Table 2: Global Value Stream Management Platform Revenue million Forecast, by Types 2020 & 2033
- Table 3: Global Value Stream Management Platform Revenue million Forecast, by Region 2020 & 2033
- Table 4: Global Value Stream Management Platform Revenue million Forecast, by Application 2020 & 2033
- Table 5: Global Value Stream Management Platform Revenue million Forecast, by Types 2020 & 2033
- Table 6: Global Value Stream Management Platform Revenue million Forecast, by Country 2020 & 2033
- Table 7: United States Value Stream Management Platform Revenue (million) Forecast, by Application 2020 & 2033
- Table 8: Canada Value Stream Management Platform Revenue (million) Forecast, by Application 2020 & 2033
- Table 9: Mexico Value Stream Management Platform Revenue (million) Forecast, by Application 2020 & 2033
- Table 10: Global Value Stream Management Platform Revenue million Forecast, by Application 2020 & 2033
- Table 11: Global Value Stream Management Platform Revenue million Forecast, by Types 2020 & 2033
- Table 12: Global Value Stream Management Platform Revenue million Forecast, by Country 2020 & 2033
- Table 13: Brazil Value Stream Management Platform Revenue (million) Forecast, by Application 2020 & 2033
- Table 14: Argentina Value Stream Management Platform Revenue (million) Forecast, by Application 2020 & 2033
- Table 15: Rest of South America Value Stream Management Platform Revenue (million) Forecast, by Application 2020 & 2033
- Table 16: Global Value Stream Management Platform Revenue million Forecast, by Application 2020 & 2033
- Table 17: Global Value Stream Management Platform Revenue million Forecast, by Types 2020 & 2033
- Table 18: Global Value Stream Management Platform Revenue million Forecast, by Country 2020 & 2033
- Table 19: United Kingdom Value Stream Management Platform Revenue (million) Forecast, by Application 2020 & 2033
- Table 20: Germany Value Stream Management Platform Revenue (million) Forecast, by Application 2020 & 2033
- Table 21: France Value Stream Management Platform Revenue (million) Forecast, by Application 2020 & 2033
- Table 22: Italy Value Stream Management Platform Revenue (million) Forecast, by Application 2020 & 2033
- Table 23: Spain Value Stream Management Platform Revenue (million) Forecast, by Application 2020 & 2033
- Table 24: Russia Value Stream Management Platform Revenue (million) Forecast, by Application 2020 & 2033
- Table 25: Benelux Value Stream Management Platform Revenue (million) Forecast, by Application 2020 & 2033
- Table 26: Nordics Value Stream Management Platform Revenue (million) Forecast, by Application 2020 & 2033
- Table 27: Rest of Europe Value Stream Management Platform Revenue (million) Forecast, by Application 2020 & 2033
- Table 28: Global Value Stream Management Platform Revenue million Forecast, by Application 2020 & 2033
- Table 29: Global Value Stream Management Platform Revenue million Forecast, by Types 2020 & 2033
- Table 30: Global Value Stream Management Platform Revenue million Forecast, by Country 2020 & 2033
- Table 31: Turkey Value Stream Management Platform Revenue (million) Forecast, by Application 2020 & 2033
- Table 32: Israel Value Stream Management Platform Revenue (million) Forecast, by Application 2020 & 2033
- Table 33: GCC Value Stream Management Platform Revenue (million) Forecast, by Application 2020 & 2033
- Table 34: North Africa Value Stream Management Platform Revenue (million) Forecast, by Application 2020 & 2033
- Table 35: South Africa Value Stream Management Platform Revenue (million) Forecast, by Application 2020 & 2033
- Table 36: Rest of Middle East & Africa Value Stream Management Platform Revenue (million) Forecast, by Application 2020 & 2033
- Table 37: Global Value Stream Management Platform Revenue million Forecast, by Application 2020 & 2033
- Table 38: Global Value Stream Management Platform Revenue million Forecast, by Types 2020 & 2033
- Table 39: Global Value Stream Management Platform Revenue million Forecast, by Country 2020 & 2033
- Table 40: China Value Stream Management Platform Revenue (million) Forecast, by Application 2020 & 2033
- Table 41: India Value Stream Management Platform Revenue (million) Forecast, by Application 2020 & 2033
- Table 42: Japan Value Stream Management Platform Revenue (million) Forecast, by Application 2020 & 2033
- Table 43: South Korea Value Stream Management Platform Revenue (million) Forecast, by Application 2020 & 2033
- Table 44: ASEAN Value Stream Management Platform Revenue (million) Forecast, by Application 2020 & 2033
- Table 45: Oceania Value Stream Management Platform Revenue (million) Forecast, by Application 2020 & 2033
- Table 46: Rest of Asia Pacific Value Stream Management Platform Revenue (million) Forecast, by Application 2020 & 2033
Frequently Asked Questions
1. What is the projected Compound Annual Growth Rate (CAGR) of the Value Stream Management Platform?
The projected CAGR is approximately 9.8%.
2. Which companies are prominent players in the Value Stream Management Platform?
Key companies in the market include LeanIX, Apptio Targetprocess, Broadcom, CloudBees, GitLab, codeBeamer, Infosys (Panaya), Storyteller, Digital.ai, ConnectALL, Plutora, Tasktop, Opsera, Jellyfish, LinearB, Propelo, HCL Technologies, Plandek, ServiceNow.
3. What are the main segments of the Value Stream Management Platform?
The market segments include Application, Types.
4. Can you provide details about the market size?
The market size is estimated to be USD 480.5 million as of 2022.
5. What are some drivers contributing to market growth?
N/A
6. What are the notable trends driving market growth?
N/A
7. Are there any restraints impacting market growth?
N/A
8. Can you provide examples of recent developments in the market?
N/A
9. What pricing options are available for accessing the report?
Pricing options include single-user, multi-user, and enterprise licenses priced at USD 3350.00, USD 5025.00, and USD 6700.00 respectively.
10. Is the market size provided in terms of value or volume?
The market size is provided in terms of value, measured in million.
11. Are there any specific market keywords associated with the report?
Yes, the market keyword associated with the report is "Value Stream Management Platform," which aids in identifying and referencing the specific market segment covered.
12. How do I determine which pricing option suits my needs best?
The pricing options vary based on user requirements and access needs. Individual users may opt for single-user licenses, while businesses requiring broader access may choose multi-user or enterprise licenses for cost-effective access to the report.
13. Are there any additional resources or data provided in the Value Stream Management Platform report?
While the report offers comprehensive insights, it's advisable to review the specific contents or supplementary materials provided to ascertain if additional resources or data are available.
14. How can I stay updated on further developments or reports in the Value Stream Management Platform?
To stay informed about further developments, trends, and reports in the Value Stream Management Platform, consider subscribing to industry newsletters, following relevant companies and organizations, or regularly checking reputable industry news sources and publications.
Methodology
Step 1 - Identification of Relevant Samples Size from Population Database


Step 2 - Approaches for Defining Global Market Size (Value, Volume* & Price*)

Note*: In applicable scenarios
Step 3 - Data Sources
Primary Research
- Web Analytics
- Survey Reports
- Research Institute
- Latest Research Reports
- Opinion Leaders
Secondary Research
- Annual Reports
- White Paper
- Latest Press Release
- Industry Association
- Paid Database
- Investor Presentations

Step 4 - Data Triangulation
Involves using different sources of information in order to increase the validity of a study
These sources are likely to be stakeholders in a program - participants, other researchers, program staff, other community members, and so on.
Then we put all data in single framework & apply various statistical tools to find out the dynamic on the market.
During the analysis stage, feedback from the stakeholder groups would be compared to determine areas of agreement as well as areas of divergence