
Key Insights
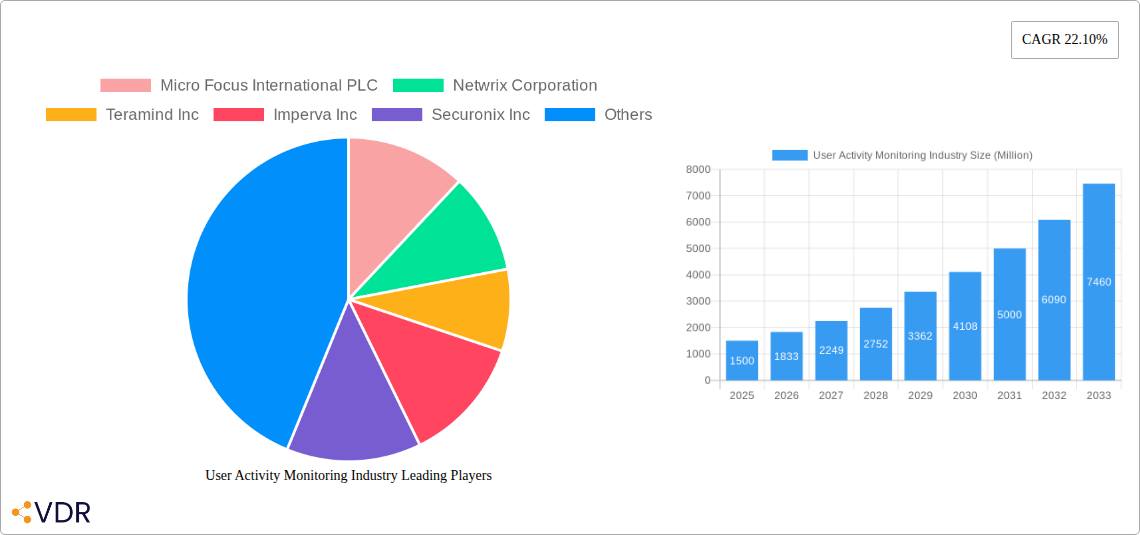
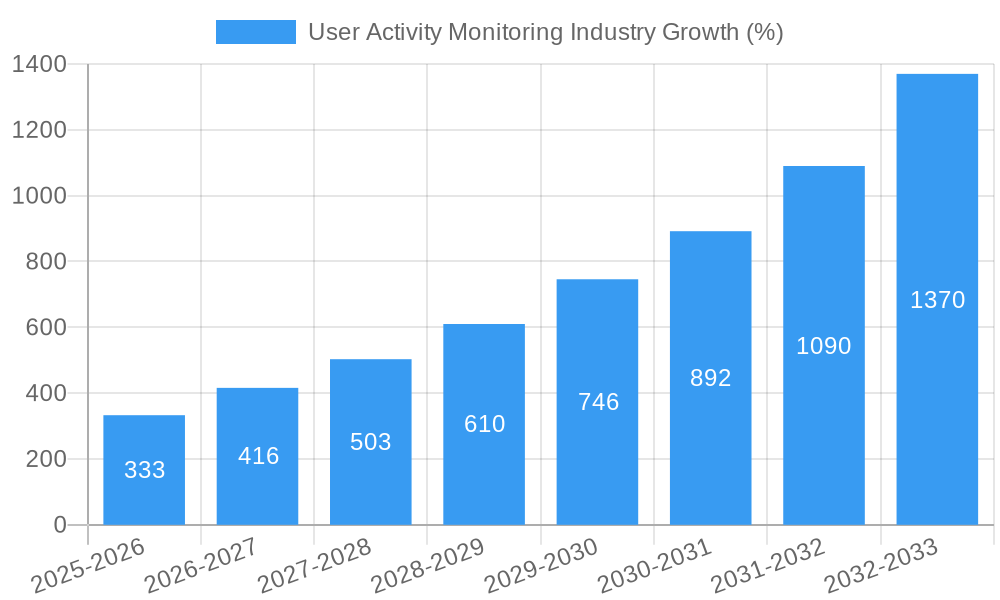
The User Activity Monitoring (UAM) market is experiencing robust growth, driven by increasing concerns about data breaches, insider threats, and regulatory compliance. The market, currently estimated at $XX million in 2025, is projected to witness a Compound Annual Growth Rate (CAGR) of 22.10% from 2025 to 2033. This expansion is fueled by the widespread adoption of cloud computing, remote work environments, and the increasing complexity of IT infrastructures. Organizations across various sectors, including BFSI, retail, IT & Telecom, healthcare, and manufacturing, are increasingly investing in UAM solutions to enhance security posture, improve operational efficiency, and ensure regulatory compliance (e.g., GDPR, CCPA). The rising adoption of advanced analytics and artificial intelligence (AI) within UAM platforms further contributes to market growth, enabling more accurate threat detection and proactive risk mitigation. The market is segmented by application (system, application, file, network, and database monitoring), enterprise size (SMEs and large enterprises), and end-user industry. Large enterprises currently dominate the market due to their higher budgets and sophisticated security requirements, but the SME segment is expected to experience significant growth in the coming years.
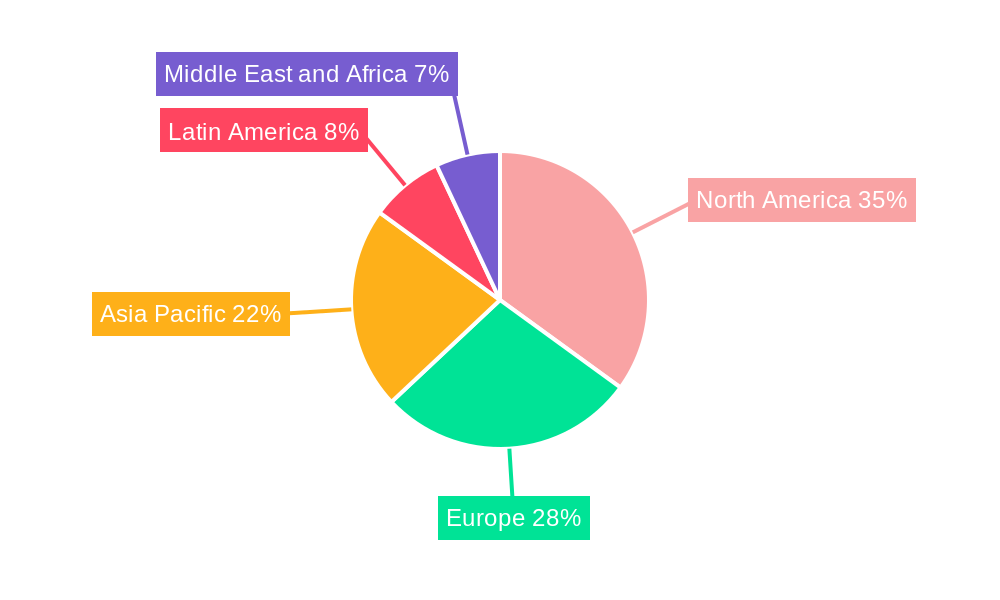
The competitive landscape is characterized by a mix of established players and emerging technology providers. Key vendors such as Micro Focus, Netwrix, Teramind, Imperva, Securonix, LogRhythm, Centrify, CyberArk, Splunk, and Forcepoint are actively innovating and expanding their product offerings to meet evolving market demands. Geographic growth is expected across all regions, with North America and Europe maintaining significant market shares due to early adoption and stringent data protection regulations. However, the Asia-Pacific region is projected to exhibit the fastest growth rate driven by increasing digitalization and rising cybersecurity concerns. While the market faces restraints such as high implementation costs and integration complexities, the overarching benefits of enhanced security and improved productivity are driving sustained and significant market expansion.
User Activity Monitoring Industry Market Report: 2019-2033
This comprehensive report provides an in-depth analysis of the User Activity Monitoring (UAM) industry, encompassing market dynamics, growth trends, competitive landscape, and future outlook. The study period covers 2019-2033, with 2025 as the base and estimated year. The report segments the market by application (System Monitoring, Application Monitoring, File Monitoring, Network Monitoring, Database Monitoring), enterprise size (Small & Medium Enterprises, Large Enterprises), and end-user industry (BFSI, Retail, IT & Telecom, Healthcare, Manufacturing, Other End-user Industries), offering granular insights into this rapidly evolving sector. Key players like Micro Focus International PLC, Netwrix Corporation, Teramind Inc, Imperva Inc, and others are analyzed, providing a complete view of the competitive environment. The report is a must-read for industry professionals, investors, and anyone seeking to understand the intricacies of the UAM market.
User Activity Monitoring Industry Market Dynamics & Structure
The User Activity Monitoring (UAM) market is experiencing robust growth, driven by increasing cyber threats and the need for enhanced security and compliance. Market concentration is moderate, with several key players competing fiercely. Technological innovation, particularly in AI and machine learning for threat detection, is a major growth driver. Regulatory frameworks like GDPR and CCPA are influencing market dynamics, pushing organizations to adopt robust UAM solutions. The market also faces competition from related security solutions, prompting continuous product evolution. Mergers and acquisitions are relatively frequent, reflecting the consolidation trend within the industry.
- Market Concentration: Moderately concentrated, with top 5 players holding approximately xx% market share in 2024 (estimated).
- Technological Innovation: AI and ML-driven threat detection, improved data analytics, and automation are key innovations.
- Regulatory Frameworks: GDPR, CCPA, and other data privacy regulations drive demand for UAM solutions.
- Competitive Substitutes: Intrusion detection systems (IDS), security information and event management (SIEM) systems.
- End-User Demographics: Large enterprises dominate the market due to their higher cybersecurity budgets and complex IT infrastructure, but SME adoption is also increasing.
- M&A Trends: A moderate number of M&A deals were observed between 2019-2024, with an estimated xx deals annually, indicating ongoing market consolidation.
User Activity Monitoring Industry Growth Trends & Insights
The UAM market is witnessing significant growth, driven by escalating cyberattacks, rising data breaches, and the increasing need for regulatory compliance. The market size reached approximately $XX million in 2024 and is projected to experience a Compound Annual Growth Rate (CAGR) of xx% from 2025 to 2033, reaching $XX million by 2033. Adoption rates are increasing across various sectors, especially in BFSI and IT & Telecom due to heightened security concerns. Technological disruptions, such as the increasing use of cloud-based UAM solutions, are reshaping the market landscape. Shifting consumer behavior, with a growing emphasis on data privacy and security, is further fueling market expansion. Market penetration is currently at xx% and is expected to reach xx% by 2033.
Dominant Regions, Countries, or Segments in User Activity Monitoring Industry
North America currently holds the largest market share in the UAM industry, followed by Europe, due to high cybersecurity spending and stringent data privacy regulations. Within the application segments, Network Monitoring and System Monitoring currently dominate due to their broad applicability. Large Enterprises are the primary adopters, driven by their complex IT infrastructure and heightened security risks. The BFSI sector leads among end-user industries due to strict regulatory compliance and high-value data assets.
- Key Drivers:
- Strong government regulations and enforcement in North America and Europe
- Increased focus on cybersecurity due to high-profile data breaches
- Rising adoption of cloud computing and remote work models
- Growing awareness of data privacy concerns
- Dominance Factors:
- High cybersecurity spending in North America and Europe
- Stringent data privacy regulations in these regions
- Large enterprise adoption of UAM solutions
- Broad applicability of Network and System Monitoring across industries.
User Activity Monitoring Industry Product Landscape
The UAM market offers a range of products, from basic log management tools to advanced AI-powered threat detection platforms. Product innovation focuses on improving accuracy, reducing false positives, and enhancing user experience. Key features include real-time monitoring, user behavior analytics, threat detection, and automated alerts. Unique selling propositions (USPs) often revolve around specific industry verticals, ease of integration with existing security solutions, or advanced analytics capabilities. Advancements in AI/ML algorithms enable more accurate threat detection and proactive risk mitigation.
Key Drivers, Barriers & Challenges in User Activity Monitoring Industry
Key Drivers:
- The rising frequency and sophistication of cyberattacks are the primary driver, pushing organizations to adopt proactive security measures.
- Increasing regulatory compliance requirements and hefty fines for non-compliance are strong motivators for adoption.
- The expanding adoption of cloud computing and remote work necessitates robust UAM solutions for securing dispersed infrastructure.
Key Challenges & Restraints:
- High initial investment costs for implementing UAM systems can be a barrier for smaller organizations.
- Complexity of managing and analyzing large volumes of data can be a hurdle for some users.
- Ensuring user privacy while effectively monitoring activity requires careful balance and compliance with data protection regulations.
Emerging Opportunities in User Activity Monitoring Industry
The UAM market presents several promising opportunities. The growing adoption of IoT devices creates demand for specialized UAM solutions to monitor and secure these interconnected systems. Increased adoption of cloud-based UAM solutions promises to simplify deployment and reduce IT infrastructure costs. Advanced analytics and AI/ML will improve threat detection and response capabilities. Finally, expansion into developing economies with rising cybersecurity awareness offers significant potential.
Growth Accelerators in the User Activity Monitoring Industry
Technological advancements, particularly in AI/ML-powered threat detection, are significantly accelerating UAM market growth. Strategic partnerships between UAM vendors and cybersecurity solution providers are enhancing market penetration and offering bundled solutions. Expansion into untapped markets, such as the healthcare and manufacturing sectors, presents significant opportunities for expansion.
Key Players Shaping the User Activity Monitoring Industry Market
- Micro Focus International PLC
- Netwrix Corporation
- Teramind Inc
- Imperva Inc
- Securonix Inc
- LogRhythm Inc
- Centrify Corporation
- CyberArk Software Ltd
- Ezwim B V
- Splunk Inc
- Forcepoint
- List Not Exhaustive
Notable Milestones in User Activity Monitoring Industry Sector
- July 2022: Imperva Inc announced Imperva Data Security Fabric (DSF), enhancing data protection for AWS enterprise data lakes. This strengthened Imperva's market position and expanded its AWS customer base.
- May 2022: CyberArk Software Ltd launched CyberArk Ventures, a USD 30 million investment fund fostering innovation in cybersecurity. This strategic move supports the development of new technologies and expands CyberArk's influence within the industry ecosystem.
In-Depth User Activity Monitoring Industry Market Outlook
The future of the UAM market is bright, driven by the persistent threat landscape, regulatory pressure, and continuous technological innovation. Opportunities for growth lie in the development of AI-driven threat intelligence, advanced analytics, and enhanced integration with other cybersecurity tools. Strategic partnerships and expansion into new market segments will further propel market growth. The continued shift towards cloud computing and remote work models will require robust and adaptive UAM solutions, further fueling market expansion.
User Activity Monitoring Industry Segmentation
-
1. Application
- 1.1. System Monitoring
- 1.2. Application Monitoring
- 1.3. File Monitoring
- 1.4. Network Monitoring
- 1.5. Database Monitoring
-
2. Enterprise
- 2.1. Small & Medium Enterprises
- 2.2. Large Enterprises
-
3. End-user Industry
- 3.1. BFSI
- 3.2. Retail
- 3.3. IT & Telecom
- 3.4. Healthcare
- 3.5. Manufacturing
- 3.6. Other End-user Industries
User Activity Monitoring Industry Segmentation By Geography
- 1. North America
- 2. Europe
- 3. Asia Pacific
- 4. Latin America
- 5. Middle East and Africa
User Activity Monitoring Industry REPORT HIGHLIGHTS
| Aspects | Details |
|---|---|
| Study Period | 2019-2033 |
| Base Year | 2024 |
| Estimated Year | 2025 |
| Forecast Period | 2025-2033 |
| Historical Period | 2019-2024 |
| Growth Rate | CAGR of 22.10% from 2019-2033 |
| Segmentation |
|
Table of Contents
- 1. Introduction
- 1.1. Research Scope
- 1.2. Market Segmentation
- 1.3. Research Methodology
- 1.4. Definitions and Assumptions
- 2. Executive Summary
- 2.1. Introduction
- 3. Market Dynamics
- 3.1. Introduction
- 3.2. Market Drivers
- 3.2.1. Increasing Need Among Organizations to Optimize Employee Productivity; Need for Enhanced Control Over Employees and Third-Party Vendors in Enterprises
- 3.3. Market Restrains
- 3.3.1. High Cost of Innovation for Developing Robust UAM Solutions
- 3.4. Market Trends
- 3.4.1. Increasing Need Among Organizations to Optimize Employee Productivity to Drive the Market Growth
- 4. Market Factor Analysis
- 4.1. Porters Five Forces
- 4.2. Supply/Value Chain
- 4.3. PESTEL analysis
- 4.4. Market Entropy
- 4.5. Patent/Trademark Analysis
- 5. Global User Activity Monitoring Industry Analysis, Insights and Forecast, 2019-2031
- 5.1. Market Analysis, Insights and Forecast - by Application
- 5.1.1. System Monitoring
- 5.1.2. Application Monitoring
- 5.1.3. File Monitoring
- 5.1.4. Network Monitoring
- 5.1.5. Database Monitoring
- 5.2. Market Analysis, Insights and Forecast - by Enterprise
- 5.2.1. Small & Medium Enterprises
- 5.2.2. Large Enterprises
- 5.3. Market Analysis, Insights and Forecast - by End-user Industry
- 5.3.1. BFSI
- 5.3.2. Retail
- 5.3.3. IT & Telecom
- 5.3.4. Healthcare
- 5.3.5. Manufacturing
- 5.3.6. Other End-user Industries
- 5.4. Market Analysis, Insights and Forecast - by Region
- 5.4.1. North America
- 5.4.2. Europe
- 5.4.3. Asia Pacific
- 5.4.4. Latin America
- 5.4.5. Middle East and Africa
- 5.1. Market Analysis, Insights and Forecast - by Application
- 6. North America User Activity Monitoring Industry Analysis, Insights and Forecast, 2019-2031
- 6.1. Market Analysis, Insights and Forecast - by Application
- 6.1.1. System Monitoring
- 6.1.2. Application Monitoring
- 6.1.3. File Monitoring
- 6.1.4. Network Monitoring
- 6.1.5. Database Monitoring
- 6.2. Market Analysis, Insights and Forecast - by Enterprise
- 6.2.1. Small & Medium Enterprises
- 6.2.2. Large Enterprises
- 6.3. Market Analysis, Insights and Forecast - by End-user Industry
- 6.3.1. BFSI
- 6.3.2. Retail
- 6.3.3. IT & Telecom
- 6.3.4. Healthcare
- 6.3.5. Manufacturing
- 6.3.6. Other End-user Industries
- 6.1. Market Analysis, Insights and Forecast - by Application
- 7. Europe User Activity Monitoring Industry Analysis, Insights and Forecast, 2019-2031
- 7.1. Market Analysis, Insights and Forecast - by Application
- 7.1.1. System Monitoring
- 7.1.2. Application Monitoring
- 7.1.3. File Monitoring
- 7.1.4. Network Monitoring
- 7.1.5. Database Monitoring
- 7.2. Market Analysis, Insights and Forecast - by Enterprise
- 7.2.1. Small & Medium Enterprises
- 7.2.2. Large Enterprises
- 7.3. Market Analysis, Insights and Forecast - by End-user Industry
- 7.3.1. BFSI
- 7.3.2. Retail
- 7.3.3. IT & Telecom
- 7.3.4. Healthcare
- 7.3.5. Manufacturing
- 7.3.6. Other End-user Industries
- 7.1. Market Analysis, Insights and Forecast - by Application
- 8. Asia Pacific User Activity Monitoring Industry Analysis, Insights and Forecast, 2019-2031
- 8.1. Market Analysis, Insights and Forecast - by Application
- 8.1.1. System Monitoring
- 8.1.2. Application Monitoring
- 8.1.3. File Monitoring
- 8.1.4. Network Monitoring
- 8.1.5. Database Monitoring
- 8.2. Market Analysis, Insights and Forecast - by Enterprise
- 8.2.1. Small & Medium Enterprises
- 8.2.2. Large Enterprises
- 8.3. Market Analysis, Insights and Forecast - by End-user Industry
- 8.3.1. BFSI
- 8.3.2. Retail
- 8.3.3. IT & Telecom
- 8.3.4. Healthcare
- 8.3.5. Manufacturing
- 8.3.6. Other End-user Industries
- 8.1. Market Analysis, Insights and Forecast - by Application
- 9. Latin America User Activity Monitoring Industry Analysis, Insights and Forecast, 2019-2031
- 9.1. Market Analysis, Insights and Forecast - by Application
- 9.1.1. System Monitoring
- 9.1.2. Application Monitoring
- 9.1.3. File Monitoring
- 9.1.4. Network Monitoring
- 9.1.5. Database Monitoring
- 9.2. Market Analysis, Insights and Forecast - by Enterprise
- 9.2.1. Small & Medium Enterprises
- 9.2.2. Large Enterprises
- 9.3. Market Analysis, Insights and Forecast - by End-user Industry
- 9.3.1. BFSI
- 9.3.2. Retail
- 9.3.3. IT & Telecom
- 9.3.4. Healthcare
- 9.3.5. Manufacturing
- 9.3.6. Other End-user Industries
- 9.1. Market Analysis, Insights and Forecast - by Application
- 10. Middle East and Africa User Activity Monitoring Industry Analysis, Insights and Forecast, 2019-2031
- 10.1. Market Analysis, Insights and Forecast - by Application
- 10.1.1. System Monitoring
- 10.1.2. Application Monitoring
- 10.1.3. File Monitoring
- 10.1.4. Network Monitoring
- 10.1.5. Database Monitoring
- 10.2. Market Analysis, Insights and Forecast - by Enterprise
- 10.2.1. Small & Medium Enterprises
- 10.2.2. Large Enterprises
- 10.3. Market Analysis, Insights and Forecast - by End-user Industry
- 10.3.1. BFSI
- 10.3.2. Retail
- 10.3.3. IT & Telecom
- 10.3.4. Healthcare
- 10.3.5. Manufacturing
- 10.3.6. Other End-user Industries
- 10.1. Market Analysis, Insights and Forecast - by Application
- 11. North America User Activity Monitoring Industry Analysis, Insights and Forecast, 2019-2031
- 11.1. Market Analysis, Insights and Forecast - By Country/Sub-region
- 11.1.1.
- 12. Europe User Activity Monitoring Industry Analysis, Insights and Forecast, 2019-2031
- 12.1. Market Analysis, Insights and Forecast - By Country/Sub-region
- 12.1.1.
- 13. Asia Pacific User Activity Monitoring Industry Analysis, Insights and Forecast, 2019-2031
- 13.1. Market Analysis, Insights and Forecast - By Country/Sub-region
- 13.1.1.
- 14. Latin America User Activity Monitoring Industry Analysis, Insights and Forecast, 2019-2031
- 14.1. Market Analysis, Insights and Forecast - By Country/Sub-region
- 14.1.1.
- 15. Middle East and Africa User Activity Monitoring Industry Analysis, Insights and Forecast, 2019-2031
- 15.1. Market Analysis, Insights and Forecast - By Country/Sub-region
- 15.1.1.
- 16. Competitive Analysis
- 16.1. Global Market Share Analysis 2024
- 16.2. Company Profiles
- 16.2.1 Micro Focus International PLC
- 16.2.1.1. Overview
- 16.2.1.2. Products
- 16.2.1.3. SWOT Analysis
- 16.2.1.4. Recent Developments
- 16.2.1.5. Financials (Based on Availability)
- 16.2.2 Netwrix Corporation
- 16.2.2.1. Overview
- 16.2.2.2. Products
- 16.2.2.3. SWOT Analysis
- 16.2.2.4. Recent Developments
- 16.2.2.5. Financials (Based on Availability)
- 16.2.3 Teramind Inc
- 16.2.3.1. Overview
- 16.2.3.2. Products
- 16.2.3.3. SWOT Analysis
- 16.2.3.4. Recent Developments
- 16.2.3.5. Financials (Based on Availability)
- 16.2.4 Imperva Inc
- 16.2.4.1. Overview
- 16.2.4.2. Products
- 16.2.4.3. SWOT Analysis
- 16.2.4.4. Recent Developments
- 16.2.4.5. Financials (Based on Availability)
- 16.2.5 Securonix Inc
- 16.2.5.1. Overview
- 16.2.5.2. Products
- 16.2.5.3. SWOT Analysis
- 16.2.5.4. Recent Developments
- 16.2.5.5. Financials (Based on Availability)
- 16.2.6 LogRhythm Inc
- 16.2.6.1. Overview
- 16.2.6.2. Products
- 16.2.6.3. SWOT Analysis
- 16.2.6.4. Recent Developments
- 16.2.6.5. Financials (Based on Availability)
- 16.2.7 Centrify Corporation
- 16.2.7.1. Overview
- 16.2.7.2. Products
- 16.2.7.3. SWOT Analysis
- 16.2.7.4. Recent Developments
- 16.2.7.5. Financials (Based on Availability)
- 16.2.8 CyberArk Software Ltd
- 16.2.8.1. Overview
- 16.2.8.2. Products
- 16.2.8.3. SWOT Analysis
- 16.2.8.4. Recent Developments
- 16.2.8.5. Financials (Based on Availability)
- 16.2.9 Ezwim B V *List Not Exhaustive
- 16.2.9.1. Overview
- 16.2.9.2. Products
- 16.2.9.3. SWOT Analysis
- 16.2.9.4. Recent Developments
- 16.2.9.5. Financials (Based on Availability)
- 16.2.10 Splunk Inc
- 16.2.10.1. Overview
- 16.2.10.2. Products
- 16.2.10.3. SWOT Analysis
- 16.2.10.4. Recent Developments
- 16.2.10.5. Financials (Based on Availability)
- 16.2.11 Forcepoint
- 16.2.11.1. Overview
- 16.2.11.2. Products
- 16.2.11.3. SWOT Analysis
- 16.2.11.4. Recent Developments
- 16.2.11.5. Financials (Based on Availability)
- 16.2.1 Micro Focus International PLC
List of Figures
- Figure 1: Global User Activity Monitoring Industry Revenue Breakdown (Million, %) by Region 2024 & 2032
- Figure 2: North America User Activity Monitoring Industry Revenue (Million), by Country 2024 & 2032
- Figure 3: North America User Activity Monitoring Industry Revenue Share (%), by Country 2024 & 2032
- Figure 4: Europe User Activity Monitoring Industry Revenue (Million), by Country 2024 & 2032
- Figure 5: Europe User Activity Monitoring Industry Revenue Share (%), by Country 2024 & 2032
- Figure 6: Asia Pacific User Activity Monitoring Industry Revenue (Million), by Country 2024 & 2032
- Figure 7: Asia Pacific User Activity Monitoring Industry Revenue Share (%), by Country 2024 & 2032
- Figure 8: Latin America User Activity Monitoring Industry Revenue (Million), by Country 2024 & 2032
- Figure 9: Latin America User Activity Monitoring Industry Revenue Share (%), by Country 2024 & 2032
- Figure 10: Middle East and Africa User Activity Monitoring Industry Revenue (Million), by Country 2024 & 2032
- Figure 11: Middle East and Africa User Activity Monitoring Industry Revenue Share (%), by Country 2024 & 2032
- Figure 12: North America User Activity Monitoring Industry Revenue (Million), by Application 2024 & 2032
- Figure 13: North America User Activity Monitoring Industry Revenue Share (%), by Application 2024 & 2032
- Figure 14: North America User Activity Monitoring Industry Revenue (Million), by Enterprise 2024 & 2032
- Figure 15: North America User Activity Monitoring Industry Revenue Share (%), by Enterprise 2024 & 2032
- Figure 16: North America User Activity Monitoring Industry Revenue (Million), by End-user Industry 2024 & 2032
- Figure 17: North America User Activity Monitoring Industry Revenue Share (%), by End-user Industry 2024 & 2032
- Figure 18: North America User Activity Monitoring Industry Revenue (Million), by Country 2024 & 2032
- Figure 19: North America User Activity Monitoring Industry Revenue Share (%), by Country 2024 & 2032
- Figure 20: Europe User Activity Monitoring Industry Revenue (Million), by Application 2024 & 2032
- Figure 21: Europe User Activity Monitoring Industry Revenue Share (%), by Application 2024 & 2032
- Figure 22: Europe User Activity Monitoring Industry Revenue (Million), by Enterprise 2024 & 2032
- Figure 23: Europe User Activity Monitoring Industry Revenue Share (%), by Enterprise 2024 & 2032
- Figure 24: Europe User Activity Monitoring Industry Revenue (Million), by End-user Industry 2024 & 2032
- Figure 25: Europe User Activity Monitoring Industry Revenue Share (%), by End-user Industry 2024 & 2032
- Figure 26: Europe User Activity Monitoring Industry Revenue (Million), by Country 2024 & 2032
- Figure 27: Europe User Activity Monitoring Industry Revenue Share (%), by Country 2024 & 2032
- Figure 28: Asia Pacific User Activity Monitoring Industry Revenue (Million), by Application 2024 & 2032
- Figure 29: Asia Pacific User Activity Monitoring Industry Revenue Share (%), by Application 2024 & 2032
- Figure 30: Asia Pacific User Activity Monitoring Industry Revenue (Million), by Enterprise 2024 & 2032
- Figure 31: Asia Pacific User Activity Monitoring Industry Revenue Share (%), by Enterprise 2024 & 2032
- Figure 32: Asia Pacific User Activity Monitoring Industry Revenue (Million), by End-user Industry 2024 & 2032
- Figure 33: Asia Pacific User Activity Monitoring Industry Revenue Share (%), by End-user Industry 2024 & 2032
- Figure 34: Asia Pacific User Activity Monitoring Industry Revenue (Million), by Country 2024 & 2032
- Figure 35: Asia Pacific User Activity Monitoring Industry Revenue Share (%), by Country 2024 & 2032
- Figure 36: Latin America User Activity Monitoring Industry Revenue (Million), by Application 2024 & 2032
- Figure 37: Latin America User Activity Monitoring Industry Revenue Share (%), by Application 2024 & 2032
- Figure 38: Latin America User Activity Monitoring Industry Revenue (Million), by Enterprise 2024 & 2032
- Figure 39: Latin America User Activity Monitoring Industry Revenue Share (%), by Enterprise 2024 & 2032
- Figure 40: Latin America User Activity Monitoring Industry Revenue (Million), by End-user Industry 2024 & 2032
- Figure 41: Latin America User Activity Monitoring Industry Revenue Share (%), by End-user Industry 2024 & 2032
- Figure 42: Latin America User Activity Monitoring Industry Revenue (Million), by Country 2024 & 2032
- Figure 43: Latin America User Activity Monitoring Industry Revenue Share (%), by Country 2024 & 2032
- Figure 44: Middle East and Africa User Activity Monitoring Industry Revenue (Million), by Application 2024 & 2032
- Figure 45: Middle East and Africa User Activity Monitoring Industry Revenue Share (%), by Application 2024 & 2032
- Figure 46: Middle East and Africa User Activity Monitoring Industry Revenue (Million), by Enterprise 2024 & 2032
- Figure 47: Middle East and Africa User Activity Monitoring Industry Revenue Share (%), by Enterprise 2024 & 2032
- Figure 48: Middle East and Africa User Activity Monitoring Industry Revenue (Million), by End-user Industry 2024 & 2032
- Figure 49: Middle East and Africa User Activity Monitoring Industry Revenue Share (%), by End-user Industry 2024 & 2032
- Figure 50: Middle East and Africa User Activity Monitoring Industry Revenue (Million), by Country 2024 & 2032
- Figure 51: Middle East and Africa User Activity Monitoring Industry Revenue Share (%), by Country 2024 & 2032
List of Tables
- Table 1: Global User Activity Monitoring Industry Revenue Million Forecast, by Region 2019 & 2032
- Table 2: Global User Activity Monitoring Industry Revenue Million Forecast, by Application 2019 & 2032
- Table 3: Global User Activity Monitoring Industry Revenue Million Forecast, by Enterprise 2019 & 2032
- Table 4: Global User Activity Monitoring Industry Revenue Million Forecast, by End-user Industry 2019 & 2032
- Table 5: Global User Activity Monitoring Industry Revenue Million Forecast, by Region 2019 & 2032
- Table 6: Global User Activity Monitoring Industry Revenue Million Forecast, by Country 2019 & 2032
- Table 7: User Activity Monitoring Industry Revenue (Million) Forecast, by Application 2019 & 2032
- Table 8: Global User Activity Monitoring Industry Revenue Million Forecast, by Country 2019 & 2032
- Table 9: User Activity Monitoring Industry Revenue (Million) Forecast, by Application 2019 & 2032
- Table 10: Global User Activity Monitoring Industry Revenue Million Forecast, by Country 2019 & 2032
- Table 11: User Activity Monitoring Industry Revenue (Million) Forecast, by Application 2019 & 2032
- Table 12: Global User Activity Monitoring Industry Revenue Million Forecast, by Country 2019 & 2032
- Table 13: User Activity Monitoring Industry Revenue (Million) Forecast, by Application 2019 & 2032
- Table 14: Global User Activity Monitoring Industry Revenue Million Forecast, by Country 2019 & 2032
- Table 15: User Activity Monitoring Industry Revenue (Million) Forecast, by Application 2019 & 2032
- Table 16: Global User Activity Monitoring Industry Revenue Million Forecast, by Application 2019 & 2032
- Table 17: Global User Activity Monitoring Industry Revenue Million Forecast, by Enterprise 2019 & 2032
- Table 18: Global User Activity Monitoring Industry Revenue Million Forecast, by End-user Industry 2019 & 2032
- Table 19: Global User Activity Monitoring Industry Revenue Million Forecast, by Country 2019 & 2032
- Table 20: Global User Activity Monitoring Industry Revenue Million Forecast, by Application 2019 & 2032
- Table 21: Global User Activity Monitoring Industry Revenue Million Forecast, by Enterprise 2019 & 2032
- Table 22: Global User Activity Monitoring Industry Revenue Million Forecast, by End-user Industry 2019 & 2032
- Table 23: Global User Activity Monitoring Industry Revenue Million Forecast, by Country 2019 & 2032
- Table 24: Global User Activity Monitoring Industry Revenue Million Forecast, by Application 2019 & 2032
- Table 25: Global User Activity Monitoring Industry Revenue Million Forecast, by Enterprise 2019 & 2032
- Table 26: Global User Activity Monitoring Industry Revenue Million Forecast, by End-user Industry 2019 & 2032
- Table 27: Global User Activity Monitoring Industry Revenue Million Forecast, by Country 2019 & 2032
- Table 28: Global User Activity Monitoring Industry Revenue Million Forecast, by Application 2019 & 2032
- Table 29: Global User Activity Monitoring Industry Revenue Million Forecast, by Enterprise 2019 & 2032
- Table 30: Global User Activity Monitoring Industry Revenue Million Forecast, by End-user Industry 2019 & 2032
- Table 31: Global User Activity Monitoring Industry Revenue Million Forecast, by Country 2019 & 2032
- Table 32: Global User Activity Monitoring Industry Revenue Million Forecast, by Application 2019 & 2032
- Table 33: Global User Activity Monitoring Industry Revenue Million Forecast, by Enterprise 2019 & 2032
- Table 34: Global User Activity Monitoring Industry Revenue Million Forecast, by End-user Industry 2019 & 2032
- Table 35: Global User Activity Monitoring Industry Revenue Million Forecast, by Country 2019 & 2032
Frequently Asked Questions
1. What is the projected Compound Annual Growth Rate (CAGR) of the User Activity Monitoring Industry?
The projected CAGR is approximately 22.10%.
2. Which companies are prominent players in the User Activity Monitoring Industry?
Key companies in the market include Micro Focus International PLC, Netwrix Corporation, Teramind Inc, Imperva Inc, Securonix Inc, LogRhythm Inc, Centrify Corporation, CyberArk Software Ltd, Ezwim B V *List Not Exhaustive, Splunk Inc, Forcepoint.
3. What are the main segments of the User Activity Monitoring Industry?
The market segments include Application, Enterprise, End-user Industry.
4. Can you provide details about the market size?
The market size is estimated to be USD XX Million as of 2022.
5. What are some drivers contributing to market growth?
Increasing Need Among Organizations to Optimize Employee Productivity; Need for Enhanced Control Over Employees and Third-Party Vendors in Enterprises.
6. What are the notable trends driving market growth?
Increasing Need Among Organizations to Optimize Employee Productivity to Drive the Market Growth.
7. Are there any restraints impacting market growth?
High Cost of Innovation for Developing Robust UAM Solutions.
8. Can you provide examples of recent developments in the market?
July 2022: Imperva Inc announced Imperva Data Security Fabric (DSF) which provides data-centric protection and compliance for enterprise data lakes built on Amazon Web Services (AWS). Imperva reinforced its commitment to securing data and all paths to it by allowing AWS customers to secure their data with one comprehensive platform, leveraging a unified security model across Amazon Aurora, Amazon Redshift, Amazon Relational Database Service (Amazon RDS), Amazon DynamoDB, Amazon Athena, and AWS CloudFormation without requiring any changes to their existing data infrastructure.
9. What pricing options are available for accessing the report?
Pricing options include single-user, multi-user, and enterprise licenses priced at USD 4750, USD 5250, and USD 8750 respectively.
10. Is the market size provided in terms of value or volume?
The market size is provided in terms of value, measured in Million.
11. Are there any specific market keywords associated with the report?
Yes, the market keyword associated with the report is "User Activity Monitoring Industry," which aids in identifying and referencing the specific market segment covered.
12. How do I determine which pricing option suits my needs best?
The pricing options vary based on user requirements and access needs. Individual users may opt for single-user licenses, while businesses requiring broader access may choose multi-user or enterprise licenses for cost-effective access to the report.
13. Are there any additional resources or data provided in the User Activity Monitoring Industry report?
While the report offers comprehensive insights, it's advisable to review the specific contents or supplementary materials provided to ascertain if additional resources or data are available.
14. How can I stay updated on further developments or reports in the User Activity Monitoring Industry?
To stay informed about further developments, trends, and reports in the User Activity Monitoring Industry, consider subscribing to industry newsletters, following relevant companies and organizations, or regularly checking reputable industry news sources and publications.
Methodology
Step 1 - Identification of Relevant Samples Size from Population Database


Step 2 - Approaches for Defining Global Market Size (Value, Volume* & Price*)

Note*: In applicable scenarios
Step 3 - Data Sources
Primary Research
- Web Analytics
- Survey Reports
- Research Institute
- Latest Research Reports
- Opinion Leaders
Secondary Research
- Annual Reports
- White Paper
- Latest Press Release
- Industry Association
- Paid Database
- Investor Presentations

Step 4 - Data Triangulation
Involves using different sources of information in order to increase the validity of a study
These sources are likely to be stakeholders in a program - participants, other researchers, program staff, other community members, and so on.
Then we put all data in single framework & apply various statistical tools to find out the dynamic on the market.
During the analysis stage, feedback from the stakeholder groups would be compared to determine areas of agreement as well as areas of divergence


