
Key Insights
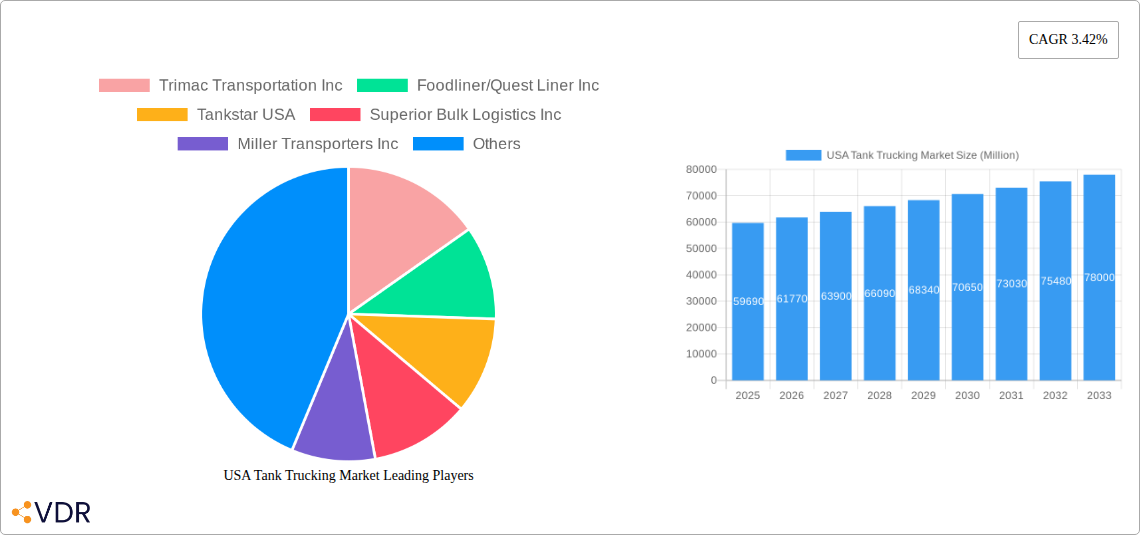
The US Tank Trucking Market, valued at $59.69 billion in 2025, is projected to experience steady growth, driven primarily by the increasing demand for the transportation of bulk liquids across various sectors. The 3.42% CAGR indicates a consistent expansion, fueled by factors such as the growth of e-commerce, leading to a surge in demand for consumer goods, and the continued expansion of the chemical and petroleum industries. Further growth is anticipated from the rising adoption of advanced technologies like telematics and route optimization software to enhance efficiency and safety. Segmentation analysis reveals significant contributions from the heavy-duty vehicle segment, reflecting the need for efficient transportation of large volumes of liquids. The for-hire segment is expected to dominate, driven by the outsourcing of logistics by businesses seeking cost-effectiveness and operational efficiency. Geographic variations exist, with regions like the Southwest and West potentially showing higher growth due to expanding industrial activity and population density. However, challenges such as fluctuating fuel prices, stringent environmental regulations, and driver shortages pose potential restraints to market growth. Major players like Trimac Transportation Inc., Foodliner/Quest Liner Inc., and others are actively engaged in fleet modernization and strategic partnerships to maintain a competitive edge.
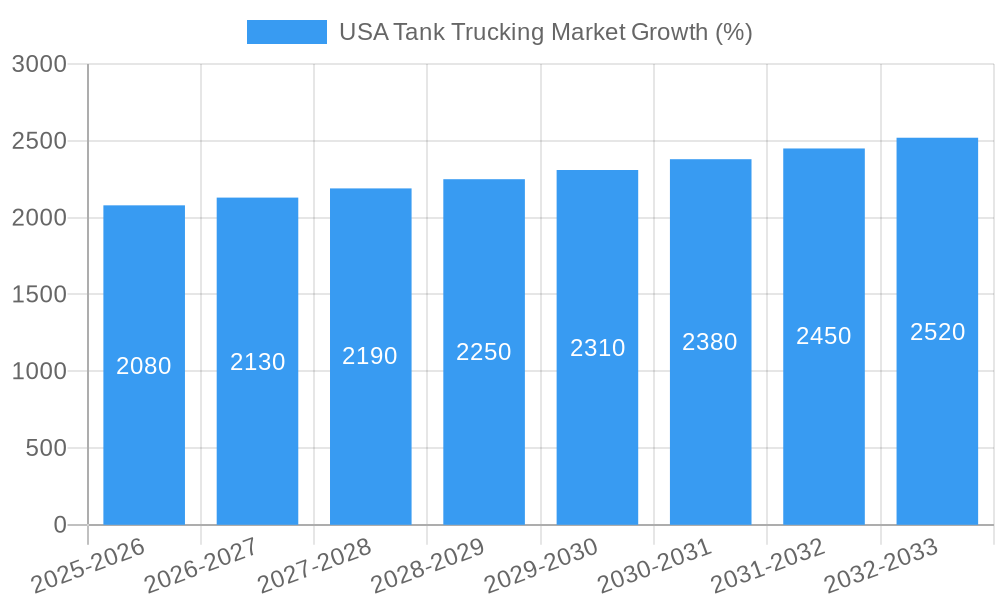
The forecast period (2025-2033) anticipates a continued, albeit moderate, expansion of the US Tank Trucking Market. The growth will be influenced by the ongoing development of infrastructure, government regulations focusing on fuel efficiency and safety, and the overall economic climate. The market’s performance will also be shaped by the evolving transportation landscape, including the adoption of autonomous vehicles and advancements in logistics management. Successful companies will be those who can effectively navigate these evolving dynamics, including investing in driver retention strategies, embracing technological advancements, and adapting to fluctuating market demands. Despite potential challenges, the long-term outlook remains positive, driven by the fundamental need for efficient and reliable liquid bulk transportation within the US economy.
USA Tank Trucking Market: A Comprehensive Market Report (2019-2033)
This comprehensive report provides an in-depth analysis of the USA Tank Trucking Market, covering market dynamics, growth trends, dominant segments, key players, and future outlook. The study period spans from 2019 to 2033, with 2025 as the base year. This report is essential for industry professionals, investors, and anyone seeking a detailed understanding of this dynamic sector. The market is segmented by fleet type (for-hire, private), capacity (light, medium, heavy duty), and product category (crude petroleum, petroleum products, chemicals, food & beverages, fertilizers, others). We analyze the parent market of trucking and logistics and its child market of specialized tank trucking.
USA Tank Trucking Market Market Dynamics & Structure
The USA tank trucking market is characterized by a moderately concentrated structure, with several large players and numerous smaller regional operators. Market concentration is estimated at xx%, driven by the significant capital investment needed for fleet acquisition and maintenance. Technological innovation, primarily in telematics, fuel efficiency, and safety systems, is a key driver. Stringent regulatory frameworks concerning safety, emissions, and driver hours significantly impact operational costs and efficiency. Competitive product substitutes are limited, as tank trucking remains crucial for transporting many liquid and bulk goods. End-user demographics are diverse, encompassing various industries, from energy and chemicals to food and agriculture. M&A activity has been robust, signaling industry consolidation and expansion strategies. The total market value in 2025 is estimated at $XX Million.
- Market Concentration: xx% (estimated)
- Key Drivers: Technological advancements, increasing demand for bulk transportation.
- Regulatory Impact: Stringent safety and emission regulations.
- M&A Activity: Significant consolidation observed in recent years, with xx deals recorded in 2024 (estimated). Deals predominantly involve smaller firms being acquired by larger players for consolidation of infrastructure and supply-chain optimization.
- Innovation Barriers: High initial investment costs, regulatory compliance complexity.
USA Tank Trucking Market Growth Trends & Insights
The USA tank trucking market experienced steady growth during the historical period (2019-2024), with a CAGR of xx%. This growth is attributed to the increasing demand for bulk transportation across various industries, coupled with economic expansion. However, recent macroeconomic fluctuations and supply chain disruptions have influenced the growth rate, leading to market adjustments. Technological disruptions, like the adoption of autonomous vehicles and advanced telematics, are projected to transform the sector in the coming years, although adoption rates are currently at xx%. Consumer behavior shifts are gradually occurring, with increased emphasis on sustainability and environmentally friendly transportation solutions. The market is expected to grow at a CAGR of xx% during the forecast period (2025-2033), reaching an estimated value of $XX Million by 2033.
Dominant Regions, Countries, or Segments in USA Tank Trucking Market
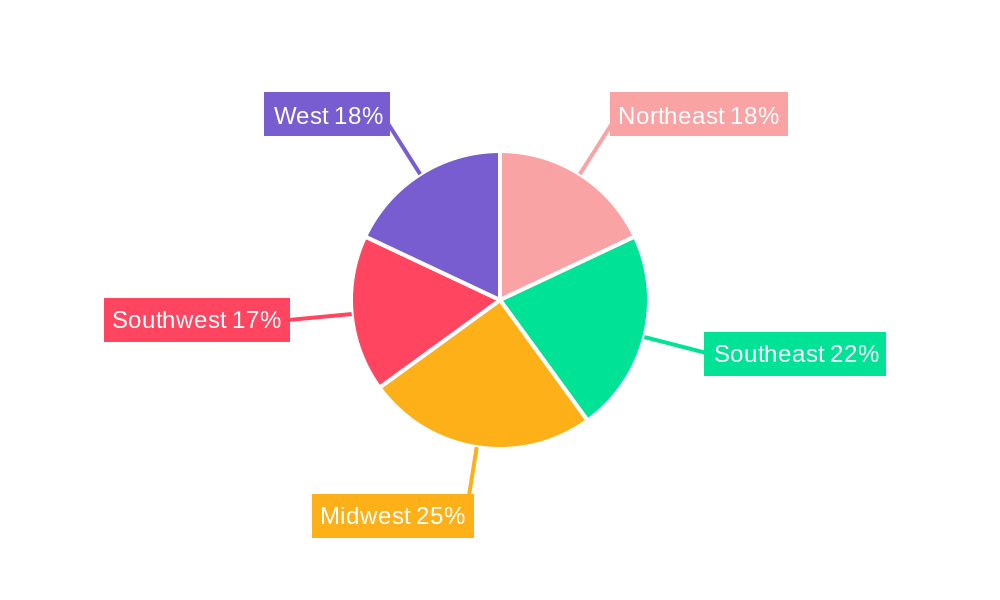
The South Central and Western regions of the US dominate the tank trucking market, driven by significant energy production and processing activities, as well as robust agricultural sectors. The "For-hire" fleet type segment holds the largest market share, reflecting the significant outsourcing of transportation services. Heavy-duty trucks comprise the majority of the fleet, owing to the need to transport large volumes of goods efficiently. Crude petroleum and petroleum product transportation are significant revenue generators.
- Leading Region: South Central & Western US
- Dominant Segment: For-hire fleet type, Heavy-duty capacity, Crude Petroleum & Petroleum Products
- Key Growth Drivers: Economic expansion in key regions, infrastructure development, increasing demand for chemical and food transportation.
- Market Share (2025 est.): For-hire (xx%), Heavy-Duty (xx%), Crude Petroleum & Petroleum Products (xx%)
USA Tank Trucking Market Product Landscape
The tank trucking market offers a range of specialized vehicles, including those designed for specific product categories, ensuring safe and efficient transportation. Technological advancements are leading to improved fuel efficiency, enhanced safety features (e.g., advanced driver-assistance systems), and real-time tracking capabilities. The unique selling propositions of various operators lie in their specialized expertise in handling particular products (e.g., hazardous materials) and their ability to offer efficient supply chain solutions. This market is characterized by constant developments in tanker design, ensuring compliance with safety standards and improving efficiency.
Key Drivers, Barriers & Challenges in USA Tank Trucking Market
Key Drivers:
- Increasing demand for bulk transportation across various industries.
- Infrastructure development and expansion.
- Technological advancements in fleet management and safety.
Challenges & Restraints:
- Driver shortages, impacting operational capacity. The shortage is estimated to cost the industry $XX Million annually (estimated).
- Fluctuating fuel prices affecting operational costs.
- Stringent environmental regulations and their compliance costs. Meeting new emission standards cost the industry xx million USD in 2024 (estimated).
Emerging Opportunities in USA Tank Trucking Market
- Growth of the e-commerce sector and the last-mile delivery challenges, leading to demand for specialized tank trucking services.
- Increased focus on sustainable transportation, driving demand for fuel-efficient and environmentally friendly vehicles.
- Expansion into niche markets with specialized handling needs (e.g., food-grade products, hazardous materials).
Growth Accelerators in the USA Tank Trucking Market Industry
Technological breakthroughs in autonomous driving and telematics promise to significantly enhance efficiency and reduce operational costs in the long term. Strategic partnerships with technology providers and logistics companies can enable access to advanced solutions. Expansion into new markets and diversification into related services will increase long-term profitability.
Key Players Shaping the USA Tank Trucking Market Market
- Trimac Transportation Inc
- Foodliner/Quest Liner Inc
- Tankstar USA
- Superior Bulk Logistics Inc
- Miller Transporters Inc
- Groendyke Transport Inc
- Martin Transport Inc
- Florida Rock & Tank Lines Inc
- Slay Transportation Co Inc
- Apex Logistics LLC
- Mission Petroleum Carriers
- Genox Transportation Inc
- J&M Tank Lines Inc
- CLI Transport LP
- Tidewater Transit Co Inc
- Herman R Ewell Inc
- Service Transport Company
- Schilli Bulk Carriers Group
- Andrews Logistics and CTL Transportation LLC
- Eagle Transport Corp
- Ruan Transportation Management Systems
- Kenan Advantage Group
- Dupre Logistics LLC
Notable Milestones in USA Tank Trucking Market Sector
- April 2023: Trimac Transportation acquired American Industrial Partners (AIP) Logistics, expanding its bulk terminal services and warehousing capabilities.
- February 2024: Kenan Advantage Group acquired Northern Dry Bulk, strengthening its position in plastic resin transportation and storage.
In-Depth USA Tank Trucking Market Market Outlook
The future of the USA tank trucking market looks promising, driven by continuous technological advancements, increasing demand for efficient logistics, and ongoing industry consolidation. Strategic investments in sustainable technologies and the development of robust supply chain solutions will be crucial for long-term success. The market's ability to adapt to evolving regulatory landscapes and address persistent challenges like driver shortages will be key factors influencing its trajectory. The predicted market value in 2033 suggests significant potential for growth and investment.
USA Tank Trucking Market Segmentation
-
1. Fleet Type
- 1.1. For-hire
- 1.2. Private
-
2. Capacity
- 2.1. Light Duty
- 2.2. Medium Duty
- 2.3. Heavy Duty
-
3. Product Category
- 3.1. Crude Petroleum
- 3.2. Petroleu
- 3.3. Chemicals
- 3.4. Food and Beverages
- 3.5. Fertilizers
- 3.6. Other Product Categories
USA Tank Trucking Market Segmentation By Geography
-
1. North America
- 1.1. United States
- 1.2. Canada
- 1.3. Mexico
-
2. South America
- 2.1. Brazil
- 2.2. Argentina
- 2.3. Rest of South America
-
3. Europe
- 3.1. United Kingdom
- 3.2. Germany
- 3.3. France
- 3.4. Italy
- 3.5. Spain
- 3.6. Russia
- 3.7. Benelux
- 3.8. Nordics
- 3.9. Rest of Europe
-
4. Middle East & Africa
- 4.1. Turkey
- 4.2. Israel
- 4.3. GCC
- 4.4. North Africa
- 4.5. South Africa
- 4.6. Rest of Middle East & Africa
-
5. Asia Pacific
- 5.1. China
- 5.2. India
- 5.3. Japan
- 5.4. South Korea
- 5.5. ASEAN
- 5.6. Oceania
- 5.7. Rest of Asia Pacific
USA Tank Trucking Market REPORT HIGHLIGHTS
| Aspects | Details |
|---|---|
| Study Period | 2019-2033 |
| Base Year | 2024 |
| Estimated Year | 2025 |
| Forecast Period | 2025-2033 |
| Historical Period | 2019-2024 |
| Growth Rate | CAGR of 3.42% from 2019-2033 |
| Segmentation |
|
Table of Contents
- 1. Introduction
- 1.1. Research Scope
- 1.2. Market Segmentation
- 1.3. Research Methodology
- 1.4. Definitions and Assumptions
- 2. Executive Summary
- 2.1. Introduction
- 3. Market Dynamics
- 3.1. Introduction
- 3.2. Market Drivers
- 3.2.1. Rise in Demand for Oil and Natural Gas; Technological Advancements
- 3.3. Market Restrains
- 3.3.1. Increasing Regulatory Burden and Compliance Costs; Volatility of Fuel Prices
- 3.4. Market Trends
- 3.4.1. Fuel Tank Trailers as Petroleum Carriers are Boosting the Market's Growth in the United States
- 4. Market Factor Analysis
- 4.1. Porters Five Forces
- 4.2. Supply/Value Chain
- 4.3. PESTEL analysis
- 4.4. Market Entropy
- 4.5. Patent/Trademark Analysis
- 5. Global USA Tank Trucking Market Analysis, Insights and Forecast, 2019-2031
- 5.1. Market Analysis, Insights and Forecast - by Fleet Type
- 5.1.1. For-hire
- 5.1.2. Private
- 5.2. Market Analysis, Insights and Forecast - by Capacity
- 5.2.1. Light Duty
- 5.2.2. Medium Duty
- 5.2.3. Heavy Duty
- 5.3. Market Analysis, Insights and Forecast - by Product Category
- 5.3.1. Crude Petroleum
- 5.3.2. Petroleu
- 5.3.3. Chemicals
- 5.3.4. Food and Beverages
- 5.3.5. Fertilizers
- 5.3.6. Other Product Categories
- 5.4. Market Analysis, Insights and Forecast - by Region
- 5.4.1. North America
- 5.4.2. South America
- 5.4.3. Europe
- 5.4.4. Middle East & Africa
- 5.4.5. Asia Pacific
- 5.1. Market Analysis, Insights and Forecast - by Fleet Type
- 6. North America USA Tank Trucking Market Analysis, Insights and Forecast, 2019-2031
- 6.1. Market Analysis, Insights and Forecast - by Fleet Type
- 6.1.1. For-hire
- 6.1.2. Private
- 6.2. Market Analysis, Insights and Forecast - by Capacity
- 6.2.1. Light Duty
- 6.2.2. Medium Duty
- 6.2.3. Heavy Duty
- 6.3. Market Analysis, Insights and Forecast - by Product Category
- 6.3.1. Crude Petroleum
- 6.3.2. Petroleu
- 6.3.3. Chemicals
- 6.3.4. Food and Beverages
- 6.3.5. Fertilizers
- 6.3.6. Other Product Categories
- 6.1. Market Analysis, Insights and Forecast - by Fleet Type
- 7. South America USA Tank Trucking Market Analysis, Insights and Forecast, 2019-2031
- 7.1. Market Analysis, Insights and Forecast - by Fleet Type
- 7.1.1. For-hire
- 7.1.2. Private
- 7.2. Market Analysis, Insights and Forecast - by Capacity
- 7.2.1. Light Duty
- 7.2.2. Medium Duty
- 7.2.3. Heavy Duty
- 7.3. Market Analysis, Insights and Forecast - by Product Category
- 7.3.1. Crude Petroleum
- 7.3.2. Petroleu
- 7.3.3. Chemicals
- 7.3.4. Food and Beverages
- 7.3.5. Fertilizers
- 7.3.6. Other Product Categories
- 7.1. Market Analysis, Insights and Forecast - by Fleet Type
- 8. Europe USA Tank Trucking Market Analysis, Insights and Forecast, 2019-2031
- 8.1. Market Analysis, Insights and Forecast - by Fleet Type
- 8.1.1. For-hire
- 8.1.2. Private
- 8.2. Market Analysis, Insights and Forecast - by Capacity
- 8.2.1. Light Duty
- 8.2.2. Medium Duty
- 8.2.3. Heavy Duty
- 8.3. Market Analysis, Insights and Forecast - by Product Category
- 8.3.1. Crude Petroleum
- 8.3.2. Petroleu
- 8.3.3. Chemicals
- 8.3.4. Food and Beverages
- 8.3.5. Fertilizers
- 8.3.6. Other Product Categories
- 8.1. Market Analysis, Insights and Forecast - by Fleet Type
- 9. Middle East & Africa USA Tank Trucking Market Analysis, Insights and Forecast, 2019-2031
- 9.1. Market Analysis, Insights and Forecast - by Fleet Type
- 9.1.1. For-hire
- 9.1.2. Private
- 9.2. Market Analysis, Insights and Forecast - by Capacity
- 9.2.1. Light Duty
- 9.2.2. Medium Duty
- 9.2.3. Heavy Duty
- 9.3. Market Analysis, Insights and Forecast - by Product Category
- 9.3.1. Crude Petroleum
- 9.3.2. Petroleu
- 9.3.3. Chemicals
- 9.3.4. Food and Beverages
- 9.3.5. Fertilizers
- 9.3.6. Other Product Categories
- 9.1. Market Analysis, Insights and Forecast - by Fleet Type
- 10. Asia Pacific USA Tank Trucking Market Analysis, Insights and Forecast, 2019-2031
- 10.1. Market Analysis, Insights and Forecast - by Fleet Type
- 10.1.1. For-hire
- 10.1.2. Private
- 10.2. Market Analysis, Insights and Forecast - by Capacity
- 10.2.1. Light Duty
- 10.2.2. Medium Duty
- 10.2.3. Heavy Duty
- 10.3. Market Analysis, Insights and Forecast - by Product Category
- 10.3.1. Crude Petroleum
- 10.3.2. Petroleu
- 10.3.3. Chemicals
- 10.3.4. Food and Beverages
- 10.3.5. Fertilizers
- 10.3.6. Other Product Categories
- 10.1. Market Analysis, Insights and Forecast - by Fleet Type
- 11. Northeast USA Tank Trucking Market Analysis, Insights and Forecast, 2019-2031
- 12. Southeast USA Tank Trucking Market Analysis, Insights and Forecast, 2019-2031
- 13. Midwest USA Tank Trucking Market Analysis, Insights and Forecast, 2019-2031
- 14. Southwest USA Tank Trucking Market Analysis, Insights and Forecast, 2019-2031
- 15. West USA Tank Trucking Market Analysis, Insights and Forecast, 2019-2031
- 16. Competitive Analysis
- 16.1. Global Market Share Analysis 2024
- 16.2. Company Profiles
- 16.2.1 Trimac Transportation Inc
- 16.2.1.1. Overview
- 16.2.1.2. Products
- 16.2.1.3. SWOT Analysis
- 16.2.1.4. Recent Developments
- 16.2.1.5. Financials (Based on Availability)
- 16.2.2 Foodliner/Quest Liner Inc
- 16.2.2.1. Overview
- 16.2.2.2. Products
- 16.2.2.3. SWOT Analysis
- 16.2.2.4. Recent Developments
- 16.2.2.5. Financials (Based on Availability)
- 16.2.3 Tankstar USA
- 16.2.3.1. Overview
- 16.2.3.2. Products
- 16.2.3.3. SWOT Analysis
- 16.2.3.4. Recent Developments
- 16.2.3.5. Financials (Based on Availability)
- 16.2.4 Superior Bulk Logistics Inc
- 16.2.4.1. Overview
- 16.2.4.2. Products
- 16.2.4.3. SWOT Analysis
- 16.2.4.4. Recent Developments
- 16.2.4.5. Financials (Based on Availability)
- 16.2.5 Miller Transporters Inc
- 16.2.5.1. Overview
- 16.2.5.2. Products
- 16.2.5.3. SWOT Analysis
- 16.2.5.4. Recent Developments
- 16.2.5.5. Financials (Based on Availability)
- 16.2.6 Groendyke Transport Inc
- 16.2.6.1. Overview
- 16.2.6.2. Products
- 16.2.6.3. SWOT Analysis
- 16.2.6.4. Recent Developments
- 16.2.6.5. Financials (Based on Availability)
- 16.2.7 Martin Transport Inc
- 16.2.7.1. Overview
- 16.2.7.2. Products
- 16.2.7.3. SWOT Analysis
- 16.2.7.4. Recent Developments
- 16.2.7.5. Financials (Based on Availability)
- 16.2.8 Florida Rock & Tank Lines Inc **List Not Exhaustive 7 3 Other Companies (Slay Transportation Co Inc Apex Logistics LLC Mission Petroleum Carriers Genox Transportation Inc J&M Tank Lines Inc CLI Transport LP Tidewater Transit Co Inc Herman R Ewell Inc Service Transport Company Schilli Bulk Carriers Group Andrews Logistics and CTL Transportation LLC
- 16.2.8.1. Overview
- 16.2.8.2. Products
- 16.2.8.3. SWOT Analysis
- 16.2.8.4. Recent Developments
- 16.2.8.5. Financials (Based on Availability)
- 16.2.9 Eagle Transport Corp
- 16.2.9.1. Overview
- 16.2.9.2. Products
- 16.2.9.3. SWOT Analysis
- 16.2.9.4. Recent Developments
- 16.2.9.5. Financials (Based on Availability)
- 16.2.10 Ruan Transportation Management Systems
- 16.2.10.1. Overview
- 16.2.10.2. Products
- 16.2.10.3. SWOT Analysis
- 16.2.10.4. Recent Developments
- 16.2.10.5. Financials (Based on Availability)
- 16.2.11 Kenan Advantage Group
- 16.2.11.1. Overview
- 16.2.11.2. Products
- 16.2.11.3. SWOT Analysis
- 16.2.11.4. Recent Developments
- 16.2.11.5. Financials (Based on Availability)
- 16.2.12 Dupre Logistics LLC
- 16.2.12.1. Overview
- 16.2.12.2. Products
- 16.2.12.3. SWOT Analysis
- 16.2.12.4. Recent Developments
- 16.2.12.5. Financials (Based on Availability)
- 16.2.1 Trimac Transportation Inc
List of Figures
- Figure 1: Global USA Tank Trucking Market Revenue Breakdown (Million, %) by Region 2024 & 2032
- Figure 2: United states USA Tank Trucking Market Revenue (Million), by Country 2024 & 2032
- Figure 3: United states USA Tank Trucking Market Revenue Share (%), by Country 2024 & 2032
- Figure 4: North America USA Tank Trucking Market Revenue (Million), by Fleet Type 2024 & 2032
- Figure 5: North America USA Tank Trucking Market Revenue Share (%), by Fleet Type 2024 & 2032
- Figure 6: North America USA Tank Trucking Market Revenue (Million), by Capacity 2024 & 2032
- Figure 7: North America USA Tank Trucking Market Revenue Share (%), by Capacity 2024 & 2032
- Figure 8: North America USA Tank Trucking Market Revenue (Million), by Product Category 2024 & 2032
- Figure 9: North America USA Tank Trucking Market Revenue Share (%), by Product Category 2024 & 2032
- Figure 10: North America USA Tank Trucking Market Revenue (Million), by Country 2024 & 2032
- Figure 11: North America USA Tank Trucking Market Revenue Share (%), by Country 2024 & 2032
- Figure 12: South America USA Tank Trucking Market Revenue (Million), by Fleet Type 2024 & 2032
- Figure 13: South America USA Tank Trucking Market Revenue Share (%), by Fleet Type 2024 & 2032
- Figure 14: South America USA Tank Trucking Market Revenue (Million), by Capacity 2024 & 2032
- Figure 15: South America USA Tank Trucking Market Revenue Share (%), by Capacity 2024 & 2032
- Figure 16: South America USA Tank Trucking Market Revenue (Million), by Product Category 2024 & 2032
- Figure 17: South America USA Tank Trucking Market Revenue Share (%), by Product Category 2024 & 2032
- Figure 18: South America USA Tank Trucking Market Revenue (Million), by Country 2024 & 2032
- Figure 19: South America USA Tank Trucking Market Revenue Share (%), by Country 2024 & 2032
- Figure 20: Europe USA Tank Trucking Market Revenue (Million), by Fleet Type 2024 & 2032
- Figure 21: Europe USA Tank Trucking Market Revenue Share (%), by Fleet Type 2024 & 2032
- Figure 22: Europe USA Tank Trucking Market Revenue (Million), by Capacity 2024 & 2032
- Figure 23: Europe USA Tank Trucking Market Revenue Share (%), by Capacity 2024 & 2032
- Figure 24: Europe USA Tank Trucking Market Revenue (Million), by Product Category 2024 & 2032
- Figure 25: Europe USA Tank Trucking Market Revenue Share (%), by Product Category 2024 & 2032
- Figure 26: Europe USA Tank Trucking Market Revenue (Million), by Country 2024 & 2032
- Figure 27: Europe USA Tank Trucking Market Revenue Share (%), by Country 2024 & 2032
- Figure 28: Middle East & Africa USA Tank Trucking Market Revenue (Million), by Fleet Type 2024 & 2032
- Figure 29: Middle East & Africa USA Tank Trucking Market Revenue Share (%), by Fleet Type 2024 & 2032
- Figure 30: Middle East & Africa USA Tank Trucking Market Revenue (Million), by Capacity 2024 & 2032
- Figure 31: Middle East & Africa USA Tank Trucking Market Revenue Share (%), by Capacity 2024 & 2032
- Figure 32: Middle East & Africa USA Tank Trucking Market Revenue (Million), by Product Category 2024 & 2032
- Figure 33: Middle East & Africa USA Tank Trucking Market Revenue Share (%), by Product Category 2024 & 2032
- Figure 34: Middle East & Africa USA Tank Trucking Market Revenue (Million), by Country 2024 & 2032
- Figure 35: Middle East & Africa USA Tank Trucking Market Revenue Share (%), by Country 2024 & 2032
- Figure 36: Asia Pacific USA Tank Trucking Market Revenue (Million), by Fleet Type 2024 & 2032
- Figure 37: Asia Pacific USA Tank Trucking Market Revenue Share (%), by Fleet Type 2024 & 2032
- Figure 38: Asia Pacific USA Tank Trucking Market Revenue (Million), by Capacity 2024 & 2032
- Figure 39: Asia Pacific USA Tank Trucking Market Revenue Share (%), by Capacity 2024 & 2032
- Figure 40: Asia Pacific USA Tank Trucking Market Revenue (Million), by Product Category 2024 & 2032
- Figure 41: Asia Pacific USA Tank Trucking Market Revenue Share (%), by Product Category 2024 & 2032
- Figure 42: Asia Pacific USA Tank Trucking Market Revenue (Million), by Country 2024 & 2032
- Figure 43: Asia Pacific USA Tank Trucking Market Revenue Share (%), by Country 2024 & 2032
List of Tables
- Table 1: Global USA Tank Trucking Market Revenue Million Forecast, by Region 2019 & 2032
- Table 2: Global USA Tank Trucking Market Revenue Million Forecast, by Fleet Type 2019 & 2032
- Table 3: Global USA Tank Trucking Market Revenue Million Forecast, by Capacity 2019 & 2032
- Table 4: Global USA Tank Trucking Market Revenue Million Forecast, by Product Category 2019 & 2032
- Table 5: Global USA Tank Trucking Market Revenue Million Forecast, by Region 2019 & 2032
- Table 6: Global USA Tank Trucking Market Revenue Million Forecast, by Country 2019 & 2032
- Table 7: Northeast USA Tank Trucking Market Revenue (Million) Forecast, by Application 2019 & 2032
- Table 8: Southeast USA Tank Trucking Market Revenue (Million) Forecast, by Application 2019 & 2032
- Table 9: Midwest USA Tank Trucking Market Revenue (Million) Forecast, by Application 2019 & 2032
- Table 10: Southwest USA Tank Trucking Market Revenue (Million) Forecast, by Application 2019 & 2032
- Table 11: West USA Tank Trucking Market Revenue (Million) Forecast, by Application 2019 & 2032
- Table 12: Global USA Tank Trucking Market Revenue Million Forecast, by Fleet Type 2019 & 2032
- Table 13: Global USA Tank Trucking Market Revenue Million Forecast, by Capacity 2019 & 2032
- Table 14: Global USA Tank Trucking Market Revenue Million Forecast, by Product Category 2019 & 2032
- Table 15: Global USA Tank Trucking Market Revenue Million Forecast, by Country 2019 & 2032
- Table 16: United States USA Tank Trucking Market Revenue (Million) Forecast, by Application 2019 & 2032
- Table 17: Canada USA Tank Trucking Market Revenue (Million) Forecast, by Application 2019 & 2032
- Table 18: Mexico USA Tank Trucking Market Revenue (Million) Forecast, by Application 2019 & 2032
- Table 19: Global USA Tank Trucking Market Revenue Million Forecast, by Fleet Type 2019 & 2032
- Table 20: Global USA Tank Trucking Market Revenue Million Forecast, by Capacity 2019 & 2032
- Table 21: Global USA Tank Trucking Market Revenue Million Forecast, by Product Category 2019 & 2032
- Table 22: Global USA Tank Trucking Market Revenue Million Forecast, by Country 2019 & 2032
- Table 23: Brazil USA Tank Trucking Market Revenue (Million) Forecast, by Application 2019 & 2032
- Table 24: Argentina USA Tank Trucking Market Revenue (Million) Forecast, by Application 2019 & 2032
- Table 25: Rest of South America USA Tank Trucking Market Revenue (Million) Forecast, by Application 2019 & 2032
- Table 26: Global USA Tank Trucking Market Revenue Million Forecast, by Fleet Type 2019 & 2032
- Table 27: Global USA Tank Trucking Market Revenue Million Forecast, by Capacity 2019 & 2032
- Table 28: Global USA Tank Trucking Market Revenue Million Forecast, by Product Category 2019 & 2032
- Table 29: Global USA Tank Trucking Market Revenue Million Forecast, by Country 2019 & 2032
- Table 30: United Kingdom USA Tank Trucking Market Revenue (Million) Forecast, by Application 2019 & 2032
- Table 31: Germany USA Tank Trucking Market Revenue (Million) Forecast, by Application 2019 & 2032
- Table 32: France USA Tank Trucking Market Revenue (Million) Forecast, by Application 2019 & 2032
- Table 33: Italy USA Tank Trucking Market Revenue (Million) Forecast, by Application 2019 & 2032
- Table 34: Spain USA Tank Trucking Market Revenue (Million) Forecast, by Application 2019 & 2032
- Table 35: Russia USA Tank Trucking Market Revenue (Million) Forecast, by Application 2019 & 2032
- Table 36: Benelux USA Tank Trucking Market Revenue (Million) Forecast, by Application 2019 & 2032
- Table 37: Nordics USA Tank Trucking Market Revenue (Million) Forecast, by Application 2019 & 2032
- Table 38: Rest of Europe USA Tank Trucking Market Revenue (Million) Forecast, by Application 2019 & 2032
- Table 39: Global USA Tank Trucking Market Revenue Million Forecast, by Fleet Type 2019 & 2032
- Table 40: Global USA Tank Trucking Market Revenue Million Forecast, by Capacity 2019 & 2032
- Table 41: Global USA Tank Trucking Market Revenue Million Forecast, by Product Category 2019 & 2032
- Table 42: Global USA Tank Trucking Market Revenue Million Forecast, by Country 2019 & 2032
- Table 43: Turkey USA Tank Trucking Market Revenue (Million) Forecast, by Application 2019 & 2032
- Table 44: Israel USA Tank Trucking Market Revenue (Million) Forecast, by Application 2019 & 2032
- Table 45: GCC USA Tank Trucking Market Revenue (Million) Forecast, by Application 2019 & 2032
- Table 46: North Africa USA Tank Trucking Market Revenue (Million) Forecast, by Application 2019 & 2032
- Table 47: South Africa USA Tank Trucking Market Revenue (Million) Forecast, by Application 2019 & 2032
- Table 48: Rest of Middle East & Africa USA Tank Trucking Market Revenue (Million) Forecast, by Application 2019 & 2032
- Table 49: Global USA Tank Trucking Market Revenue Million Forecast, by Fleet Type 2019 & 2032
- Table 50: Global USA Tank Trucking Market Revenue Million Forecast, by Capacity 2019 & 2032
- Table 51: Global USA Tank Trucking Market Revenue Million Forecast, by Product Category 2019 & 2032
- Table 52: Global USA Tank Trucking Market Revenue Million Forecast, by Country 2019 & 2032
- Table 53: China USA Tank Trucking Market Revenue (Million) Forecast, by Application 2019 & 2032
- Table 54: India USA Tank Trucking Market Revenue (Million) Forecast, by Application 2019 & 2032
- Table 55: Japan USA Tank Trucking Market Revenue (Million) Forecast, by Application 2019 & 2032
- Table 56: South Korea USA Tank Trucking Market Revenue (Million) Forecast, by Application 2019 & 2032
- Table 57: ASEAN USA Tank Trucking Market Revenue (Million) Forecast, by Application 2019 & 2032
- Table 58: Oceania USA Tank Trucking Market Revenue (Million) Forecast, by Application 2019 & 2032
- Table 59: Rest of Asia Pacific USA Tank Trucking Market Revenue (Million) Forecast, by Application 2019 & 2032
Frequently Asked Questions
1. What is the projected Compound Annual Growth Rate (CAGR) of the USA Tank Trucking Market?
The projected CAGR is approximately 3.42%.
2. Which companies are prominent players in the USA Tank Trucking Market?
Key companies in the market include Trimac Transportation Inc, Foodliner/Quest Liner Inc, Tankstar USA, Superior Bulk Logistics Inc, Miller Transporters Inc, Groendyke Transport Inc, Martin Transport Inc, Florida Rock & Tank Lines Inc **List Not Exhaustive 7 3 Other Companies (Slay Transportation Co Inc Apex Logistics LLC Mission Petroleum Carriers Genox Transportation Inc J&M Tank Lines Inc CLI Transport LP Tidewater Transit Co Inc Herman R Ewell Inc Service Transport Company Schilli Bulk Carriers Group Andrews Logistics and CTL Transportation LLC, Eagle Transport Corp, Ruan Transportation Management Systems, Kenan Advantage Group, Dupre Logistics LLC.
3. What are the main segments of the USA Tank Trucking Market?
The market segments include Fleet Type, Capacity, Product Category.
4. Can you provide details about the market size?
The market size is estimated to be USD 59.69 Million as of 2022.
5. What are some drivers contributing to market growth?
Rise in Demand for Oil and Natural Gas; Technological Advancements.
6. What are the notable trends driving market growth?
Fuel Tank Trailers as Petroleum Carriers are Boosting the Market's Growth in the United States.
7. Are there any restraints impacting market growth?
Increasing Regulatory Burden and Compliance Costs; Volatility of Fuel Prices.
8. Can you provide examples of recent developments in the market?
February 2024: Kenan Advantage Group, the largest tank truck transporter and logistics provider in North America, acquired Northern Dry Bulk, a company specializing in the transportation and storage of plastic resins for clients in the automotive, packaging, and electronics sectors across the United States and Canada. This acquisition brought 36 tractors, 91 trailers, and two terminals with two maintenance bays, along with warehouse space and trans-loading capabilities, into the KAG portfolio.
9. What pricing options are available for accessing the report?
Pricing options include single-user, multi-user, and enterprise licenses priced at USD 3800, USD 4500, and USD 5800 respectively.
10. Is the market size provided in terms of value or volume?
The market size is provided in terms of value, measured in Million.
11. Are there any specific market keywords associated with the report?
Yes, the market keyword associated with the report is "USA Tank Trucking Market," which aids in identifying and referencing the specific market segment covered.
12. How do I determine which pricing option suits my needs best?
The pricing options vary based on user requirements and access needs. Individual users may opt for single-user licenses, while businesses requiring broader access may choose multi-user or enterprise licenses for cost-effective access to the report.
13. Are there any additional resources or data provided in the USA Tank Trucking Market report?
While the report offers comprehensive insights, it's advisable to review the specific contents or supplementary materials provided to ascertain if additional resources or data are available.
14. How can I stay updated on further developments or reports in the USA Tank Trucking Market?
To stay informed about further developments, trends, and reports in the USA Tank Trucking Market, consider subscribing to industry newsletters, following relevant companies and organizations, or regularly checking reputable industry news sources and publications.
Methodology
Step 1 - Identification of Relevant Samples Size from Population Database


Step 2 - Approaches for Defining Global Market Size (Value, Volume* & Price*)

Note*: In applicable scenarios
Step 3 - Data Sources
Primary Research
- Web Analytics
- Survey Reports
- Research Institute
- Latest Research Reports
- Opinion Leaders
Secondary Research
- Annual Reports
- White Paper
- Latest Press Release
- Industry Association
- Paid Database
- Investor Presentations

Step 4 - Data Triangulation
Involves using different sources of information in order to increase the validity of a study
These sources are likely to be stakeholders in a program - participants, other researchers, program staff, other community members, and so on.
Then we put all data in single framework & apply various statistical tools to find out the dynamic on the market.
During the analysis stage, feedback from the stakeholder groups would be compared to determine areas of agreement as well as areas of divergence


