

Key Insights
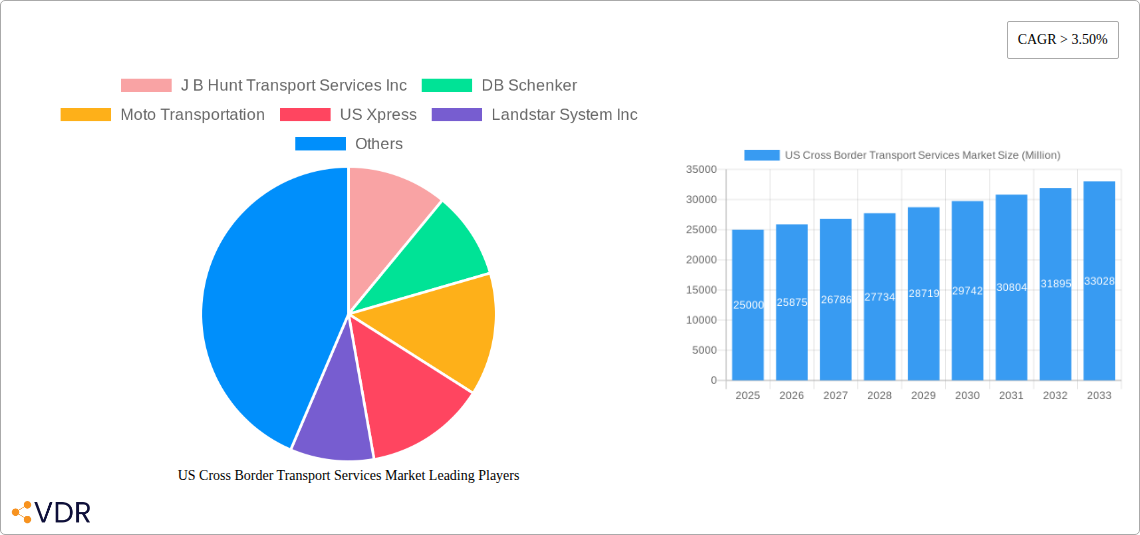
The US cross-border transport services market, including Full Truck Load (FTL), Less-than-Truckload (LTL), and Courier, Express, and Parcel (CEP) services, is driven by escalating international trade and e-commerce volumes. The market is projected to grow at a Compound Annual Growth Rate (CAGR) of 6% from a market size of $282.7 billion in the base year 2025, through 2033. Key growth catalysts include the expansion of manufacturing and automotive sectors, particularly along the US-Mexico border, and the sustained surge in e-commerce, necessitating efficient cross-border logistics. Just-in-time manufacturing further amplifies demand for dependable and timely transport solutions. FTL services are anticipated to dominate market share due to their cost-efficiency for high-volume shipments, while LTL and CEP segments are experiencing robust growth fueled by increasing smaller, expedited cross-border consumer goods shipments. Geographic growth is expected to be strongest in regions like the Southwest and West, benefiting from proximity to Mexico and Pacific Rim trade routes. Leading market participants such as J.B. Hunt, DB Schenker, and UPS are enhancing operational efficiency and competitive positioning through technological advancements, including sophisticated tracking systems and optimized routing software.
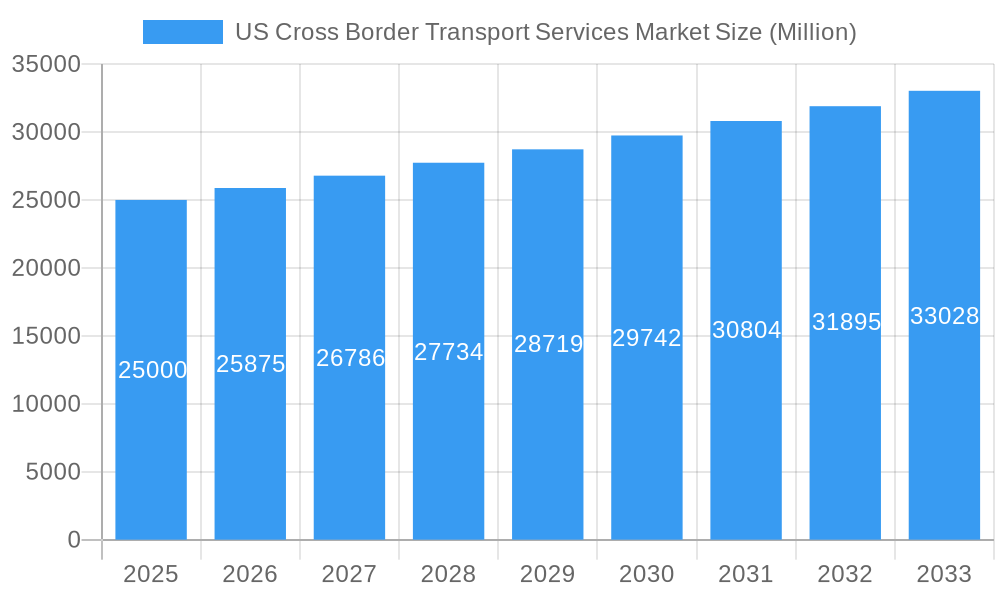
US Cross Border Transport Services Market Market Size (In Billion)
Despite positive growth trajectories, market expansion is subject to restraints such as fuel price volatility, geopolitical instability, and potential trade policy shifts, which can impact operational costs. Additionally, increasing regulatory complexities in cross-border transportation and a shortage of qualified drivers present ongoing challenges. Industry stakeholders are proactively mitigating these issues by investing in driver development programs and deploying advanced technologies for route optimization, efficiency improvements, and risk mitigation. The integration of sustainable transportation solutions, focusing on reduced carbon emissions and environmentally sound practices, is a significant emerging trend. The forecast period of 2025-2033 offers substantial opportunities for market growth and strategic investments, particularly in technology and infrastructure development.
US Cross Border Transport Services Market Company Market Share
US Cross Border Transport Services Market Analysis: Trends, Size, and Forecast (2025-2033)
This comprehensive report provides an in-depth analysis of the US Cross Border Transport Services Market, covering market dynamics, growth trends, dominant segments, key players, and future projections. The analysis encompasses historical data (2019-2024) and market forecasts for 2025-2033, with 2025 serving as the base year. The market is segmented by end-user (Manufacturing and Automotive, Oil and Gas, Mining and Quarrying, Agriculture, Fishing and Forestry, Construction, Distributive Trade (Wholesale and Retail – FMCG included), Other End Users (Telecommunications and Pharmaceuticals)) and by service type (Full Truck Load (FTL), Less-than-Truckload (LTL), Courier, Express, and Parcel (CEP)). Key market players examined include J B Hunt Transport Services Inc, DB Schenker, Moto Transportation, US Xpress, Landstar System Inc, C H Robinson, United Parcel Service (UPS), YRC Worldwide Inc, Schneider National, FedEx, Polaris Transportation Group, Hitachi Transport System, Swift Transportation Company, and XPO Logistics Inc. The market size is expected to reach $282.7 billion by 2025.
US Cross Border Transport Services Market Market Dynamics & Structure
The US cross-border transport services market is characterized by a moderately consolidated structure, with several large players commanding significant market share. However, the presence of numerous smaller, specialized carriers creates a competitive landscape. Technological innovation, particularly in areas like telematics, route optimization software, and autonomous vehicles, is a key driver of market growth. Stringent regulatory frameworks, including those related to safety, security, and environmental compliance, significantly impact operational costs and strategies. The market faces competition from alternative transportation modes, such as rail and air freight, depending on the nature of the goods and distances involved. End-user demographics play a crucial role, with manufacturing and automotive, as well as distributive trade (including FMCG), representing major market segments. Mergers and acquisitions (M&A) are frequent, reflecting industry consolidation and efforts to expand service offerings and geographic reach.
- Market Concentration: Moderately consolidated, with a few dominant players and many smaller niche players. The top 5 players hold approximately xx% of the market share (2024 estimate).
- Technological Innovation: Telematics, route optimization software, and the exploration of autonomous vehicles are significant drivers of efficiency gains and cost reduction. Barriers to innovation include high initial investment costs for new technologies and integration challenges across legacy systems.
- Regulatory Frameworks: Strict regulations regarding safety, security, and environmental compliance increase operational costs and complexity. Compliance necessitates significant investment in training, technology, and reporting.
- Competitive Product Substitutes: Rail and air freight are primary alternatives, depending on the shipment's characteristics (size, urgency, and value).
- End-User Demographics: Manufacturing and automotive, along with distributive trade (FMCG included), are major end-user segments, representing xx% of the market in 2024.
- M&A Trends: Significant M&A activity, driven by the pursuit of scale, geographic expansion, and access to new technologies and customer bases. xx M&A deals were recorded between 2019 and 2024.
US Cross Border Transport Services Market Growth Trends & Insights
The US cross-border transport services market experienced robust growth during the historical period (2019-2024), driven by factors such as increased cross-border trade, expanding e-commerce, and the growth of global supply chains. The market is expected to continue its expansion throughout the forecast period (2025-2033), albeit at a moderated pace compared to the earlier years. Technological disruptions, such as the implementation of advanced logistics software and the potential integration of autonomous vehicles, will play a major role in shaping market dynamics. Changing consumer preferences, particularly a shift towards faster delivery times and increased transparency in the supply chain, are also influencing the market. The market is projected to achieve a Compound Annual Growth Rate (CAGR) of xx% during the forecast period, reaching an estimated xx million by 2033. Market penetration of advanced technologies is expected to increase from xx% in 2024 to xx% by 2033.
Dominant Regions, Countries, or Segments in US Cross Border Transport Services Market
The dominant segments within the US cross-border transport services market vary by service type and end-user. The Manufacturing and Automotive sector is the largest end-user segment, contributing xx% of the total market value in 2024 due to the high volume of parts and finished goods transported across borders. Within services, Full Truck Load (FTL) maintains the largest market share due to its suitability for large-volume shipments. The Northeast and West Coast regions are significant due to their proximity to major ports and border crossings, facilitating high volumes of cross-border trade. However, growth is expected in the Southern and Central regions, driven by increased manufacturing and distribution activity.
Key Drivers by Segment:
- Manufacturing & Automotive: High volume of cross-border trade in parts and finished goods.
- Distributive Trade (FMCG): Rising consumer demand and the need for efficient distribution networks.
- FTL: Cost-effectiveness for large-volume shipments.
- Northeast & West Coast Regions: Proximity to major ports and border crossings.
Dominance Factors:
- High Trade Volumes: Concentrated economic activity and infrastructure in specific regions.
- Proximity to Borders: Easy access and reduced transit times.
- Established Logistics Networks: Presence of well-established carriers and supporting infrastructure.
- Government Policies: Favorable trade agreements and infrastructure investment.
US Cross Border Transport Services Market Product Landscape
Product innovations in the US cross-border transport services market are primarily focused on enhancing efficiency, transparency, and security. These include advanced telematics systems for real-time tracking and monitoring, route optimization software to reduce fuel consumption and transit times, and improved security measures to protect against theft and damage. The unique selling propositions of many providers revolve around specialized services such as temperature-controlled transportation for pharmaceuticals and oversized load handling for industrial equipment. Technological advancements are enabling greater automation in various aspects of logistics, including documentation, customs clearance, and even autonomous driving in specific applications.
Key Drivers, Barriers & Challenges in US Cross Border Transport Services Market
Key Drivers: Increased cross-border trade, expanding e-commerce, growing global supply chains, technological advancements (e.g., telematics, route optimization), and government initiatives to improve infrastructure.
Key Challenges: Supply chain disruptions due to global events, regulatory complexities and compliance costs associated with cross-border transport, driver shortages, fuel price volatility, and intense competition from established and emerging players. These challenges can lead to increased transportation costs and delivery delays. For example, driver shortages in 2024 resulted in a xx% increase in transportation costs for some companies.
Emerging Opportunities in US Cross Border Transport Services Market
Emerging opportunities lie in the expansion of e-commerce cross-border logistics, the growth of last-mile delivery solutions in cross-border contexts, the integration of blockchain technology for improved supply chain transparency and security, and the development of specialized services for niche markets (e.g., temperature-sensitive goods, hazardous materials). Untapped markets include smaller cross-border trade corridors and the development of sustainable transportation solutions, such as electric and hybrid vehicles.
Growth Accelerators in the US Cross Border Transport Services Market Industry
Long-term growth in the US cross-border transport services market will be fueled by continued advancements in automation and technology, strategic partnerships between carriers and technology providers to optimize logistics, the expansion of cross-border e-commerce, and government investments in infrastructure development that improves border crossing efficiency. The development of innovative solutions addressing challenges like driver shortages and sustainability concerns will also be crucial for sustained growth.
Key Players Shaping the US Cross Border Transport Services Market Market
- J B Hunt Transport Services Inc
- DB Schenker
- Moto Transportation
- US Xpress
- Landstar System Inc
- C H Robinson
- United Parcel Service (UPS)
- YRC Worldwide Inc
- Schneider National
- FedEx
- Polaris Transportation Group
- Hitachi Transport System
- Swift Transportation Company
- XPO Logistics Inc
Notable Milestones in US Cross Border Transport Services Market Sector
- October 2022: KAG Logistics acquired Connectrans Logistics, expanding its Canadian presence and providing Connectrans customers greater access to the US market.
- September 2022: DB Schenker acquired USA Truck for USD 435 million, significantly increasing its capacity and expanding its network across the eastern US.
In-Depth US Cross Border Transport Services Market Market Outlook
The future of the US cross-border transport services market appears bright, driven by several factors. Continued growth in e-commerce and global trade, along with ongoing technological advancements and strategic partnerships, will fuel market expansion. Opportunities exist for companies that can successfully address challenges like driver shortages, enhance supply chain resilience, and embrace sustainable practices. The market is poised for continued consolidation, with larger players acquiring smaller companies to gain scale and efficiency. Companies that successfully adapt to these changing dynamics and capitalize on emerging opportunities will experience significant growth in the coming years.
US Cross Border Transport Services Market Segmentation
-
1. Service
- 1.1. Full Truck Load (FTL)
- 1.2. Less-than Truckload (LTL)
- 1.3. Courier, Express, and Parcel (CEP)
-
2. End-user
- 2.1. Manufacturing and Automotive
- 2.2. Oil and Gas, Mining, and Quarrying
- 2.3. Agriculture, Fishing, and Forestry
- 2.4. Construction
- 2.5. Distribu
- 2.6. Other En
US Cross Border Transport Services Market Segmentation By Geography
-
1. North America
- 1.1. United States
- 1.2. Canada
- 1.3. Mexico
-
2. South America
- 2.1. Brazil
- 2.2. Argentina
- 2.3. Rest of South America
-
3. Europe
- 3.1. United Kingdom
- 3.2. Germany
- 3.3. France
- 3.4. Italy
- 3.5. Spain
- 3.6. Russia
- 3.7. Benelux
- 3.8. Nordics
- 3.9. Rest of Europe
-
4. Middle East & Africa
- 4.1. Turkey
- 4.2. Israel
- 4.3. GCC
- 4.4. North Africa
- 4.5. South Africa
- 4.6. Rest of Middle East & Africa
-
5. Asia Pacific
- 5.1. China
- 5.2. India
- 5.3. Japan
- 5.4. South Korea
- 5.5. ASEAN
- 5.6. Oceania
- 5.7. Rest of Asia Pacific
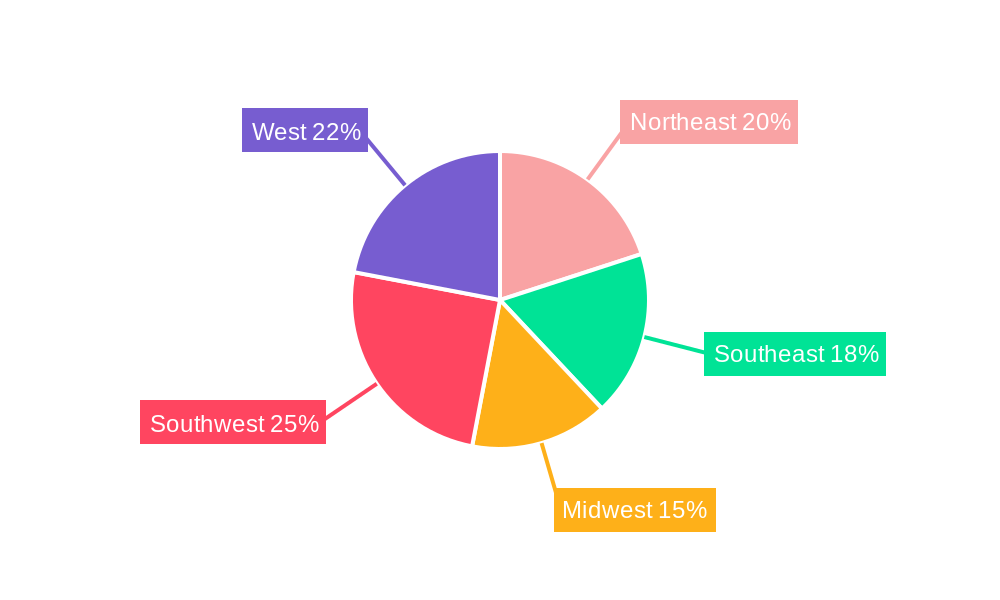
US Cross Border Transport Services Market Regional Market Share
Geographic Coverage of US Cross Border Transport Services Market
US Cross Border Transport Services Market REPORT HIGHLIGHTS
| Aspects | Details |
|---|---|
| Study Period | 2020-2034 |
| Base Year | 2025 |
| Estimated Year | 2026 |
| Forecast Period | 2026-2034 |
| Historical Period | 2020-2025 |
| Growth Rate | CAGR of 6% from 2020-2034 |
| Segmentation |
|
Table of Contents
- 1. Introduction
- 1.1. Research Scope
- 1.2. Market Segmentation
- 1.3. Research Objective
- 1.4. Definitions and Assumptions
- 2. Executive Summary
- 2.1. Market Snapshot
- 3. Market Dynamics
- 3.1. Market Drivers
- 3.2. Market Restrains
- 3.3. Market Trends
- 3.4. Market Opportunities
- 4. Market Factor Analysis
- 4.1. Porters Five Forces
- 4.1.1. Bargaining Power of Suppliers
- 4.1.2. Bargaining Power of Buyers
- 4.1.3. Threat of New Entrants
- 4.1.4. Threat of Substitutes
- 4.1.5. Competitive Rivalry
- 4.2. PESTEL analysis
- 4.3. BCG Analysis
- 4.3.1. Stars (High Growth, High Market Share)
- 4.3.2. Cash Cows (Low Growth, High Market Share)
- 4.3.3. Question Mark (High Growth, Low Market Share)
- 4.3.4. Dogs (Low Growth, Low Market Share)
- 4.4. Ansoff Matrix Analysis
- 4.5. Supply Chain Analysis
- 4.6. Regulatory Landscape
- 4.7. Current Market Potential and Opportunity Assessment (TAM–SAM–SOM Framework)
- 4.8. VDR Analyst Note
- 4.1. Porters Five Forces
- 5. Market Analysis, Insights and Forecast 2021-2033
- 5.1. Market Analysis, Insights and Forecast - by Service
- 5.1.1. Full Truck Load (FTL)
- 5.1.2. Less-than Truckload (LTL)
- 5.1.3. Courier, Express, and Parcel (CEP)
- 5.2. Market Analysis, Insights and Forecast - by End-user
- 5.2.1. Manufacturing and Automotive
- 5.2.2. Oil and Gas, Mining, and Quarrying
- 5.2.3. Agriculture, Fishing, and Forestry
- 5.2.4. Construction
- 5.2.5. Distribu
- 5.2.6. Other En
- 5.3. Market Analysis, Insights and Forecast - by Region
- 5.3.1. North America
- 5.3.2. South America
- 5.3.3. Europe
- 5.3.4. Middle East & Africa
- 5.3.5. Asia Pacific
- 5.1. Market Analysis, Insights and Forecast - by Service
- 6. Global US Cross Border Transport Services Market Analysis, Insights and Forecast, 2021-2033
- 6.1. Market Analysis, Insights and Forecast - by Service
- 6.1.1. Full Truck Load (FTL)
- 6.1.2. Less-than Truckload (LTL)
- 6.1.3. Courier, Express, and Parcel (CEP)
- 6.2. Market Analysis, Insights and Forecast - by End-user
- 6.2.1. Manufacturing and Automotive
- 6.2.2. Oil and Gas, Mining, and Quarrying
- 6.2.3. Agriculture, Fishing, and Forestry
- 6.2.4. Construction
- 6.2.5. Distribu
- 6.2.6. Other En
- 6.1. Market Analysis, Insights and Forecast - by Service
- 7. North America US Cross Border Transport Services Market Analysis, Insights and Forecast, 2021-2033
- 7.1. Market Analysis, Insights and Forecast - by Service
- 7.1.1. Full Truck Load (FTL)
- 7.1.2. Less-than Truckload (LTL)
- 7.1.3. Courier, Express, and Parcel (CEP)
- 7.2. Market Analysis, Insights and Forecast - by End-user
- 7.2.1. Manufacturing and Automotive
- 7.2.2. Oil and Gas, Mining, and Quarrying
- 7.2.3. Agriculture, Fishing, and Forestry
- 7.2.4. Construction
- 7.2.5. Distribu
- 7.2.6. Other En
- 7.1. Market Analysis, Insights and Forecast - by Service
- 8. South America US Cross Border Transport Services Market Analysis, Insights and Forecast, 2021-2033
- 8.1. Market Analysis, Insights and Forecast - by Service
- 8.1.1. Full Truck Load (FTL)
- 8.1.2. Less-than Truckload (LTL)
- 8.1.3. Courier, Express, and Parcel (CEP)
- 8.2. Market Analysis, Insights and Forecast - by End-user
- 8.2.1. Manufacturing and Automotive
- 8.2.2. Oil and Gas, Mining, and Quarrying
- 8.2.3. Agriculture, Fishing, and Forestry
- 8.2.4. Construction
- 8.2.5. Distribu
- 8.2.6. Other En
- 8.1. Market Analysis, Insights and Forecast - by Service
- 9. Europe US Cross Border Transport Services Market Analysis, Insights and Forecast, 2021-2033
- 9.1. Market Analysis, Insights and Forecast - by Service
- 9.1.1. Full Truck Load (FTL)
- 9.1.2. Less-than Truckload (LTL)
- 9.1.3. Courier, Express, and Parcel (CEP)
- 9.2. Market Analysis, Insights and Forecast - by End-user
- 9.2.1. Manufacturing and Automotive
- 9.2.2. Oil and Gas, Mining, and Quarrying
- 9.2.3. Agriculture, Fishing, and Forestry
- 9.2.4. Construction
- 9.2.5. Distribu
- 9.2.6. Other En
- 9.1. Market Analysis, Insights and Forecast - by Service
- 10. Middle East & Africa US Cross Border Transport Services Market Analysis, Insights and Forecast, 2021-2033
- 10.1. Market Analysis, Insights and Forecast - by Service
- 10.1.1. Full Truck Load (FTL)
- 10.1.2. Less-than Truckload (LTL)
- 10.1.3. Courier, Express, and Parcel (CEP)
- 10.2. Market Analysis, Insights and Forecast - by End-user
- 10.2.1. Manufacturing and Automotive
- 10.2.2. Oil and Gas, Mining, and Quarrying
- 10.2.3. Agriculture, Fishing, and Forestry
- 10.2.4. Construction
- 10.2.5. Distribu
- 10.2.6. Other En
- 10.1. Market Analysis, Insights and Forecast - by Service
- 11. Asia Pacific US Cross Border Transport Services Market Analysis, Insights and Forecast, 2021-2033
- 11.1. Market Analysis, Insights and Forecast - by Service
- 11.1.1. Full Truck Load (FTL)
- 11.1.2. Less-than Truckload (LTL)
- 11.1.3. Courier, Express, and Parcel (CEP)
- 11.2. Market Analysis, Insights and Forecast - by End-user
- 11.2.1. Manufacturing and Automotive
- 11.2.2. Oil and Gas, Mining, and Quarrying
- 11.2.3. Agriculture, Fishing, and Forestry
- 11.2.4. Construction
- 11.2.5. Distribu
- 11.2.6. Other En
- 11.1. Market Analysis, Insights and Forecast - by Service
- 12. Competitive Analysis
- 12.1. Company Profiles
- 12.1.1 J B Hunt Transport Services Inc
- 12.1.1.1. Company Overview
- 12.1.1.2. Products
- 12.1.1.3. Company Financials
- 12.1.1.4. SWOT Analysis
- 12.1.2 DB Schenker
- 12.1.2.1. Company Overview
- 12.1.2.2. Products
- 12.1.2.3. Company Financials
- 12.1.2.4. SWOT Analysis
- 12.1.3 Moto Transportation
- 12.1.3.1. Company Overview
- 12.1.3.2. Products
- 12.1.3.3. Company Financials
- 12.1.3.4. SWOT Analysis
- 12.1.4 US Xpress
- 12.1.4.1. Company Overview
- 12.1.4.2. Products
- 12.1.4.3. Company Financials
- 12.1.4.4. SWOT Analysis
- 12.1.5 Landstar System Inc
- 12.1.5.1. Company Overview
- 12.1.5.2. Products
- 12.1.5.3. Company Financials
- 12.1.5.4. SWOT Analysis
- 12.1.6 C H Robinson
- 12.1.6.1. Company Overview
- 12.1.6.2. Products
- 12.1.6.3. Company Financials
- 12.1.6.4. SWOT Analysis
- 12.1.7 United Parcel Service (UPS)
- 12.1.7.1. Company Overview
- 12.1.7.2. Products
- 12.1.7.3. Company Financials
- 12.1.7.4. SWOT Analysis
- 12.1.8 YRC Worldwide Inc
- 12.1.8.1. Company Overview
- 12.1.8.2. Products
- 12.1.8.3. Company Financials
- 12.1.8.4. SWOT Analysis
- 12.1.9 Schneider National
- 12.1.9.1. Company Overview
- 12.1.9.2. Products
- 12.1.9.3. Company Financials
- 12.1.9.4. SWOT Analysis
- 12.1.10 FedEx
- 12.1.10.1. Company Overview
- 12.1.10.2. Products
- 12.1.10.3. Company Financials
- 12.1.10.4. SWOT Analysis
- 12.1.11 Polaris Transportation Group
- 12.1.11.1. Company Overview
- 12.1.11.2. Products
- 12.1.11.3. Company Financials
- 12.1.11.4. SWOT Analysis
- 12.1.12 Hitachi Transport System**List Not Exhaustive
- 12.1.12.1. Company Overview
- 12.1.12.2. Products
- 12.1.12.3. Company Financials
- 12.1.12.4. SWOT Analysis
- 12.1.13 Swift Transportation Company
- 12.1.13.1. Company Overview
- 12.1.13.2. Products
- 12.1.13.3. Company Financials
- 12.1.13.4. SWOT Analysis
- 12.1.14 XPO Logistics Inc
- 12.1.14.1. Company Overview
- 12.1.14.2. Products
- 12.1.14.3. Company Financials
- 12.1.14.4. SWOT Analysis
- 12.1.1 J B Hunt Transport Services Inc
- 12.2. Market Entropy
- 12.2.1 Company's Key Areas Served
- 12.2.2 Recent Developments
- 12.3. Company Market Share Analysis 2025
- 12.3.1 Top 5 Companies Market Share Analysis
- 12.3.2 Top 3 Companies Market Share Analysis
- 12.4. List of Potential Customers
- 13. Research Methodology
List of Figures
- Figure 1: Global US Cross Border Transport Services Market Revenue Breakdown (billion, %) by Region 2025 & 2033
- Figure 2: North America US Cross Border Transport Services Market Revenue (billion), by Service 2025 & 2033
- Figure 3: North America US Cross Border Transport Services Market Revenue Share (%), by Service 2025 & 2033
- Figure 4: North America US Cross Border Transport Services Market Revenue (billion), by End-user 2025 & 2033
- Figure 5: North America US Cross Border Transport Services Market Revenue Share (%), by End-user 2025 & 2033
- Figure 6: North America US Cross Border Transport Services Market Revenue (billion), by Country 2025 & 2033
- Figure 7: North America US Cross Border Transport Services Market Revenue Share (%), by Country 2025 & 2033
- Figure 8: South America US Cross Border Transport Services Market Revenue (billion), by Service 2025 & 2033
- Figure 9: South America US Cross Border Transport Services Market Revenue Share (%), by Service 2025 & 2033
- Figure 10: South America US Cross Border Transport Services Market Revenue (billion), by End-user 2025 & 2033
- Figure 11: South America US Cross Border Transport Services Market Revenue Share (%), by End-user 2025 & 2033
- Figure 12: South America US Cross Border Transport Services Market Revenue (billion), by Country 2025 & 2033
- Figure 13: South America US Cross Border Transport Services Market Revenue Share (%), by Country 2025 & 2033
- Figure 14: Europe US Cross Border Transport Services Market Revenue (billion), by Service 2025 & 2033
- Figure 15: Europe US Cross Border Transport Services Market Revenue Share (%), by Service 2025 & 2033
- Figure 16: Europe US Cross Border Transport Services Market Revenue (billion), by End-user 2025 & 2033
- Figure 17: Europe US Cross Border Transport Services Market Revenue Share (%), by End-user 2025 & 2033
- Figure 18: Europe US Cross Border Transport Services Market Revenue (billion), by Country 2025 & 2033
- Figure 19: Europe US Cross Border Transport Services Market Revenue Share (%), by Country 2025 & 2033
- Figure 20: Middle East & Africa US Cross Border Transport Services Market Revenue (billion), by Service 2025 & 2033
- Figure 21: Middle East & Africa US Cross Border Transport Services Market Revenue Share (%), by Service 2025 & 2033
- Figure 22: Middle East & Africa US Cross Border Transport Services Market Revenue (billion), by End-user 2025 & 2033
- Figure 23: Middle East & Africa US Cross Border Transport Services Market Revenue Share (%), by End-user 2025 & 2033
- Figure 24: Middle East & Africa US Cross Border Transport Services Market Revenue (billion), by Country 2025 & 2033
- Figure 25: Middle East & Africa US Cross Border Transport Services Market Revenue Share (%), by Country 2025 & 2033
- Figure 26: Asia Pacific US Cross Border Transport Services Market Revenue (billion), by Service 2025 & 2033
- Figure 27: Asia Pacific US Cross Border Transport Services Market Revenue Share (%), by Service 2025 & 2033
- Figure 28: Asia Pacific US Cross Border Transport Services Market Revenue (billion), by End-user 2025 & 2033
- Figure 29: Asia Pacific US Cross Border Transport Services Market Revenue Share (%), by End-user 2025 & 2033
- Figure 30: Asia Pacific US Cross Border Transport Services Market Revenue (billion), by Country 2025 & 2033
- Figure 31: Asia Pacific US Cross Border Transport Services Market Revenue Share (%), by Country 2025 & 2033
List of Tables
- Table 1: Global US Cross Border Transport Services Market Revenue billion Forecast, by Service 2020 & 2033
- Table 2: Global US Cross Border Transport Services Market Revenue billion Forecast, by End-user 2020 & 2033
- Table 3: Global US Cross Border Transport Services Market Revenue billion Forecast, by Region 2020 & 2033
- Table 4: Global US Cross Border Transport Services Market Revenue billion Forecast, by Service 2020 & 2033
- Table 5: Global US Cross Border Transport Services Market Revenue billion Forecast, by End-user 2020 & 2033
- Table 6: Global US Cross Border Transport Services Market Revenue billion Forecast, by Country 2020 & 2033
- Table 7: United States US Cross Border Transport Services Market Revenue (billion) Forecast, by Application 2020 & 2033
- Table 8: Canada US Cross Border Transport Services Market Revenue (billion) Forecast, by Application 2020 & 2033
- Table 9: Mexico US Cross Border Transport Services Market Revenue (billion) Forecast, by Application 2020 & 2033
- Table 10: Global US Cross Border Transport Services Market Revenue billion Forecast, by Service 2020 & 2033
- Table 11: Global US Cross Border Transport Services Market Revenue billion Forecast, by End-user 2020 & 2033
- Table 12: Global US Cross Border Transport Services Market Revenue billion Forecast, by Country 2020 & 2033
- Table 13: Brazil US Cross Border Transport Services Market Revenue (billion) Forecast, by Application 2020 & 2033
- Table 14: Argentina US Cross Border Transport Services Market Revenue (billion) Forecast, by Application 2020 & 2033
- Table 15: Rest of South America US Cross Border Transport Services Market Revenue (billion) Forecast, by Application 2020 & 2033
- Table 16: Global US Cross Border Transport Services Market Revenue billion Forecast, by Service 2020 & 2033
- Table 17: Global US Cross Border Transport Services Market Revenue billion Forecast, by End-user 2020 & 2033
- Table 18: Global US Cross Border Transport Services Market Revenue billion Forecast, by Country 2020 & 2033
- Table 19: United Kingdom US Cross Border Transport Services Market Revenue (billion) Forecast, by Application 2020 & 2033
- Table 20: Germany US Cross Border Transport Services Market Revenue (billion) Forecast, by Application 2020 & 2033
- Table 21: France US Cross Border Transport Services Market Revenue (billion) Forecast, by Application 2020 & 2033
- Table 22: Italy US Cross Border Transport Services Market Revenue (billion) Forecast, by Application 2020 & 2033
- Table 23: Spain US Cross Border Transport Services Market Revenue (billion) Forecast, by Application 2020 & 2033
- Table 24: Russia US Cross Border Transport Services Market Revenue (billion) Forecast, by Application 2020 & 2033
- Table 25: Benelux US Cross Border Transport Services Market Revenue (billion) Forecast, by Application 2020 & 2033
- Table 26: Nordics US Cross Border Transport Services Market Revenue (billion) Forecast, by Application 2020 & 2033
- Table 27: Rest of Europe US Cross Border Transport Services Market Revenue (billion) Forecast, by Application 2020 & 2033
- Table 28: Global US Cross Border Transport Services Market Revenue billion Forecast, by Service 2020 & 2033
- Table 29: Global US Cross Border Transport Services Market Revenue billion Forecast, by End-user 2020 & 2033
- Table 30: Global US Cross Border Transport Services Market Revenue billion Forecast, by Country 2020 & 2033
- Table 31: Turkey US Cross Border Transport Services Market Revenue (billion) Forecast, by Application 2020 & 2033
- Table 32: Israel US Cross Border Transport Services Market Revenue (billion) Forecast, by Application 2020 & 2033
- Table 33: GCC US Cross Border Transport Services Market Revenue (billion) Forecast, by Application 2020 & 2033
- Table 34: North Africa US Cross Border Transport Services Market Revenue (billion) Forecast, by Application 2020 & 2033
- Table 35: South Africa US Cross Border Transport Services Market Revenue (billion) Forecast, by Application 2020 & 2033
- Table 36: Rest of Middle East & Africa US Cross Border Transport Services Market Revenue (billion) Forecast, by Application 2020 & 2033
- Table 37: Global US Cross Border Transport Services Market Revenue billion Forecast, by Service 2020 & 2033
- Table 38: Global US Cross Border Transport Services Market Revenue billion Forecast, by End-user 2020 & 2033
- Table 39: Global US Cross Border Transport Services Market Revenue billion Forecast, by Country 2020 & 2033
- Table 40: China US Cross Border Transport Services Market Revenue (billion) Forecast, by Application 2020 & 2033
- Table 41: India US Cross Border Transport Services Market Revenue (billion) Forecast, by Application 2020 & 2033
- Table 42: Japan US Cross Border Transport Services Market Revenue (billion) Forecast, by Application 2020 & 2033
- Table 43: South Korea US Cross Border Transport Services Market Revenue (billion) Forecast, by Application 2020 & 2033
- Table 44: ASEAN US Cross Border Transport Services Market Revenue (billion) Forecast, by Application 2020 & 2033
- Table 45: Oceania US Cross Border Transport Services Market Revenue (billion) Forecast, by Application 2020 & 2033
- Table 46: Rest of Asia Pacific US Cross Border Transport Services Market Revenue (billion) Forecast, by Application 2020 & 2033
Frequently Asked Questions
1. What is the projected Compound Annual Growth Rate (CAGR) of the US Cross Border Transport Services Market?
The projected CAGR is approximately 6%.
2. Which companies are prominent players in the US Cross Border Transport Services Market?
Key companies in the market include J B Hunt Transport Services Inc, DB Schenker, Moto Transportation, US Xpress, Landstar System Inc, C H Robinson, United Parcel Service (UPS), YRC Worldwide Inc, Schneider National, FedEx, Polaris Transportation Group, Hitachi Transport System**List Not Exhaustive, Swift Transportation Company, XPO Logistics Inc.
3. What are the main segments of the US Cross Border Transport Services Market?
The market segments include Service, End-user.
4. Can you provide details about the market size?
The market size is estimated to be USD 282.7 billion as of 2022.
5. What are some drivers contributing to market growth?
Cost Efficiency and Environmental Sustainability; Infrastructure Development; Rising Consumer Demand.
6. What are the notable trends driving market growth?
Free Trade Agreements (FTAs) Facilitating the Growth of the Market.
7. Are there any restraints impacting market growth?
High Fragmentation of the Logistics Industry; Data Security Concerns.
8. Can you provide examples of recent developments in the market?
October 2022: KAG Logistics completed the acquisition of Toronto-based cross-border freight transportation company Connectrans Logistics. Connectrans has an established carrier network between the U.S. and Canada with expertise in transportation solutions within dry van, temperature control, flatbed, over-dimensional, and intermodal. The acquisition of Connectrans expands KAG Logistics's footprint in the Canadian logistics market. The acquisition will also give Connectrans customers more access to the U.S. marketplace, specialized assets, technologies, and additional logistics expertise.
9. What pricing options are available for accessing the report?
Pricing options include single-user, multi-user, and enterprise licenses priced at USD 3800, USD 4500, and USD 5800 respectively.
10. Is the market size provided in terms of value or volume?
The market size is provided in terms of value, measured in billion.
11. Are there any specific market keywords associated with the report?
Yes, the market keyword associated with the report is "US Cross Border Transport Services Market," which aids in identifying and referencing the specific market segment covered.
12. How do I determine which pricing option suits my needs best?
The pricing options vary based on user requirements and access needs. Individual users may opt for single-user licenses, while businesses requiring broader access may choose multi-user or enterprise licenses for cost-effective access to the report.
13. Are there any additional resources or data provided in the US Cross Border Transport Services Market report?
While the report offers comprehensive insights, it's advisable to review the specific contents or supplementary materials provided to ascertain if additional resources or data are available.
14. How can I stay updated on further developments or reports in the US Cross Border Transport Services Market?
To stay informed about further developments, trends, and reports in the US Cross Border Transport Services Market, consider subscribing to industry newsletters, following relevant companies and organizations, or regularly checking reputable industry news sources and publications.
Methodology
Step 1 - Identification of Relevant Samples Size from Population Database


Step 2 - Approaches for Defining Global Market Size (Value, Volume* & Price*)

Note*: In applicable scenarios
Step 3 - Data Sources
Primary Research
- Web Analytics
- Survey Reports
- Research Institute
- Latest Research Reports
- Opinion Leaders
Secondary Research
- Annual Reports
- White Paper
- Latest Press Release
- Industry Association
- Paid Database
- Investor Presentations

Step 4 - Data Triangulation
Involves using different sources of information in order to increase the validity of a study
These sources are likely to be stakeholders in a program - participants, other researchers, program staff, other community members, and so on.
Then we put all data in single framework & apply various statistical tools to find out the dynamic on the market.
During the analysis stage, feedback from the stakeholder groups would be compared to determine areas of agreement as well as areas of divergence