

Key Insights
The Automotive Third-Party Logistics (3PL) market is experiencing significant expansion, driven by the increasing complexity of global automotive supply chains and the escalating demand for optimized logistics solutions. The market, projected for a Compound Annual Growth Rate (CAGR) of 9.1%, is estimated to reach $1260.98 billion by 2025. This growth is underpinned by several critical factors. Firstly, the automotive industry's widespread adoption of just-in-time manufacturing necessitates highly reliable and agile 3PL partners to manage intricate inventory flows and minimize lead times. Secondly, the burgeoning e-commerce sector for automotive parts and accessories requires robust distribution and warehousing infrastructure, further stimulating demand for 3PL services. Lastly, the ongoing evolution towards electric vehicles and autonomous driving technologies demands specialized logistics management to address the unique handling and transportation needs of these innovative sectors.
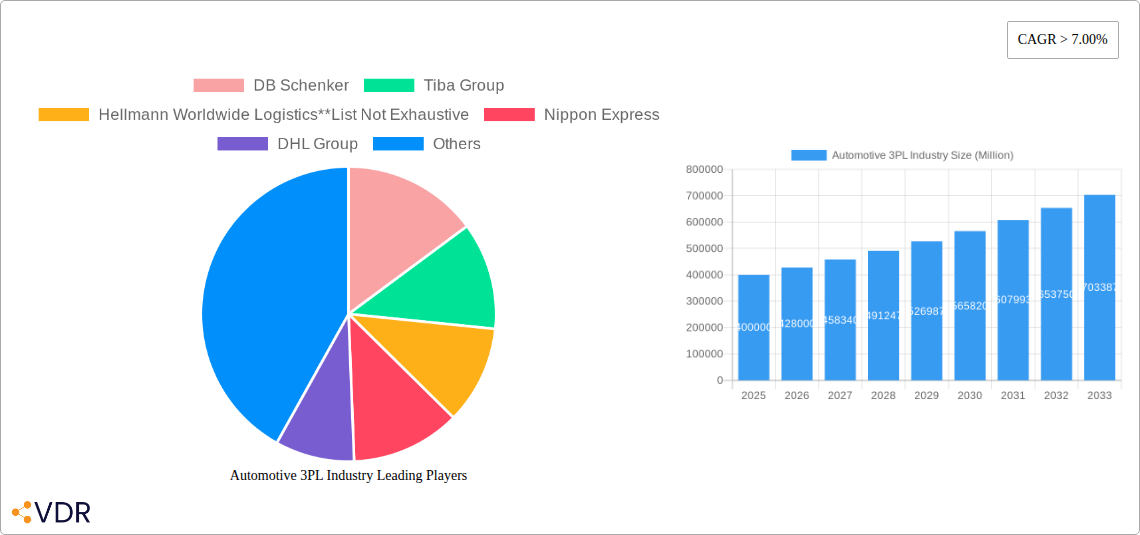
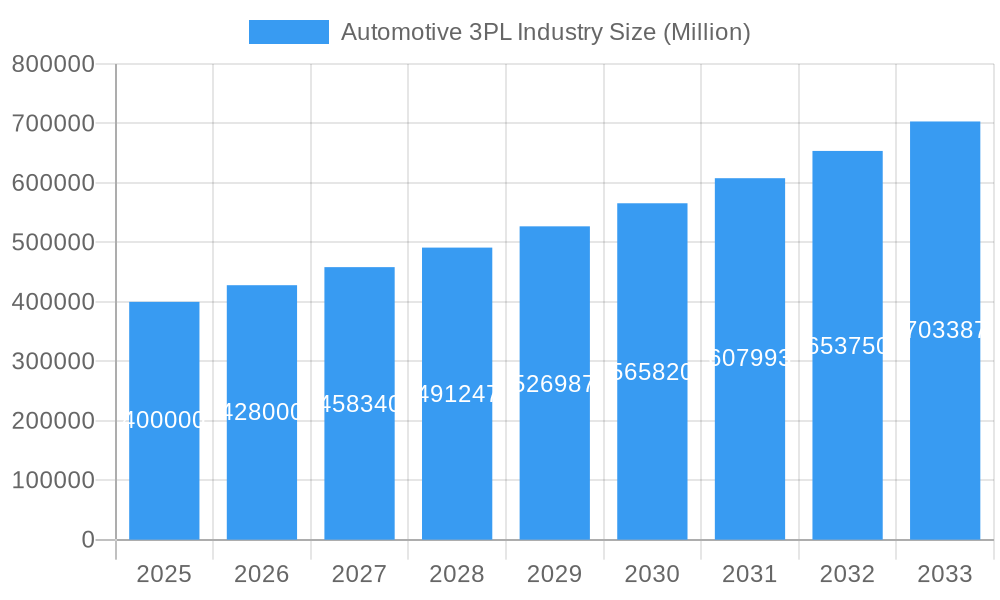
Automotive 3PL Industry Market Size (In Million)
Geographically, the automotive 3PL market is segmented, with North America, Europe, and Asia-Pacific serving as key regional markets. Service offerings span transportation (road, rail, sea, air), warehousing, distribution, and inventory management. This competitive landscape features prominent players such as DB Schenker, DHL Group, and XPO Logistics, who are actively innovating through technological advancements, strategic alliances, and enhanced service portfolios. While challenges like geopolitical instability, volatile fuel prices, and potential labor shortages exist, the long-term outlook for the automotive 3PL sector remains exceptionally strong, indicating sustained growth and a growing need for sophisticated logistics solutions tailored to the dynamic automotive industry. Further segmentation by vehicle type, including finished vehicles and auto components, presents specialized opportunities for logistics providers adept at managing distinct segment challenges.
Automotive 3PL Industry Company Market Share
Automotive 3PL Market Analysis: 2025-2033
This comprehensive report offers a deep dive into the Automotive 3PL industry, providing critical insights for stakeholders. The study covers the forecast period 2025-2033, with 2025 serving as the base year. It analyzes market dynamics, growth trajectories, regional performance, key industry participants, and future prospects. Key segments examined include Finished Vehicle and Auto Component logistics, encompassing Transportation, Warehousing, Distribution, and Inventory Management services across North America, Mexico, South America, Asia-Pacific, the Middle East, and Africa.
Automotive 3PL Industry Market Dynamics & Structure
The Automotive 3PL market is characterized by a moderately consolidated structure with several large global players and numerous regional operators. Market concentration is driven by economies of scale, technological capabilities, and global network reach. Leading players like DB Schenker, DHL Group, and XPO Logistics hold significant market share, but the landscape is dynamic due to ongoing mergers and acquisitions (M&A) activity. The report quantifies market concentration through Herfindahl-Hirschman Index (HHI) analysis (xx) and provides detailed market share percentages for key players.
Market Dynamics:
- Technological Innovation: Automation (robotics, AI), blockchain for enhanced transparency and traceability, and digitalization of logistics processes are key drivers.
- Regulatory Frameworks: Compliance with environmental regulations, trade policies, and data privacy laws significantly impact operational costs and strategies.
- Competitive Substitutes: Internalization of logistics functions by automotive manufacturers presents a competitive threat.
- End-User Demographics: Growth is fueled by increasing global automotive production and the need for efficient supply chains within evolving consumer demands.
- M&A Trends: The acquisition of GEFCO by CEVA Logistics in 2023 exemplifies the ongoing consolidation trend, aiming for greater efficiency and market reach. The report analyzes M&A activity from 2019-2024 (xx deals) and projects future trends (xx deals projected 2025-2033). Innovation barriers include high initial investment costs for advanced technologies and integration challenges across diverse systems.
Automotive 3PL Industry Growth Trends & Insights
The Automotive 3PL market is experiencing substantial growth, driven by the global expansion of the automotive industry and increasing outsourcing of logistics functions. The report utilizes various analytical models (XXX) to project a Compound Annual Growth Rate (CAGR) of xx% during the forecast period (2025-2033), with the market size estimated at xx million units in 2025 and projected to reach xx million units by 2033. This growth is underpinned by rising demand for just-in-time delivery, enhanced supply chain visibility, and optimized inventory management. Technological disruptions such as the Internet of Things (IoT) and big data analytics are accelerating efficiency gains and transforming the industry landscape. Shifting consumer behavior, such as increased demand for electric vehicles and personalized vehicle options, also influences logistics requirements. Market penetration of advanced logistics technologies will reach xx% by 2033 from xx% in 2025.
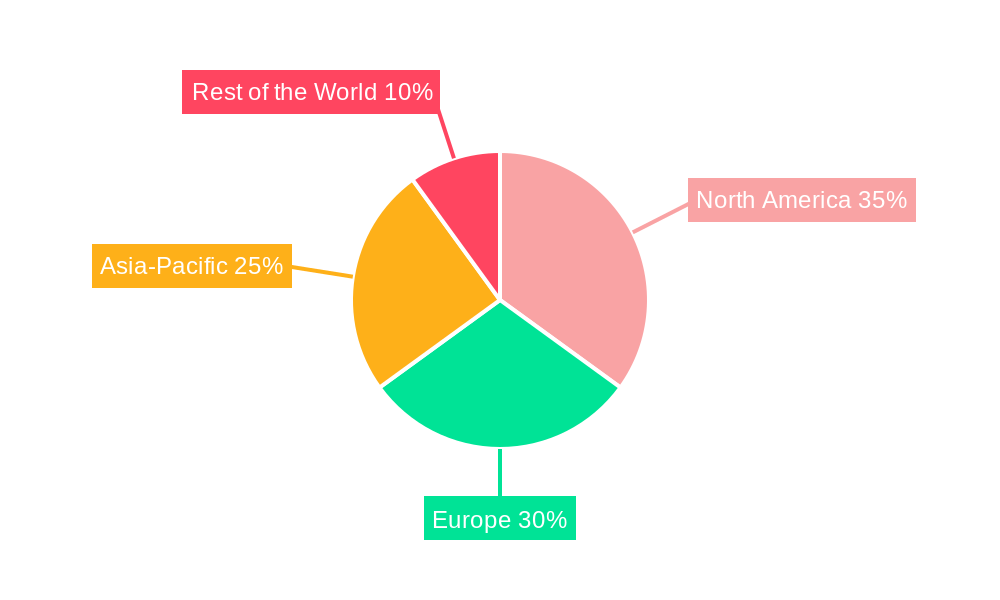
Dominant Regions, Countries, or Segments in Automotive 3PL Industry
North America currently holds the largest market share, followed by Asia-Pacific. However, the Asia-Pacific region demonstrates high growth potential, driven by rapid industrialization and automotive manufacturing expansion in countries like China and India. Within segments, the Finished Vehicle logistics segment dominates, reflecting the higher value and complexity associated with transporting complete vehicles. However, the Auto Component segment shows faster growth due to the increasing complexity of vehicle production and the need for specialized handling.
Key Drivers by Region/Segment:
- North America: Strong automotive manufacturing base, well-developed infrastructure, and proximity to major markets.
- Asia-Pacific: Rapid growth of automotive production, particularly in China and India, supportive government policies.
- Europe: Established automotive industry, presence of major 3PL providers, high demand for efficient logistics solutions.
- Finished Vehicle: High value, specialized handling requirements, and demand for secure and timely delivery.
- Auto Components: Increasing complexity of vehicle components, diverse supply chain networks, need for specialized transportation and warehousing solutions.
Automotive 3PL Industry Product Landscape
The Automotive 3PL market offers a diverse range of services, including customized transportation solutions (rail, sea, road), specialized warehousing with climate-controlled facilities, sophisticated distribution networks using advanced route optimization software, and real-time inventory management systems. Unique selling propositions include tailored solutions, end-to-end visibility, advanced technology integration, and global network capabilities. Continuous technological advancements drive efficiency improvements, cost reductions, and enhanced security.
Key Drivers, Barriers & Challenges in Automotive 3PL Industry
Key Drivers:
- Increasing global automotive production
- Growing demand for just-in-time delivery
- Rise of e-commerce in automotive parts and accessories
- Technological advancements (automation, AI, IoT)
Challenges:
- Supply chain disruptions (e.g., port congestion, geopolitical instability) impacting delivery times and costs (estimated xx million units impact in 2024).
- Regulatory compliance complexities (e.g., environmental regulations, trade restrictions) adding operational costs.
- Intense competition from existing and emerging players (creating pressure on pricing and margins).
Emerging Opportunities in Automotive 3PL Industry
- Expansion into emerging markets with growing automotive industries (e.g., Southeast Asia, Africa).
- Development of specialized logistics solutions for electric vehicles (EVs) and autonomous vehicles.
- Increased focus on sustainable and environmentally friendly logistics practices.
Growth Accelerators in the Automotive 3PL Industry Industry
Strategic partnerships between 3PL providers and automotive manufacturers are driving growth, enabling integrated and optimized supply chain solutions. Technological advancements such as AI-powered predictive analytics and blockchain technology for enhanced transparency are further accelerating efficiency gains and driving market expansion.
Key Players Shaping the Automotive 3PL Industry Market
- DB Schenker
- Tiba Group
- Hellmann Worldwide Logistics
- Nippon Express
- DHL Group
- XPO Logistics
- CEVA Logistics
- GEFCO
- Kerry Logistics
- DSV
Notable Milestones in Automotive 3PL Industry Sector
- January 2023: CEVA Logistics acquires GEFCO, creating a larger player in finished vehicle logistics.
- October 2022: Partners Warehouse acquires FLEX Logistics, expanding its West Coast warehousing and distribution capabilities.
In-Depth Automotive 3PL Industry Market Outlook
The Automotive 3PL market is poised for continued strong growth, driven by technological innovation, strategic partnerships, and the expanding global automotive industry. Opportunities exist in leveraging advanced technologies for enhanced efficiency, sustainability, and supply chain resilience. The strategic focus will be on providing tailored, technologically-advanced solutions to meet the evolving needs of automotive manufacturers and consumers.
Automotive 3PL Industry Segmentation
-
1. Type
- 1.1. Finished Vehicle
- 1.2. Auto Component
-
2. Service
- 2.1. Transportation
- 2.2. Warehous
Automotive 3PL Industry Segmentation By Geography
-
1. North America
- 1.1. United States
- 1.2. Canada
- 1.3. Mexico
-
2. South America
- 2.1. Brazil
- 2.2. Argentina
- 2.3. Rest of South America
-
3. Europe
- 3.1. United Kingdom
- 3.2. Germany
- 3.3. France
- 3.4. Italy
- 3.5. Spain
- 3.6. Russia
- 3.7. Benelux
- 3.8. Nordics
- 3.9. Rest of Europe
-
4. Middle East & Africa
- 4.1. Turkey
- 4.2. Israel
- 4.3. GCC
- 4.4. North Africa
- 4.5. South Africa
- 4.6. Rest of Middle East & Africa
-
5. Asia Pacific
- 5.1. China
- 5.2. India
- 5.3. Japan
- 5.4. South Korea
- 5.5. ASEAN
- 5.6. Oceania
- 5.7. Rest of Asia Pacific
Automotive 3PL Industry Regional Market Share
Geographic Coverage of Automotive 3PL Industry
Automotive 3PL Industry REPORT HIGHLIGHTS
| Aspects | Details |
|---|---|
| Study Period | 2020-2034 |
| Base Year | 2025 |
| Estimated Year | 2026 |
| Forecast Period | 2026-2034 |
| Historical Period | 2020-2025 |
| Growth Rate | CAGR of 9.1% from 2020-2034 |
| Segmentation |
|
Table of Contents
- 1. Introduction
- 1.1. Research Scope
- 1.2. Market Segmentation
- 1.3. Research Objective
- 1.4. Definitions and Assumptions
- 2. Executive Summary
- 2.1. Market Snapshot
- 3. Market Dynamics
- 3.1. Market Drivers
- 3.2. Market Restrains
- 3.3. Market Trends
- 3.4. Market Opportunities
- 4. Market Factor Analysis
- 4.1. Porters Five Forces
- 4.1.1. Bargaining Power of Suppliers
- 4.1.2. Bargaining Power of Buyers
- 4.1.3. Threat of New Entrants
- 4.1.4. Threat of Substitutes
- 4.1.5. Competitive Rivalry
- 4.2. PESTEL analysis
- 4.3. BCG Analysis
- 4.3.1. Stars (High Growth, High Market Share)
- 4.3.2. Cash Cows (Low Growth, High Market Share)
- 4.3.3. Question Mark (High Growth, Low Market Share)
- 4.3.4. Dogs (Low Growth, Low Market Share)
- 4.4. Ansoff Matrix Analysis
- 4.5. Supply Chain Analysis
- 4.6. Regulatory Landscape
- 4.7. Current Market Potential and Opportunity Assessment (TAM–SAM–SOM Framework)
- 4.8. VDR Analyst Note
- 4.1. Porters Five Forces
- 5. Market Analysis, Insights and Forecast 2021-2033
- 5.1. Market Analysis, Insights and Forecast - by Type
- 5.1.1. Finished Vehicle
- 5.1.2. Auto Component
- 5.2. Market Analysis, Insights and Forecast - by Service
- 5.2.1. Transportation
- 5.2.2. Warehous
- 5.3. Market Analysis, Insights and Forecast - by Region
- 5.3.1. North America
- 5.3.2. South America
- 5.3.3. Europe
- 5.3.4. Middle East & Africa
- 5.3.5. Asia Pacific
- 5.1. Market Analysis, Insights and Forecast - by Type
- 6. Global Automotive 3PL Industry Analysis, Insights and Forecast, 2021-2033
- 6.1. Market Analysis, Insights and Forecast - by Type
- 6.1.1. Finished Vehicle
- 6.1.2. Auto Component
- 6.2. Market Analysis, Insights and Forecast - by Service
- 6.2.1. Transportation
- 6.2.2. Warehous
- 6.1. Market Analysis, Insights and Forecast - by Type
- 7. North America Automotive 3PL Industry Analysis, Insights and Forecast, 2021-2033
- 7.1. Market Analysis, Insights and Forecast - by Type
- 7.1.1. Finished Vehicle
- 7.1.2. Auto Component
- 7.2. Market Analysis, Insights and Forecast - by Service
- 7.2.1. Transportation
- 7.2.2. Warehous
- 7.1. Market Analysis, Insights and Forecast - by Type
- 8. South America Automotive 3PL Industry Analysis, Insights and Forecast, 2021-2033
- 8.1. Market Analysis, Insights and Forecast - by Type
- 8.1.1. Finished Vehicle
- 8.1.2. Auto Component
- 8.2. Market Analysis, Insights and Forecast - by Service
- 8.2.1. Transportation
- 8.2.2. Warehous
- 8.1. Market Analysis, Insights and Forecast - by Type
- 9. Europe Automotive 3PL Industry Analysis, Insights and Forecast, 2021-2033
- 9.1. Market Analysis, Insights and Forecast - by Type
- 9.1.1. Finished Vehicle
- 9.1.2. Auto Component
- 9.2. Market Analysis, Insights and Forecast - by Service
- 9.2.1. Transportation
- 9.2.2. Warehous
- 9.1. Market Analysis, Insights and Forecast - by Type
- 10. Middle East & Africa Automotive 3PL Industry Analysis, Insights and Forecast, 2021-2033
- 10.1. Market Analysis, Insights and Forecast - by Type
- 10.1.1. Finished Vehicle
- 10.1.2. Auto Component
- 10.2. Market Analysis, Insights and Forecast - by Service
- 10.2.1. Transportation
- 10.2.2. Warehous
- 10.1. Market Analysis, Insights and Forecast - by Type
- 11. Asia Pacific Automotive 3PL Industry Analysis, Insights and Forecast, 2021-2033
- 11.1. Market Analysis, Insights and Forecast - by Type
- 11.1.1. Finished Vehicle
- 11.1.2. Auto Component
- 11.2. Market Analysis, Insights and Forecast - by Service
- 11.2.1. Transportation
- 11.2.2. Warehous
- 11.1. Market Analysis, Insights and Forecast - by Type
- 12. Competitive Analysis
- 12.1. Company Profiles
- 12.1.1 DB Schenker
- 12.1.1.1. Company Overview
- 12.1.1.2. Products
- 12.1.1.3. Company Financials
- 12.1.1.4. SWOT Analysis
- 12.1.2 Tiba Group
- 12.1.2.1. Company Overview
- 12.1.2.2. Products
- 12.1.2.3. Company Financials
- 12.1.2.4. SWOT Analysis
- 12.1.3 Hellmann Worldwide Logistics**List Not Exhaustive
- 12.1.3.1. Company Overview
- 12.1.3.2. Products
- 12.1.3.3. Company Financials
- 12.1.3.4. SWOT Analysis
- 12.1.4 Nippon Express
- 12.1.4.1. Company Overview
- 12.1.4.2. Products
- 12.1.4.3. Company Financials
- 12.1.4.4. SWOT Analysis
- 12.1.5 DHL Group
- 12.1.5.1. Company Overview
- 12.1.5.2. Products
- 12.1.5.3. Company Financials
- 12.1.5.4. SWOT Analysis
- 12.1.6 XPO Logistics
- 12.1.6.1. Company Overview
- 12.1.6.2. Products
- 12.1.6.3. Company Financials
- 12.1.6.4. SWOT Analysis
- 12.1.7 CEVA Logistics
- 12.1.7.1. Company Overview
- 12.1.7.2. Products
- 12.1.7.3. Company Financials
- 12.1.7.4. SWOT Analysis
- 12.1.8 GEFCO
- 12.1.8.1. Company Overview
- 12.1.8.2. Products
- 12.1.8.3. Company Financials
- 12.1.8.4. SWOT Analysis
- 12.1.9 Kerry Logistics
- 12.1.9.1. Company Overview
- 12.1.9.2. Products
- 12.1.9.3. Company Financials
- 12.1.9.4. SWOT Analysis
- 12.1.10 DSV
- 12.1.10.1. Company Overview
- 12.1.10.2. Products
- 12.1.10.3. Company Financials
- 12.1.10.4. SWOT Analysis
- 12.1.1 DB Schenker
- 12.2. Market Entropy
- 12.2.1 Company's Key Areas Served
- 12.2.2 Recent Developments
- 12.3. Company Market Share Analysis 2025
- 12.3.1 Top 5 Companies Market Share Analysis
- 12.3.2 Top 3 Companies Market Share Analysis
- 12.4. List of Potential Customers
- 13. Research Methodology
List of Figures
- Figure 1: Global Automotive 3PL Industry Revenue Breakdown (billion, %) by Region 2025 & 2033
- Figure 2: North America Automotive 3PL Industry Revenue (billion), by Type 2025 & 2033
- Figure 3: North America Automotive 3PL Industry Revenue Share (%), by Type 2025 & 2033
- Figure 4: North America Automotive 3PL Industry Revenue (billion), by Service 2025 & 2033
- Figure 5: North America Automotive 3PL Industry Revenue Share (%), by Service 2025 & 2033
- Figure 6: North America Automotive 3PL Industry Revenue (billion), by Country 2025 & 2033
- Figure 7: North America Automotive 3PL Industry Revenue Share (%), by Country 2025 & 2033
- Figure 8: South America Automotive 3PL Industry Revenue (billion), by Type 2025 & 2033
- Figure 9: South America Automotive 3PL Industry Revenue Share (%), by Type 2025 & 2033
- Figure 10: South America Automotive 3PL Industry Revenue (billion), by Service 2025 & 2033
- Figure 11: South America Automotive 3PL Industry Revenue Share (%), by Service 2025 & 2033
- Figure 12: South America Automotive 3PL Industry Revenue (billion), by Country 2025 & 2033
- Figure 13: South America Automotive 3PL Industry Revenue Share (%), by Country 2025 & 2033
- Figure 14: Europe Automotive 3PL Industry Revenue (billion), by Type 2025 & 2033
- Figure 15: Europe Automotive 3PL Industry Revenue Share (%), by Type 2025 & 2033
- Figure 16: Europe Automotive 3PL Industry Revenue (billion), by Service 2025 & 2033
- Figure 17: Europe Automotive 3PL Industry Revenue Share (%), by Service 2025 & 2033
- Figure 18: Europe Automotive 3PL Industry Revenue (billion), by Country 2025 & 2033
- Figure 19: Europe Automotive 3PL Industry Revenue Share (%), by Country 2025 & 2033
- Figure 20: Middle East & Africa Automotive 3PL Industry Revenue (billion), by Type 2025 & 2033
- Figure 21: Middle East & Africa Automotive 3PL Industry Revenue Share (%), by Type 2025 & 2033
- Figure 22: Middle East & Africa Automotive 3PL Industry Revenue (billion), by Service 2025 & 2033
- Figure 23: Middle East & Africa Automotive 3PL Industry Revenue Share (%), by Service 2025 & 2033
- Figure 24: Middle East & Africa Automotive 3PL Industry Revenue (billion), by Country 2025 & 2033
- Figure 25: Middle East & Africa Automotive 3PL Industry Revenue Share (%), by Country 2025 & 2033
- Figure 26: Asia Pacific Automotive 3PL Industry Revenue (billion), by Type 2025 & 2033
- Figure 27: Asia Pacific Automotive 3PL Industry Revenue Share (%), by Type 2025 & 2033
- Figure 28: Asia Pacific Automotive 3PL Industry Revenue (billion), by Service 2025 & 2033
- Figure 29: Asia Pacific Automotive 3PL Industry Revenue Share (%), by Service 2025 & 2033
- Figure 30: Asia Pacific Automotive 3PL Industry Revenue (billion), by Country 2025 & 2033
- Figure 31: Asia Pacific Automotive 3PL Industry Revenue Share (%), by Country 2025 & 2033
List of Tables
- Table 1: Global Automotive 3PL Industry Revenue billion Forecast, by Type 2020 & 2033
- Table 2: Global Automotive 3PL Industry Revenue billion Forecast, by Service 2020 & 2033
- Table 3: Global Automotive 3PL Industry Revenue billion Forecast, by Region 2020 & 2033
- Table 4: Global Automotive 3PL Industry Revenue billion Forecast, by Type 2020 & 2033
- Table 5: Global Automotive 3PL Industry Revenue billion Forecast, by Service 2020 & 2033
- Table 6: Global Automotive 3PL Industry Revenue billion Forecast, by Country 2020 & 2033
- Table 7: United States Automotive 3PL Industry Revenue (billion) Forecast, by Application 2020 & 2033
- Table 8: Canada Automotive 3PL Industry Revenue (billion) Forecast, by Application 2020 & 2033
- Table 9: Mexico Automotive 3PL Industry Revenue (billion) Forecast, by Application 2020 & 2033
- Table 10: Global Automotive 3PL Industry Revenue billion Forecast, by Type 2020 & 2033
- Table 11: Global Automotive 3PL Industry Revenue billion Forecast, by Service 2020 & 2033
- Table 12: Global Automotive 3PL Industry Revenue billion Forecast, by Country 2020 & 2033
- Table 13: Brazil Automotive 3PL Industry Revenue (billion) Forecast, by Application 2020 & 2033
- Table 14: Argentina Automotive 3PL Industry Revenue (billion) Forecast, by Application 2020 & 2033
- Table 15: Rest of South America Automotive 3PL Industry Revenue (billion) Forecast, by Application 2020 & 2033
- Table 16: Global Automotive 3PL Industry Revenue billion Forecast, by Type 2020 & 2033
- Table 17: Global Automotive 3PL Industry Revenue billion Forecast, by Service 2020 & 2033
- Table 18: Global Automotive 3PL Industry Revenue billion Forecast, by Country 2020 & 2033
- Table 19: United Kingdom Automotive 3PL Industry Revenue (billion) Forecast, by Application 2020 & 2033
- Table 20: Germany Automotive 3PL Industry Revenue (billion) Forecast, by Application 2020 & 2033
- Table 21: France Automotive 3PL Industry Revenue (billion) Forecast, by Application 2020 & 2033
- Table 22: Italy Automotive 3PL Industry Revenue (billion) Forecast, by Application 2020 & 2033
- Table 23: Spain Automotive 3PL Industry Revenue (billion) Forecast, by Application 2020 & 2033
- Table 24: Russia Automotive 3PL Industry Revenue (billion) Forecast, by Application 2020 & 2033
- Table 25: Benelux Automotive 3PL Industry Revenue (billion) Forecast, by Application 2020 & 2033
- Table 26: Nordics Automotive 3PL Industry Revenue (billion) Forecast, by Application 2020 & 2033
- Table 27: Rest of Europe Automotive 3PL Industry Revenue (billion) Forecast, by Application 2020 & 2033
- Table 28: Global Automotive 3PL Industry Revenue billion Forecast, by Type 2020 & 2033
- Table 29: Global Automotive 3PL Industry Revenue billion Forecast, by Service 2020 & 2033
- Table 30: Global Automotive 3PL Industry Revenue billion Forecast, by Country 2020 & 2033
- Table 31: Turkey Automotive 3PL Industry Revenue (billion) Forecast, by Application 2020 & 2033
- Table 32: Israel Automotive 3PL Industry Revenue (billion) Forecast, by Application 2020 & 2033
- Table 33: GCC Automotive 3PL Industry Revenue (billion) Forecast, by Application 2020 & 2033
- Table 34: North Africa Automotive 3PL Industry Revenue (billion) Forecast, by Application 2020 & 2033
- Table 35: South Africa Automotive 3PL Industry Revenue (billion) Forecast, by Application 2020 & 2033
- Table 36: Rest of Middle East & Africa Automotive 3PL Industry Revenue (billion) Forecast, by Application 2020 & 2033
- Table 37: Global Automotive 3PL Industry Revenue billion Forecast, by Type 2020 & 2033
- Table 38: Global Automotive 3PL Industry Revenue billion Forecast, by Service 2020 & 2033
- Table 39: Global Automotive 3PL Industry Revenue billion Forecast, by Country 2020 & 2033
- Table 40: China Automotive 3PL Industry Revenue (billion) Forecast, by Application 2020 & 2033
- Table 41: India Automotive 3PL Industry Revenue (billion) Forecast, by Application 2020 & 2033
- Table 42: Japan Automotive 3PL Industry Revenue (billion) Forecast, by Application 2020 & 2033
- Table 43: South Korea Automotive 3PL Industry Revenue (billion) Forecast, by Application 2020 & 2033
- Table 44: ASEAN Automotive 3PL Industry Revenue (billion) Forecast, by Application 2020 & 2033
- Table 45: Oceania Automotive 3PL Industry Revenue (billion) Forecast, by Application 2020 & 2033
- Table 46: Rest of Asia Pacific Automotive 3PL Industry Revenue (billion) Forecast, by Application 2020 & 2033
Frequently Asked Questions
1. What is the projected Compound Annual Growth Rate (CAGR) of the Automotive 3PL Industry?
The projected CAGR is approximately 9.1%.
2. Which companies are prominent players in the Automotive 3PL Industry?
Key companies in the market include DB Schenker, Tiba Group, Hellmann Worldwide Logistics**List Not Exhaustive, Nippon Express, DHL Group, XPO Logistics, CEVA Logistics, GEFCO, Kerry Logistics, DSV.
3. What are the main segments of the Automotive 3PL Industry?
The market segments include Type, Service.
4. Can you provide details about the market size?
The market size is estimated to be USD 1260.98 billion as of 2022.
5. What are some drivers contributing to market growth?
Pharmaceutical Industry Demands Advanced Cold-Chain Services; E-commerce driving the cold chain logistics.
6. What are the notable trends driving market growth?
Increasing partnerships between automotive manufacturers and logistics companies.
7. Are there any restraints impacting market growth?
Damaged Goods; Increasing Transportation Cost.
8. Can you provide examples of recent developments in the market?
January 2023: CEVA Logistics, a member of the CMA CGM group, has successfully acquired GEFCO. As part of this adjustment and its merger with GEFCO, CEVA Logistics has announced the formation of a specific finished vehicle logistics organization.
9. What pricing options are available for accessing the report?
Pricing options include single-user, multi-user, and enterprise licenses priced at USD 3800, USD 4500, and USD 5800 respectively.
10. Is the market size provided in terms of value or volume?
The market size is provided in terms of value, measured in billion.
11. Are there any specific market keywords associated with the report?
Yes, the market keyword associated with the report is "Automotive 3PL Industry," which aids in identifying and referencing the specific market segment covered.
12. How do I determine which pricing option suits my needs best?
The pricing options vary based on user requirements and access needs. Individual users may opt for single-user licenses, while businesses requiring broader access may choose multi-user or enterprise licenses for cost-effective access to the report.
13. Are there any additional resources or data provided in the Automotive 3PL Industry report?
While the report offers comprehensive insights, it's advisable to review the specific contents or supplementary materials provided to ascertain if additional resources or data are available.
14. How can I stay updated on further developments or reports in the Automotive 3PL Industry?
To stay informed about further developments, trends, and reports in the Automotive 3PL Industry, consider subscribing to industry newsletters, following relevant companies and organizations, or regularly checking reputable industry news sources and publications.
Methodology
Step 1 - Identification of Relevant Samples Size from Population Database


Step 2 - Approaches for Defining Global Market Size (Value, Volume* & Price*)

Note*: In applicable scenarios
Step 3 - Data Sources
Primary Research
- Web Analytics
- Survey Reports
- Research Institute
- Latest Research Reports
- Opinion Leaders
Secondary Research
- Annual Reports
- White Paper
- Latest Press Release
- Industry Association
- Paid Database
- Investor Presentations

Step 4 - Data Triangulation
Involves using different sources of information in order to increase the validity of a study
These sources are likely to be stakeholders in a program - participants, other researchers, program staff, other community members, and so on.
Then we put all data in single framework & apply various statistical tools to find out the dynamic on the market.
During the analysis stage, feedback from the stakeholder groups would be compared to determine areas of agreement as well as areas of divergence