
Key Insights
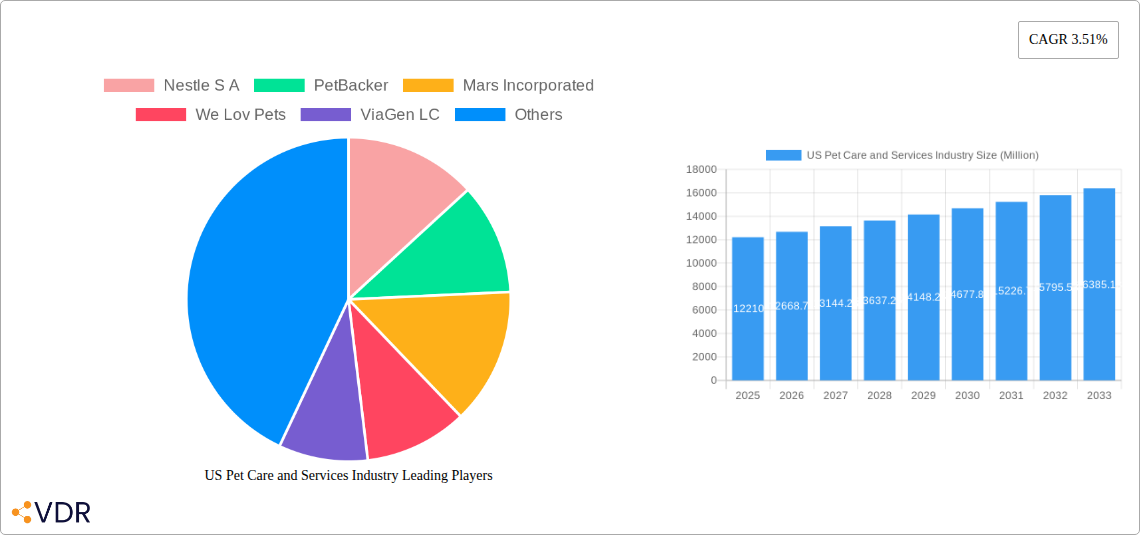
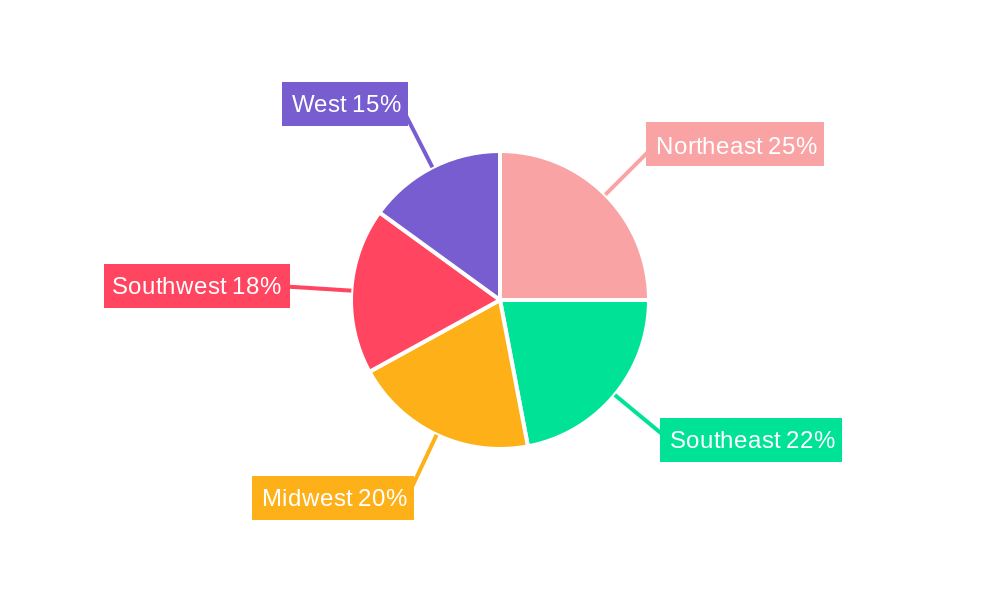
The US pet care and services industry is a robust and expanding market, projected to reach a significant size in the coming years. Driven by increasing pet ownership, humanization of pets, and a rising disposable income among pet owners, the market demonstrates consistent growth. The 3.51% CAGR from 2019-2024 suggests a continued upward trajectory, with the market size in 2025 estimated to be $12.21 billion. This growth is fueled by several key factors, including the increasing demand for premium pet food and specialized grooming services, reflecting a growing willingness to invest in pet health and well-being. Furthermore, the rise of pet-related services such as pet sitting, walking, and transportation caters to the busy lifestyles of many pet owners. Regional variations exist within the US market, with areas like the Northeast and West potentially exhibiting higher growth due to higher pet ownership rates and stronger disposable incomes compared to other regions. The market's segmentation, encompassing various pet types (dogs, cats, horses, and others), product types (food, grooming, other care), and service types (grooming, boarding, sitting, etc.), provides a diverse landscape with substantial opportunities for different players. Competition is fierce, with established players like Nestle S.A. and Mars Incorporated alongside innovative companies like PetBacker and Rover Inc. constantly vying for market share.
The forecast period of 2025-2033 presents significant opportunities for growth and innovation within the industry. The continued focus on premiumization within pet food and the expanding demand for specialized services (such as pet insurance and veterinary telehealth) will be primary drivers. However, the industry also faces challenges such as fluctuating commodity prices, economic downturns, and evolving consumer preferences. Maintaining sustainable practices and offering value-added services will be critical for continued success. Companies need to leverage technological advancements, implement efficient supply chains, and tailor their offerings to the specific needs of different pet owner demographics to secure a strong market position. The focus on enhancing pet wellbeing, incorporating innovative technologies, and providing superior customer service will play a crucial role in the future of this thriving industry.
US Pet Care and Services Industry Market Report: 2019-2033
This comprehensive report provides a detailed analysis of the US pet care and services industry, encompassing market dynamics, growth trends, dominant segments, product landscape, key players, and future outlook. The study period covers 2019-2033, with 2025 as the base and estimated year. This report is invaluable for industry professionals, investors, and anyone seeking to understand this rapidly evolving market.
US Pet Care and Services Industry Market Dynamics & Structure
The US pet care and services industry is characterized by a dynamic interplay of factors influencing its structure and growth. Market concentration is moderate, with a few large players like Nestle S.A. and Mars Incorporated dominating specific segments while numerous smaller businesses cater to niche markets. Technological innovation, particularly in areas like pet health monitoring and personalized nutrition, is a key driver, while regulatory frameworks related to animal welfare and product safety significantly impact operations. The industry faces competition from substitute products and services, with increasing consumer demand pushing for more natural and sustainable options.
- Market Concentration: Moderate, with large players holding significant share in pet food and some services.
- Technological Innovation: Strong driver, with advancements in pet tech, personalized nutrition, and telehealth.
- Regulatory Framework: Stringent regulations on animal welfare, product safety, and labeling.
- Competitive Substitutes: Growing popularity of homemade pet food and alternative services impacting established players.
- End-User Demographics: Increasing pet ownership among millennials and Gen Z, driving demand for premium products and services.
- M&A Trends: Consolidation through acquisitions, reflecting the industry’s maturation and pursuit of economies of scale. xx deals in the historical period.
US Pet Care and Services Industry Growth Trends & Insights
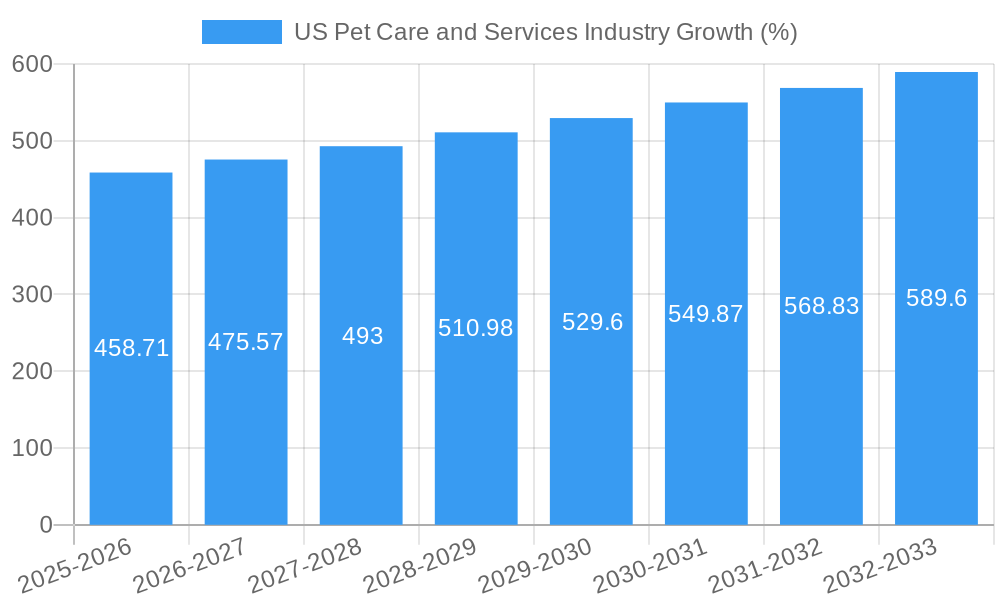
The US pet care and services market exhibited robust growth during the historical period (2019-2024), fueled by increasing pet ownership, rising disposable incomes, and a growing humanization of pets. This trend is projected to continue throughout the forecast period (2025-2033), with a Compound Annual Growth Rate (CAGR) of xx% from 2025-2033. Market penetration for premium pet foods and services is rising, demonstrating a willingness to invest in pet wellness. Technological disruptions, such as AI-powered pet monitoring devices and subscription-based services, are reshaping consumer behavior and driving efficiency. A shift towards personalized nutrition and proactive healthcare for pets, coupled with a rising awareness of pet allergies, is further fueling growth within specific niche segments. The market size is projected to reach xx Million in 2025, and xx Million by 2033.
Dominant Regions, Countries, or Segments in US Pet Care and Services Industry
The US pet care and services market is geographically diverse, but certain segments and regions demonstrate stronger growth. The dog segment is the largest by pet type, followed by the cat segment. Within product types, pet food holds the largest share, driven by increasing demand for premium and specialized diets. In terms of services, pet grooming and pet sitting are leading segments reflecting the evolving needs of pet owners. California, Texas, and Florida are key regions, reflecting higher pet ownership densities and a robust economy.
- By Pet Type: Dogs and cats represent the largest market segments, driven by high pet ownership and spending.
- By Product Type: Pet food continues to dominate, followed by grooming products and pet care items.
- By Service Type: Grooming, pet sitting, and pet walking services are experiencing significant growth.
- Dominant Regions: California, Texas, and Florida represent key markets due to high pet ownership and consumer spending.
US Pet Care and Services Industry Product Landscape
Product innovation is a significant driver of growth in the US pet care industry. New products are focused on addressing specific pet needs, such as hypoallergenic diets, functional treats with added health benefits, and eco-friendly grooming products. Technological advancements in pet food formulations, GPS tracking for pets, and automated feeders are enhancing convenience and improving pet health outcomes. The overall product landscape is characterized by a move towards premiumization, natural ingredients, and customized solutions.
Key Drivers, Barriers & Challenges in US Pet Care and Services Industry
Key Drivers:
- Rising pet ownership, particularly among millennials and Gen Z.
- Increasing disposable incomes enabling higher pet care spending.
- Growing humanization of pets and willingness to invest in their well-being.
- Technological advancements enhancing pet care efficiency and personalization.
Key Challenges and Restraints:
- Supply chain disruptions impacting raw material availability and pricing.
- Stringent regulatory compliance requirements increasing operational costs.
- Intense competition among established and emerging players.
- Economic downturns potentially impacting consumer spending on non-essential pet care items. This could result in a xx% decrease in demand under certain economic scenarios.
Emerging Opportunities in US Pet Care and Services Industry
- Subscription services: Growing demand for convenient and personalized pet care options.
- Pet tech integration: Integration of smart devices and AI into pet care products and services.
- Personalized nutrition: Tailored pet food and supplements to address specific health needs.
- Sustainable and ethical products: Growing consumer demand for environmentally friendly and ethically sourced pet care products.
Growth Accelerators in the US Pet Care and Services Industry Industry
Long-term growth in the US pet care and services industry will be driven by several key factors. Technological innovations in pet healthcare, personalized nutrition, and smart pet devices will create new market segments and improve efficiency. Strategic partnerships between pet care companies and veterinary practices will enhance service offerings and build consumer trust. Expansion into underserved markets, such as rural areas and specific pet demographics, will further contribute to long-term growth.
Key Players Shaping the US Pet Care and Services Industry Market
- Nestle S.A.
- PetBacker
- Mars Incorporated
- We Lov Pets
- ViaGen LC
- Petmate
- Tail Blazers
- PetSmart LLC
- Hill's Pet Nutrition Inc
- Rover Inc
Notable Milestones in US Pet Care and Services Industry Sector
- January 2023: Village Pet Care launched, receiving strategic investment from General Atlantic.
- February 2023: Bark&Spark released a new probiotic chew for dogs.
In-Depth US Pet Care and Services Industry Market Outlook
The future of the US pet care and services industry is bright, with continued growth driven by several factors. The increasing humanization of pets, coupled with technological advancements and a focus on premiumization, will create significant opportunities for innovation and expansion. Strategic partnerships, expansion into new markets, and a focus on sustainable and ethical practices will be key to long-term success. The market is poised for further consolidation, with larger players likely acquiring smaller businesses to enhance their market share and service offerings. The focus on preventative healthcare and personalized pet care will continue to drive growth in the coming years.
US Pet Care and Services Industry Segmentation
-
1. Pet Type
- 1.1. Cat
- 1.2. Dog
- 1.3. Horse
- 1.4. Other Animals
-
2. Product Type
- 2.1. Pet Food
- 2.2. Grooming Products
- 2.3. Pet Care
-
3. Service Type
- 3.1. Grooming
- 3.2. Pet Transportation
- 3.3. Pet Boarding
- 3.4. Pet Sitting
- 3.5. Pet Walking
- 3.6. Other Services
US Pet Care and Services Industry Segmentation By Geography
-
1. North America
- 1.1. United States
- 1.2. Canada
- 1.3. Mexico
-
2. South America
- 2.1. Brazil
- 2.2. Argentina
- 2.3. Rest of South America
-
3. Europe
- 3.1. United Kingdom
- 3.2. Germany
- 3.3. France
- 3.4. Italy
- 3.5. Spain
- 3.6. Russia
- 3.7. Benelux
- 3.8. Nordics
- 3.9. Rest of Europe
-
4. Middle East & Africa
- 4.1. Turkey
- 4.2. Israel
- 4.3. GCC
- 4.4. North Africa
- 4.5. South Africa
- 4.6. Rest of Middle East & Africa
-
5. Asia Pacific
- 5.1. China
- 5.2. India
- 5.3. Japan
- 5.4. South Korea
- 5.5. ASEAN
- 5.6. Oceania
- 5.7. Rest of Asia Pacific
US Pet Care and Services Industry REPORT HIGHLIGHTS
| Aspects | Details |
|---|---|
| Study Period | 2019-2033 |
| Base Year | 2024 |
| Estimated Year | 2025 |
| Forecast Period | 2025-2033 |
| Historical Period | 2019-2024 |
| Growth Rate | CAGR of 3.51% from 2019-2033 |
| Segmentation |
|
Table of Contents
- 1. Introduction
- 1.1. Research Scope
- 1.2. Market Segmentation
- 1.3. Research Methodology
- 1.4. Definitions and Assumptions
- 2. Executive Summary
- 2.1. Introduction
- 3. Market Dynamics
- 3.1. Introduction
- 3.2. Market Drivers
- 3.2.1. Rising Pet Ownership and Pet Insurance; Increased Adoption of Technology for Pet Care
- 3.3. Market Restrains
- 3.3.1. High Cost of Products and Services
- 3.4. Market Trends
- 3.4.1. Dog Segment is Expected to Account for the Large Market Share Over the Forecast Period
- 4. Market Factor Analysis
- 4.1. Porters Five Forces
- 4.2. Supply/Value Chain
- 4.3. PESTEL analysis
- 4.4. Market Entropy
- 4.5. Patent/Trademark Analysis
- 5. Global US Pet Care and Services Industry Analysis, Insights and Forecast, 2019-2031
- 5.1. Market Analysis, Insights and Forecast - by Pet Type
- 5.1.1. Cat
- 5.1.2. Dog
- 5.1.3. Horse
- 5.1.4. Other Animals
- 5.2. Market Analysis, Insights and Forecast - by Product Type
- 5.2.1. Pet Food
- 5.2.2. Grooming Products
- 5.2.3. Pet Care
- 5.3. Market Analysis, Insights and Forecast - by Service Type
- 5.3.1. Grooming
- 5.3.2. Pet Transportation
- 5.3.3. Pet Boarding
- 5.3.4. Pet Sitting
- 5.3.5. Pet Walking
- 5.3.6. Other Services
- 5.4. Market Analysis, Insights and Forecast - by Region
- 5.4.1. North America
- 5.4.2. South America
- 5.4.3. Europe
- 5.4.4. Middle East & Africa
- 5.4.5. Asia Pacific
- 5.1. Market Analysis, Insights and Forecast - by Pet Type
- 6. North America US Pet Care and Services Industry Analysis, Insights and Forecast, 2019-2031
- 6.1. Market Analysis, Insights and Forecast - by Pet Type
- 6.1.1. Cat
- 6.1.2. Dog
- 6.1.3. Horse
- 6.1.4. Other Animals
- 6.2. Market Analysis, Insights and Forecast - by Product Type
- 6.2.1. Pet Food
- 6.2.2. Grooming Products
- 6.2.3. Pet Care
- 6.3. Market Analysis, Insights and Forecast - by Service Type
- 6.3.1. Grooming
- 6.3.2. Pet Transportation
- 6.3.3. Pet Boarding
- 6.3.4. Pet Sitting
- 6.3.5. Pet Walking
- 6.3.6. Other Services
- 6.1. Market Analysis, Insights and Forecast - by Pet Type
- 7. South America US Pet Care and Services Industry Analysis, Insights and Forecast, 2019-2031
- 7.1. Market Analysis, Insights and Forecast - by Pet Type
- 7.1.1. Cat
- 7.1.2. Dog
- 7.1.3. Horse
- 7.1.4. Other Animals
- 7.2. Market Analysis, Insights and Forecast - by Product Type
- 7.2.1. Pet Food
- 7.2.2. Grooming Products
- 7.2.3. Pet Care
- 7.3. Market Analysis, Insights and Forecast - by Service Type
- 7.3.1. Grooming
- 7.3.2. Pet Transportation
- 7.3.3. Pet Boarding
- 7.3.4. Pet Sitting
- 7.3.5. Pet Walking
- 7.3.6. Other Services
- 7.1. Market Analysis, Insights and Forecast - by Pet Type
- 8. Europe US Pet Care and Services Industry Analysis, Insights and Forecast, 2019-2031
- 8.1. Market Analysis, Insights and Forecast - by Pet Type
- 8.1.1. Cat
- 8.1.2. Dog
- 8.1.3. Horse
- 8.1.4. Other Animals
- 8.2. Market Analysis, Insights and Forecast - by Product Type
- 8.2.1. Pet Food
- 8.2.2. Grooming Products
- 8.2.3. Pet Care
- 8.3. Market Analysis, Insights and Forecast - by Service Type
- 8.3.1. Grooming
- 8.3.2. Pet Transportation
- 8.3.3. Pet Boarding
- 8.3.4. Pet Sitting
- 8.3.5. Pet Walking
- 8.3.6. Other Services
- 8.1. Market Analysis, Insights and Forecast - by Pet Type
- 9. Middle East & Africa US Pet Care and Services Industry Analysis, Insights and Forecast, 2019-2031
- 9.1. Market Analysis, Insights and Forecast - by Pet Type
- 9.1.1. Cat
- 9.1.2. Dog
- 9.1.3. Horse
- 9.1.4. Other Animals
- 9.2. Market Analysis, Insights and Forecast - by Product Type
- 9.2.1. Pet Food
- 9.2.2. Grooming Products
- 9.2.3. Pet Care
- 9.3. Market Analysis, Insights and Forecast - by Service Type
- 9.3.1. Grooming
- 9.3.2. Pet Transportation
- 9.3.3. Pet Boarding
- 9.3.4. Pet Sitting
- 9.3.5. Pet Walking
- 9.3.6. Other Services
- 9.1. Market Analysis, Insights and Forecast - by Pet Type
- 10. Asia Pacific US Pet Care and Services Industry Analysis, Insights and Forecast, 2019-2031
- 10.1. Market Analysis, Insights and Forecast - by Pet Type
- 10.1.1. Cat
- 10.1.2. Dog
- 10.1.3. Horse
- 10.1.4. Other Animals
- 10.2. Market Analysis, Insights and Forecast - by Product Type
- 10.2.1. Pet Food
- 10.2.2. Grooming Products
- 10.2.3. Pet Care
- 10.3. Market Analysis, Insights and Forecast - by Service Type
- 10.3.1. Grooming
- 10.3.2. Pet Transportation
- 10.3.3. Pet Boarding
- 10.3.4. Pet Sitting
- 10.3.5. Pet Walking
- 10.3.6. Other Services
- 10.1. Market Analysis, Insights and Forecast - by Pet Type
- 11. Northeast US Pet Care and Services Industry Analysis, Insights and Forecast, 2019-2031
- 12. Southeast US Pet Care and Services Industry Analysis, Insights and Forecast, 2019-2031
- 13. Midwest US Pet Care and Services Industry Analysis, Insights and Forecast, 2019-2031
- 14. Southwest US Pet Care and Services Industry Analysis, Insights and Forecast, 2019-2031
- 15. West US Pet Care and Services Industry Analysis, Insights and Forecast, 2019-2031
- 16. Competitive Analysis
- 16.1. Global Market Share Analysis 2024
- 16.2. Company Profiles
- 16.2.1 Nestle S A
- 16.2.1.1. Overview
- 16.2.1.2. Products
- 16.2.1.3. SWOT Analysis
- 16.2.1.4. Recent Developments
- 16.2.1.5. Financials (Based on Availability)
- 16.2.2 PetBacker
- 16.2.2.1. Overview
- 16.2.2.2. Products
- 16.2.2.3. SWOT Analysis
- 16.2.2.4. Recent Developments
- 16.2.2.5. Financials (Based on Availability)
- 16.2.3 Mars Incorporated
- 16.2.3.1. Overview
- 16.2.3.2. Products
- 16.2.3.3. SWOT Analysis
- 16.2.3.4. Recent Developments
- 16.2.3.5. Financials (Based on Availability)
- 16.2.4 We Lov Pets
- 16.2.4.1. Overview
- 16.2.4.2. Products
- 16.2.4.3. SWOT Analysis
- 16.2.4.4. Recent Developments
- 16.2.4.5. Financials (Based on Availability)
- 16.2.5 ViaGen LC
- 16.2.5.1. Overview
- 16.2.5.2. Products
- 16.2.5.3. SWOT Analysis
- 16.2.5.4. Recent Developments
- 16.2.5.5. Financials (Based on Availability)
- 16.2.6 Petmate
- 16.2.6.1. Overview
- 16.2.6.2. Products
- 16.2.6.3. SWOT Analysis
- 16.2.6.4. Recent Developments
- 16.2.6.5. Financials (Based on Availability)
- 16.2.7 Tail Blazers
- 16.2.7.1. Overview
- 16.2.7.2. Products
- 16.2.7.3. SWOT Analysis
- 16.2.7.4. Recent Developments
- 16.2.7.5. Financials (Based on Availability)
- 16.2.8 PetSmart LLC
- 16.2.8.1. Overview
- 16.2.8.2. Products
- 16.2.8.3. SWOT Analysis
- 16.2.8.4. Recent Developments
- 16.2.8.5. Financials (Based on Availability)
- 16.2.9 Hill's Pet Nutrition Inc
- 16.2.9.1. Overview
- 16.2.9.2. Products
- 16.2.9.3. SWOT Analysis
- 16.2.9.4. Recent Developments
- 16.2.9.5. Financials (Based on Availability)
- 16.2.10 Rover Inc
- 16.2.10.1. Overview
- 16.2.10.2. Products
- 16.2.10.3. SWOT Analysis
- 16.2.10.4. Recent Developments
- 16.2.10.5. Financials (Based on Availability)
- 16.2.1 Nestle S A
List of Figures
- Figure 1: Global US Pet Care and Services Industry Revenue Breakdown (Million, %) by Region 2024 & 2032
- Figure 2: Global US Pet Care and Services Industry Volume Breakdown (K Unit, %) by Region 2024 & 2032
- Figure 3: United states US Pet Care and Services Industry Revenue (Million), by Country 2024 & 2032
- Figure 4: United states US Pet Care and Services Industry Volume (K Unit), by Country 2024 & 2032
- Figure 5: United states US Pet Care and Services Industry Revenue Share (%), by Country 2024 & 2032
- Figure 6: United states US Pet Care and Services Industry Volume Share (%), by Country 2024 & 2032
- Figure 7: North America US Pet Care and Services Industry Revenue (Million), by Pet Type 2024 & 2032
- Figure 8: North America US Pet Care and Services Industry Volume (K Unit), by Pet Type 2024 & 2032
- Figure 9: North America US Pet Care and Services Industry Revenue Share (%), by Pet Type 2024 & 2032
- Figure 10: North America US Pet Care and Services Industry Volume Share (%), by Pet Type 2024 & 2032
- Figure 11: North America US Pet Care and Services Industry Revenue (Million), by Product Type 2024 & 2032
- Figure 12: North America US Pet Care and Services Industry Volume (K Unit), by Product Type 2024 & 2032
- Figure 13: North America US Pet Care and Services Industry Revenue Share (%), by Product Type 2024 & 2032
- Figure 14: North America US Pet Care and Services Industry Volume Share (%), by Product Type 2024 & 2032
- Figure 15: North America US Pet Care and Services Industry Revenue (Million), by Service Type 2024 & 2032
- Figure 16: North America US Pet Care and Services Industry Volume (K Unit), by Service Type 2024 & 2032
- Figure 17: North America US Pet Care and Services Industry Revenue Share (%), by Service Type 2024 & 2032
- Figure 18: North America US Pet Care and Services Industry Volume Share (%), by Service Type 2024 & 2032
- Figure 19: North America US Pet Care and Services Industry Revenue (Million), by Country 2024 & 2032
- Figure 20: North America US Pet Care and Services Industry Volume (K Unit), by Country 2024 & 2032
- Figure 21: North America US Pet Care and Services Industry Revenue Share (%), by Country 2024 & 2032
- Figure 22: North America US Pet Care and Services Industry Volume Share (%), by Country 2024 & 2032
- Figure 23: South America US Pet Care and Services Industry Revenue (Million), by Pet Type 2024 & 2032
- Figure 24: South America US Pet Care and Services Industry Volume (K Unit), by Pet Type 2024 & 2032
- Figure 25: South America US Pet Care and Services Industry Revenue Share (%), by Pet Type 2024 & 2032
- Figure 26: South America US Pet Care and Services Industry Volume Share (%), by Pet Type 2024 & 2032
- Figure 27: South America US Pet Care and Services Industry Revenue (Million), by Product Type 2024 & 2032
- Figure 28: South America US Pet Care and Services Industry Volume (K Unit), by Product Type 2024 & 2032
- Figure 29: South America US Pet Care and Services Industry Revenue Share (%), by Product Type 2024 & 2032
- Figure 30: South America US Pet Care and Services Industry Volume Share (%), by Product Type 2024 & 2032
- Figure 31: South America US Pet Care and Services Industry Revenue (Million), by Service Type 2024 & 2032
- Figure 32: South America US Pet Care and Services Industry Volume (K Unit), by Service Type 2024 & 2032
- Figure 33: South America US Pet Care and Services Industry Revenue Share (%), by Service Type 2024 & 2032
- Figure 34: South America US Pet Care and Services Industry Volume Share (%), by Service Type 2024 & 2032
- Figure 35: South America US Pet Care and Services Industry Revenue (Million), by Country 2024 & 2032
- Figure 36: South America US Pet Care and Services Industry Volume (K Unit), by Country 2024 & 2032
- Figure 37: South America US Pet Care and Services Industry Revenue Share (%), by Country 2024 & 2032
- Figure 38: South America US Pet Care and Services Industry Volume Share (%), by Country 2024 & 2032
- Figure 39: Europe US Pet Care and Services Industry Revenue (Million), by Pet Type 2024 & 2032
- Figure 40: Europe US Pet Care and Services Industry Volume (K Unit), by Pet Type 2024 & 2032
- Figure 41: Europe US Pet Care and Services Industry Revenue Share (%), by Pet Type 2024 & 2032
- Figure 42: Europe US Pet Care and Services Industry Volume Share (%), by Pet Type 2024 & 2032
- Figure 43: Europe US Pet Care and Services Industry Revenue (Million), by Product Type 2024 & 2032
- Figure 44: Europe US Pet Care and Services Industry Volume (K Unit), by Product Type 2024 & 2032
- Figure 45: Europe US Pet Care and Services Industry Revenue Share (%), by Product Type 2024 & 2032
- Figure 46: Europe US Pet Care and Services Industry Volume Share (%), by Product Type 2024 & 2032
- Figure 47: Europe US Pet Care and Services Industry Revenue (Million), by Service Type 2024 & 2032
- Figure 48: Europe US Pet Care and Services Industry Volume (K Unit), by Service Type 2024 & 2032
- Figure 49: Europe US Pet Care and Services Industry Revenue Share (%), by Service Type 2024 & 2032
- Figure 50: Europe US Pet Care and Services Industry Volume Share (%), by Service Type 2024 & 2032
- Figure 51: Europe US Pet Care and Services Industry Revenue (Million), by Country 2024 & 2032
- Figure 52: Europe US Pet Care and Services Industry Volume (K Unit), by Country 2024 & 2032
- Figure 53: Europe US Pet Care and Services Industry Revenue Share (%), by Country 2024 & 2032
- Figure 54: Europe US Pet Care and Services Industry Volume Share (%), by Country 2024 & 2032
- Figure 55: Middle East & Africa US Pet Care and Services Industry Revenue (Million), by Pet Type 2024 & 2032
- Figure 56: Middle East & Africa US Pet Care and Services Industry Volume (K Unit), by Pet Type 2024 & 2032
- Figure 57: Middle East & Africa US Pet Care and Services Industry Revenue Share (%), by Pet Type 2024 & 2032
- Figure 58: Middle East & Africa US Pet Care and Services Industry Volume Share (%), by Pet Type 2024 & 2032
- Figure 59: Middle East & Africa US Pet Care and Services Industry Revenue (Million), by Product Type 2024 & 2032
- Figure 60: Middle East & Africa US Pet Care and Services Industry Volume (K Unit), by Product Type 2024 & 2032
- Figure 61: Middle East & Africa US Pet Care and Services Industry Revenue Share (%), by Product Type 2024 & 2032
- Figure 62: Middle East & Africa US Pet Care and Services Industry Volume Share (%), by Product Type 2024 & 2032
- Figure 63: Middle East & Africa US Pet Care and Services Industry Revenue (Million), by Service Type 2024 & 2032
- Figure 64: Middle East & Africa US Pet Care and Services Industry Volume (K Unit), by Service Type 2024 & 2032
- Figure 65: Middle East & Africa US Pet Care and Services Industry Revenue Share (%), by Service Type 2024 & 2032
- Figure 66: Middle East & Africa US Pet Care and Services Industry Volume Share (%), by Service Type 2024 & 2032
- Figure 67: Middle East & Africa US Pet Care and Services Industry Revenue (Million), by Country 2024 & 2032
- Figure 68: Middle East & Africa US Pet Care and Services Industry Volume (K Unit), by Country 2024 & 2032
- Figure 69: Middle East & Africa US Pet Care and Services Industry Revenue Share (%), by Country 2024 & 2032
- Figure 70: Middle East & Africa US Pet Care and Services Industry Volume Share (%), by Country 2024 & 2032
- Figure 71: Asia Pacific US Pet Care and Services Industry Revenue (Million), by Pet Type 2024 & 2032
- Figure 72: Asia Pacific US Pet Care and Services Industry Volume (K Unit), by Pet Type 2024 & 2032
- Figure 73: Asia Pacific US Pet Care and Services Industry Revenue Share (%), by Pet Type 2024 & 2032
- Figure 74: Asia Pacific US Pet Care and Services Industry Volume Share (%), by Pet Type 2024 & 2032
- Figure 75: Asia Pacific US Pet Care and Services Industry Revenue (Million), by Product Type 2024 & 2032
- Figure 76: Asia Pacific US Pet Care and Services Industry Volume (K Unit), by Product Type 2024 & 2032
- Figure 77: Asia Pacific US Pet Care and Services Industry Revenue Share (%), by Product Type 2024 & 2032
- Figure 78: Asia Pacific US Pet Care and Services Industry Volume Share (%), by Product Type 2024 & 2032
- Figure 79: Asia Pacific US Pet Care and Services Industry Revenue (Million), by Service Type 2024 & 2032
- Figure 80: Asia Pacific US Pet Care and Services Industry Volume (K Unit), by Service Type 2024 & 2032
- Figure 81: Asia Pacific US Pet Care and Services Industry Revenue Share (%), by Service Type 2024 & 2032
- Figure 82: Asia Pacific US Pet Care and Services Industry Volume Share (%), by Service Type 2024 & 2032
- Figure 83: Asia Pacific US Pet Care and Services Industry Revenue (Million), by Country 2024 & 2032
- Figure 84: Asia Pacific US Pet Care and Services Industry Volume (K Unit), by Country 2024 & 2032
- Figure 85: Asia Pacific US Pet Care and Services Industry Revenue Share (%), by Country 2024 & 2032
- Figure 86: Asia Pacific US Pet Care and Services Industry Volume Share (%), by Country 2024 & 2032
List of Tables
- Table 1: Global US Pet Care and Services Industry Revenue Million Forecast, by Region 2019 & 2032
- Table 2: Global US Pet Care and Services Industry Volume K Unit Forecast, by Region 2019 & 2032
- Table 3: Global US Pet Care and Services Industry Revenue Million Forecast, by Pet Type 2019 & 2032
- Table 4: Global US Pet Care and Services Industry Volume K Unit Forecast, by Pet Type 2019 & 2032
- Table 5: Global US Pet Care and Services Industry Revenue Million Forecast, by Product Type 2019 & 2032
- Table 6: Global US Pet Care and Services Industry Volume K Unit Forecast, by Product Type 2019 & 2032
- Table 7: Global US Pet Care and Services Industry Revenue Million Forecast, by Service Type 2019 & 2032
- Table 8: Global US Pet Care and Services Industry Volume K Unit Forecast, by Service Type 2019 & 2032
- Table 9: Global US Pet Care and Services Industry Revenue Million Forecast, by Region 2019 & 2032
- Table 10: Global US Pet Care and Services Industry Volume K Unit Forecast, by Region 2019 & 2032
- Table 11: Global US Pet Care and Services Industry Revenue Million Forecast, by Country 2019 & 2032
- Table 12: Global US Pet Care and Services Industry Volume K Unit Forecast, by Country 2019 & 2032
- Table 13: Northeast US Pet Care and Services Industry Revenue (Million) Forecast, by Application 2019 & 2032
- Table 14: Northeast US Pet Care and Services Industry Volume (K Unit) Forecast, by Application 2019 & 2032
- Table 15: Southeast US Pet Care and Services Industry Revenue (Million) Forecast, by Application 2019 & 2032
- Table 16: Southeast US Pet Care and Services Industry Volume (K Unit) Forecast, by Application 2019 & 2032
- Table 17: Midwest US Pet Care and Services Industry Revenue (Million) Forecast, by Application 2019 & 2032
- Table 18: Midwest US Pet Care and Services Industry Volume (K Unit) Forecast, by Application 2019 & 2032
- Table 19: Southwest US Pet Care and Services Industry Revenue (Million) Forecast, by Application 2019 & 2032
- Table 20: Southwest US Pet Care and Services Industry Volume (K Unit) Forecast, by Application 2019 & 2032
- Table 21: West US Pet Care and Services Industry Revenue (Million) Forecast, by Application 2019 & 2032
- Table 22: West US Pet Care and Services Industry Volume (K Unit) Forecast, by Application 2019 & 2032
- Table 23: Global US Pet Care and Services Industry Revenue Million Forecast, by Pet Type 2019 & 2032
- Table 24: Global US Pet Care and Services Industry Volume K Unit Forecast, by Pet Type 2019 & 2032
- Table 25: Global US Pet Care and Services Industry Revenue Million Forecast, by Product Type 2019 & 2032
- Table 26: Global US Pet Care and Services Industry Volume K Unit Forecast, by Product Type 2019 & 2032
- Table 27: Global US Pet Care and Services Industry Revenue Million Forecast, by Service Type 2019 & 2032
- Table 28: Global US Pet Care and Services Industry Volume K Unit Forecast, by Service Type 2019 & 2032
- Table 29: Global US Pet Care and Services Industry Revenue Million Forecast, by Country 2019 & 2032
- Table 30: Global US Pet Care and Services Industry Volume K Unit Forecast, by Country 2019 & 2032
- Table 31: United States US Pet Care and Services Industry Revenue (Million) Forecast, by Application 2019 & 2032
- Table 32: United States US Pet Care and Services Industry Volume (K Unit) Forecast, by Application 2019 & 2032
- Table 33: Canada US Pet Care and Services Industry Revenue (Million) Forecast, by Application 2019 & 2032
- Table 34: Canada US Pet Care and Services Industry Volume (K Unit) Forecast, by Application 2019 & 2032
- Table 35: Mexico US Pet Care and Services Industry Revenue (Million) Forecast, by Application 2019 & 2032
- Table 36: Mexico US Pet Care and Services Industry Volume (K Unit) Forecast, by Application 2019 & 2032
- Table 37: Global US Pet Care and Services Industry Revenue Million Forecast, by Pet Type 2019 & 2032
- Table 38: Global US Pet Care and Services Industry Volume K Unit Forecast, by Pet Type 2019 & 2032
- Table 39: Global US Pet Care and Services Industry Revenue Million Forecast, by Product Type 2019 & 2032
- Table 40: Global US Pet Care and Services Industry Volume K Unit Forecast, by Product Type 2019 & 2032
- Table 41: Global US Pet Care and Services Industry Revenue Million Forecast, by Service Type 2019 & 2032
- Table 42: Global US Pet Care and Services Industry Volume K Unit Forecast, by Service Type 2019 & 2032
- Table 43: Global US Pet Care and Services Industry Revenue Million Forecast, by Country 2019 & 2032
- Table 44: Global US Pet Care and Services Industry Volume K Unit Forecast, by Country 2019 & 2032
- Table 45: Brazil US Pet Care and Services Industry Revenue (Million) Forecast, by Application 2019 & 2032
- Table 46: Brazil US Pet Care and Services Industry Volume (K Unit) Forecast, by Application 2019 & 2032
- Table 47: Argentina US Pet Care and Services Industry Revenue (Million) Forecast, by Application 2019 & 2032
- Table 48: Argentina US Pet Care and Services Industry Volume (K Unit) Forecast, by Application 2019 & 2032
- Table 49: Rest of South America US Pet Care and Services Industry Revenue (Million) Forecast, by Application 2019 & 2032
- Table 50: Rest of South America US Pet Care and Services Industry Volume (K Unit) Forecast, by Application 2019 & 2032
- Table 51: Global US Pet Care and Services Industry Revenue Million Forecast, by Pet Type 2019 & 2032
- Table 52: Global US Pet Care and Services Industry Volume K Unit Forecast, by Pet Type 2019 & 2032
- Table 53: Global US Pet Care and Services Industry Revenue Million Forecast, by Product Type 2019 & 2032
- Table 54: Global US Pet Care and Services Industry Volume K Unit Forecast, by Product Type 2019 & 2032
- Table 55: Global US Pet Care and Services Industry Revenue Million Forecast, by Service Type 2019 & 2032
- Table 56: Global US Pet Care and Services Industry Volume K Unit Forecast, by Service Type 2019 & 2032
- Table 57: Global US Pet Care and Services Industry Revenue Million Forecast, by Country 2019 & 2032
- Table 58: Global US Pet Care and Services Industry Volume K Unit Forecast, by Country 2019 & 2032
- Table 59: United Kingdom US Pet Care and Services Industry Revenue (Million) Forecast, by Application 2019 & 2032
- Table 60: United Kingdom US Pet Care and Services Industry Volume (K Unit) Forecast, by Application 2019 & 2032
- Table 61: Germany US Pet Care and Services Industry Revenue (Million) Forecast, by Application 2019 & 2032
- Table 62: Germany US Pet Care and Services Industry Volume (K Unit) Forecast, by Application 2019 & 2032
- Table 63: France US Pet Care and Services Industry Revenue (Million) Forecast, by Application 2019 & 2032
- Table 64: France US Pet Care and Services Industry Volume (K Unit) Forecast, by Application 2019 & 2032
- Table 65: Italy US Pet Care and Services Industry Revenue (Million) Forecast, by Application 2019 & 2032
- Table 66: Italy US Pet Care and Services Industry Volume (K Unit) Forecast, by Application 2019 & 2032
- Table 67: Spain US Pet Care and Services Industry Revenue (Million) Forecast, by Application 2019 & 2032
- Table 68: Spain US Pet Care and Services Industry Volume (K Unit) Forecast, by Application 2019 & 2032
- Table 69: Russia US Pet Care and Services Industry Revenue (Million) Forecast, by Application 2019 & 2032
- Table 70: Russia US Pet Care and Services Industry Volume (K Unit) Forecast, by Application 2019 & 2032
- Table 71: Benelux US Pet Care and Services Industry Revenue (Million) Forecast, by Application 2019 & 2032
- Table 72: Benelux US Pet Care and Services Industry Volume (K Unit) Forecast, by Application 2019 & 2032
- Table 73: Nordics US Pet Care and Services Industry Revenue (Million) Forecast, by Application 2019 & 2032
- Table 74: Nordics US Pet Care and Services Industry Volume (K Unit) Forecast, by Application 2019 & 2032
- Table 75: Rest of Europe US Pet Care and Services Industry Revenue (Million) Forecast, by Application 2019 & 2032
- Table 76: Rest of Europe US Pet Care and Services Industry Volume (K Unit) Forecast, by Application 2019 & 2032
- Table 77: Global US Pet Care and Services Industry Revenue Million Forecast, by Pet Type 2019 & 2032
- Table 78: Global US Pet Care and Services Industry Volume K Unit Forecast, by Pet Type 2019 & 2032
- Table 79: Global US Pet Care and Services Industry Revenue Million Forecast, by Product Type 2019 & 2032
- Table 80: Global US Pet Care and Services Industry Volume K Unit Forecast, by Product Type 2019 & 2032
- Table 81: Global US Pet Care and Services Industry Revenue Million Forecast, by Service Type 2019 & 2032
- Table 82: Global US Pet Care and Services Industry Volume K Unit Forecast, by Service Type 2019 & 2032
- Table 83: Global US Pet Care and Services Industry Revenue Million Forecast, by Country 2019 & 2032
- Table 84: Global US Pet Care and Services Industry Volume K Unit Forecast, by Country 2019 & 2032
- Table 85: Turkey US Pet Care and Services Industry Revenue (Million) Forecast, by Application 2019 & 2032
- Table 86: Turkey US Pet Care and Services Industry Volume (K Unit) Forecast, by Application 2019 & 2032
- Table 87: Israel US Pet Care and Services Industry Revenue (Million) Forecast, by Application 2019 & 2032
- Table 88: Israel US Pet Care and Services Industry Volume (K Unit) Forecast, by Application 2019 & 2032
- Table 89: GCC US Pet Care and Services Industry Revenue (Million) Forecast, by Application 2019 & 2032
- Table 90: GCC US Pet Care and Services Industry Volume (K Unit) Forecast, by Application 2019 & 2032
- Table 91: North Africa US Pet Care and Services Industry Revenue (Million) Forecast, by Application 2019 & 2032
- Table 92: North Africa US Pet Care and Services Industry Volume (K Unit) Forecast, by Application 2019 & 2032
- Table 93: South Africa US Pet Care and Services Industry Revenue (Million) Forecast, by Application 2019 & 2032
- Table 94: South Africa US Pet Care and Services Industry Volume (K Unit) Forecast, by Application 2019 & 2032
- Table 95: Rest of Middle East & Africa US Pet Care and Services Industry Revenue (Million) Forecast, by Application 2019 & 2032
- Table 96: Rest of Middle East & Africa US Pet Care and Services Industry Volume (K Unit) Forecast, by Application 2019 & 2032
- Table 97: Global US Pet Care and Services Industry Revenue Million Forecast, by Pet Type 2019 & 2032
- Table 98: Global US Pet Care and Services Industry Volume K Unit Forecast, by Pet Type 2019 & 2032
- Table 99: Global US Pet Care and Services Industry Revenue Million Forecast, by Product Type 2019 & 2032
- Table 100: Global US Pet Care and Services Industry Volume K Unit Forecast, by Product Type 2019 & 2032
- Table 101: Global US Pet Care and Services Industry Revenue Million Forecast, by Service Type 2019 & 2032
- Table 102: Global US Pet Care and Services Industry Volume K Unit Forecast, by Service Type 2019 & 2032
- Table 103: Global US Pet Care and Services Industry Revenue Million Forecast, by Country 2019 & 2032
- Table 104: Global US Pet Care and Services Industry Volume K Unit Forecast, by Country 2019 & 2032
- Table 105: China US Pet Care and Services Industry Revenue (Million) Forecast, by Application 2019 & 2032
- Table 106: China US Pet Care and Services Industry Volume (K Unit) Forecast, by Application 2019 & 2032
- Table 107: India US Pet Care and Services Industry Revenue (Million) Forecast, by Application 2019 & 2032
- Table 108: India US Pet Care and Services Industry Volume (K Unit) Forecast, by Application 2019 & 2032
- Table 109: Japan US Pet Care and Services Industry Revenue (Million) Forecast, by Application 2019 & 2032
- Table 110: Japan US Pet Care and Services Industry Volume (K Unit) Forecast, by Application 2019 & 2032
- Table 111: South Korea US Pet Care and Services Industry Revenue (Million) Forecast, by Application 2019 & 2032
- Table 112: South Korea US Pet Care and Services Industry Volume (K Unit) Forecast, by Application 2019 & 2032
- Table 113: ASEAN US Pet Care and Services Industry Revenue (Million) Forecast, by Application 2019 & 2032
- Table 114: ASEAN US Pet Care and Services Industry Volume (K Unit) Forecast, by Application 2019 & 2032
- Table 115: Oceania US Pet Care and Services Industry Revenue (Million) Forecast, by Application 2019 & 2032
- Table 116: Oceania US Pet Care and Services Industry Volume (K Unit) Forecast, by Application 2019 & 2032
- Table 117: Rest of Asia Pacific US Pet Care and Services Industry Revenue (Million) Forecast, by Application 2019 & 2032
- Table 118: Rest of Asia Pacific US Pet Care and Services Industry Volume (K Unit) Forecast, by Application 2019 & 2032
Frequently Asked Questions
1. What is the projected Compound Annual Growth Rate (CAGR) of the US Pet Care and Services Industry?
The projected CAGR is approximately 3.51%.
2. Which companies are prominent players in the US Pet Care and Services Industry?
Key companies in the market include Nestle S A, PetBacker, Mars Incorporated, We Lov Pets, ViaGen LC, Petmate, Tail Blazers, PetSmart LLC, Hill's Pet Nutrition Inc, Rover Inc.
3. What are the main segments of the US Pet Care and Services Industry?
The market segments include Pet Type , Product Type, Service Type.
4. Can you provide details about the market size?
The market size is estimated to be USD 12.21 Million as of 2022.
5. What are some drivers contributing to market growth?
Rising Pet Ownership and Pet Insurance; Increased Adoption of Technology for Pet Care.
6. What are the notable trends driving market growth?
Dog Segment is Expected to Account for the Large Market Share Over the Forecast Period.
7. Are there any restraints impacting market growth?
High Cost of Products and Services.
8. Can you provide examples of recent developments in the market?
February 2023: Bark&Spark released a new Probiotic Chew for Dogs. Bark&Spark's chews are touted as perfectly dosed and compatible with any dog's diet, with just a few chews a day giving the desired effects.
9. What pricing options are available for accessing the report?
Pricing options include single-user, multi-user, and enterprise licenses priced at USD 3800, USD 4500, and USD 5800 respectively.
10. Is the market size provided in terms of value or volume?
The market size is provided in terms of value, measured in Million and volume, measured in K Unit.
11. Are there any specific market keywords associated with the report?
Yes, the market keyword associated with the report is "US Pet Care and Services Industry," which aids in identifying and referencing the specific market segment covered.
12. How do I determine which pricing option suits my needs best?
The pricing options vary based on user requirements and access needs. Individual users may opt for single-user licenses, while businesses requiring broader access may choose multi-user or enterprise licenses for cost-effective access to the report.
13. Are there any additional resources or data provided in the US Pet Care and Services Industry report?
While the report offers comprehensive insights, it's advisable to review the specific contents or supplementary materials provided to ascertain if additional resources or data are available.
14. How can I stay updated on further developments or reports in the US Pet Care and Services Industry?
To stay informed about further developments, trends, and reports in the US Pet Care and Services Industry, consider subscribing to industry newsletters, following relevant companies and organizations, or regularly checking reputable industry news sources and publications.
Methodology
Step 1 - Identification of Relevant Samples Size from Population Database


Step 2 - Approaches for Defining Global Market Size (Value, Volume* & Price*)

Note*: In applicable scenarios
Step 3 - Data Sources
Primary Research
- Web Analytics
- Survey Reports
- Research Institute
- Latest Research Reports
- Opinion Leaders
Secondary Research
- Annual Reports
- White Paper
- Latest Press Release
- Industry Association
- Paid Database
- Investor Presentations

Step 4 - Data Triangulation
Involves using different sources of information in order to increase the validity of a study
These sources are likely to be stakeholders in a program - participants, other researchers, program staff, other community members, and so on.
Then we put all data in single framework & apply various statistical tools to find out the dynamic on the market.
During the analysis stage, feedback from the stakeholder groups would be compared to determine areas of agreement as well as areas of divergence


