
Key Insights
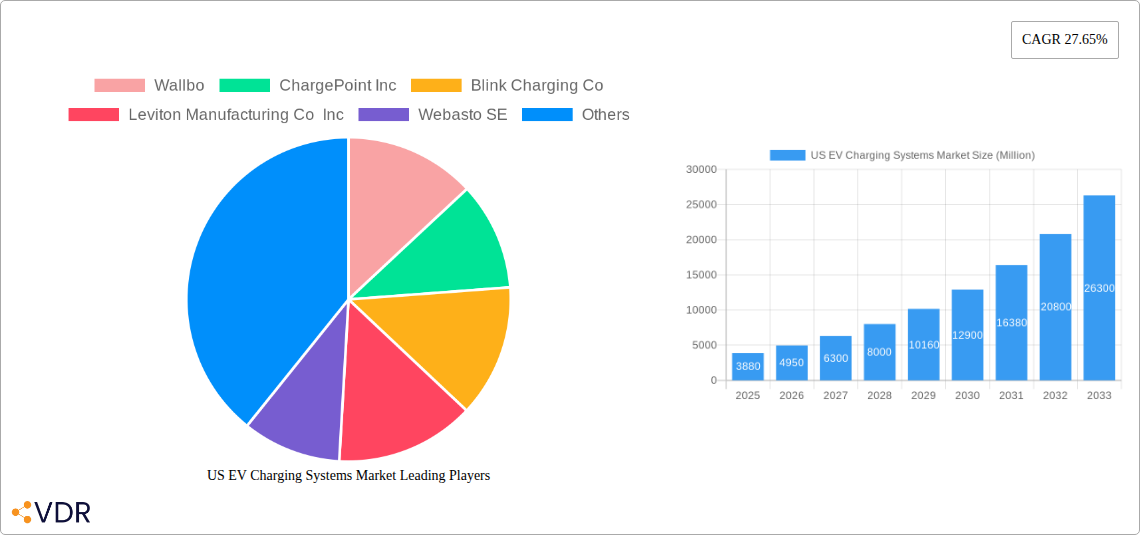
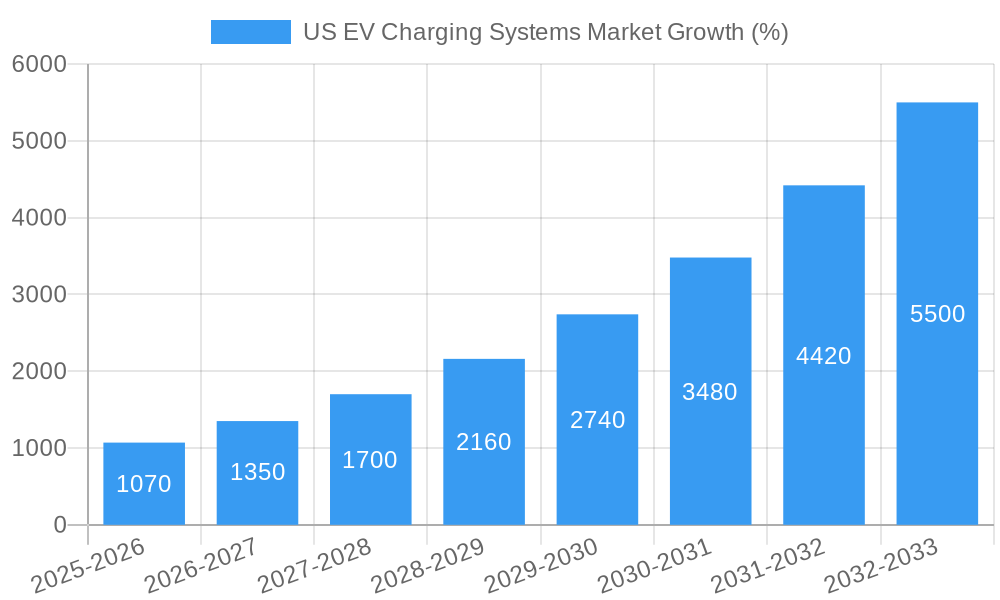
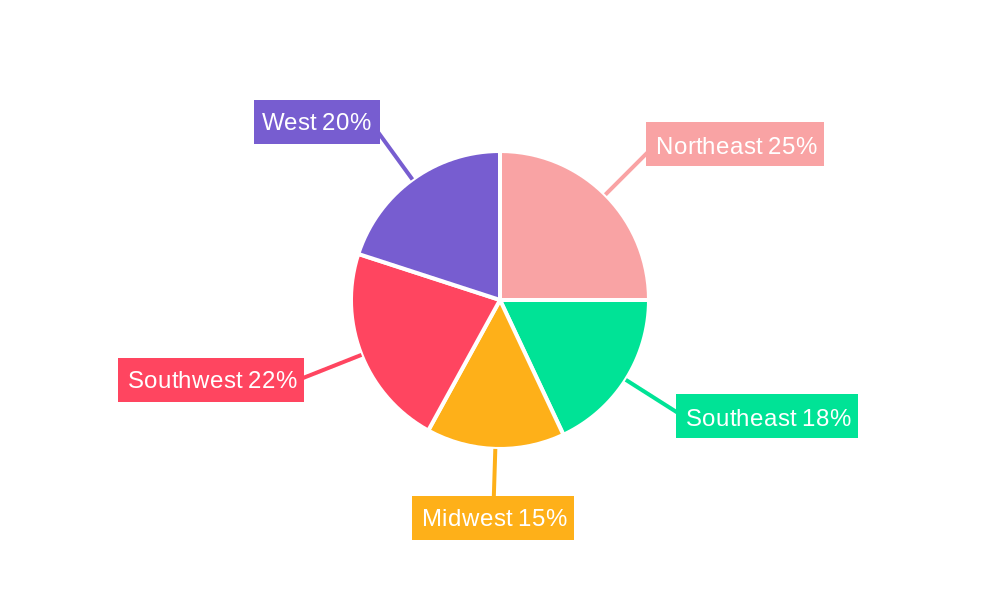
The US EV charging systems market is experiencing robust growth, driven by the increasing adoption of electric vehicles (EVs) and supportive government policies aimed at reducing carbon emissions. The market, valued at $3.88 billion in 2025, is projected to expand significantly over the forecast period (2025-2033), exhibiting a Compound Annual Growth Rate (CAGR) of 27.65%. This surge is fueled by several key factors. Firstly, the expanding EV fleet necessitates a parallel increase in charging infrastructure. Secondly, advancements in charging technology, including the rise of faster charging solutions like rapid charging systems, are attracting more users. Thirdly, private sector investments in charging stations, both residential and commercial, are playing a crucial role in market expansion. Furthermore, government incentives and regulations promoting EV adoption indirectly stimulate the demand for charging systems. Regional variations exist, with states like California and those in the Northeast likely leading the market due to higher EV penetration and stringent environmental regulations. However, the Midwest and South are expected to witness significant growth as EV adoption increases in these regions. The market is segmented by application type (public, private), equipment type (charging stations, inverters, chargers), vehicle type (passenger cars, commercial vehicles), and charging system type (slow, fast, rapid). Competition is fierce, with established players like ChargePoint, Blink Charging, and Tesla alongside other prominent companies actively vying for market share through innovation and strategic partnerships.
The market's growth trajectory is not without its challenges. The high initial investment costs associated with installing charging infrastructure can serve as a significant barrier, especially for private sector deployments. Furthermore, the uneven distribution of charging stations across different geographical areas and concerns regarding grid capacity limitations pose potential restraints. However, ongoing technological advancements, decreasing battery costs, and improvements in grid infrastructure are expected to mitigate these challenges in the coming years. The market is poised for sustained expansion as the transition to electric mobility accelerates, driven by both consumer demand and governmental initiatives. The ongoing development of innovative charging solutions, such as wireless charging and vehicle-to-grid (V2G) technology, are also expected to contribute to future market growth.
US EV Charging Systems Market: A Comprehensive Report (2019-2033)
This in-depth report provides a comprehensive analysis of the US EV charging systems market, encompassing market dynamics, growth trends, key players, and future outlook. With a detailed examination of market segments—by application type (public, private residential, and commercial), equipment type (pillar/charging station/dock, inverter, charger, DC charger, and others), vehicle type (passenger cars and commercial vehicles), and charging system type (slow, fast, and rapid)—this report is an invaluable resource for industry professionals, investors, and strategic decision-makers. The report covers the period 2019-2033, with a base year of 2025 and a forecast period of 2025-2033. Market values are presented in million USD.
US EV Charging Systems Market Dynamics & Structure
The US EV charging systems market is experiencing robust growth, driven by increasing EV adoption, supportive government policies, and technological advancements. Market concentration is moderate, with several key players vying for market share. Technological innovation is a significant driver, with ongoing developments in fast-charging technologies, smart charging solutions, and grid integration capabilities. Regulatory frameworks, including federal and state-level incentives and mandates, are playing a crucial role in shaping market growth. Competition from alternative fuel infrastructure is relatively low, given the increasing dominance of EVs. The end-user demographics are expanding beyond early adopters to encompass a broader range of consumers and businesses. M&A activity is noteworthy, indicating consolidation and strategic expansion within the sector. The total market size in 2025 is estimated at xx million units, with a projected CAGR of xx% during the forecast period.
- Market Concentration: Moderate, with top 5 players holding approximately xx% market share in 2025.
- Technological Innovation: Focus on increased charging speeds, smart grid integration, and improved reliability.
- Regulatory Frameworks: Federal and state incentives, mandates for charging infrastructure deployment, and grid modernization initiatives are key drivers.
- Competitive Substitutes: Limited direct competition from alternative fuel infrastructure.
- End-User Demographics: Shifting from early adopters to mass market adoption across residential, commercial, and public sectors.
- M&A Trends: Increasing consolidation through mergers and acquisitions amongst charging network operators and technology providers. An estimated xx M&A deals occurred between 2019 and 2024.
US EV Charging Systems Market Growth Trends & Insights
The US EV charging systems market has witnessed substantial growth from 2019 to 2024, driven by factors such as rising EV sales, government initiatives promoting EV adoption, and improvements in charging infrastructure. The market experienced a CAGR of xx% during the historical period. Technological advancements, including the introduction of faster charging technologies and smart charging solutions, have further accelerated market growth. Consumer behavior is shifting towards greater acceptance and adoption of EVs, fueled by environmental concerns and decreasing battery costs. The market is expected to continue its robust growth trajectory during the forecast period (2025-2033), with a projected CAGR of xx%, driven by government investments and increasing demand. Market penetration is currently at xx% and is expected to reach xx% by 2033. Key factors driving growth include increased consumer awareness, reduced charging times, and the expanding availability of public charging stations. This surge is further bolstered by growing concerns about climate change and the associated push towards carbon-neutral transportation.
Dominant Regions, Countries, or Segments in US EV Charging Systems Market
California, Texas, and New York are currently the leading states in terms of EV charging infrastructure deployment and market size. The private sector (residential and commercial) segment holds the largest market share due to the rising number of EV owners and businesses investing in on-site charging solutions. Among equipment types, Pillar/Charging Station/Dock segment dominates, while within charging system types, fast and rapid charging systems show the highest growth potential. Passenger cars currently represent the largest segment of EV vehicle types utilizing charging systems. The dominance of these segments is driven by several factors including:
- California: Strong state-level policies, high EV adoption rates, and significant investment in charging infrastructure.
- Texas: Large population, expanding commercial sector, and significant government investments.
- Private Sector (Residential and Commercial): Convenience, cost savings, and increased vehicle range.
- Pillar/Charging Station/Dock: Wider availability, cost-effectiveness, and suitability for diverse applications.
- Fast and Rapid Charging Systems: Reduced charging time, attracting a broader user base and enabling longer-distance travel.
- Passenger Cars: High sales volume, leading to a larger demand for charging infrastructure.
US EV Charging Systems Market Product Landscape
The US EV charging systems market offers a diverse range of products, from Level 1 and Level 2 home chargers to DC fast chargers capable of providing significant range in minimal charging time. Innovations focus on improving charging speeds, enhancing reliability, integrating smart functionalities (such as energy management and remote monitoring), and implementing advanced safety features. Many chargers now offer mobile applications for remote control and monitoring, and several manufacturers are focusing on seamless integration with smart home systems. Key performance metrics include charging speed (kW), charging efficiency, reliability, and ease of use.
Key Drivers, Barriers & Challenges in US EV Charging Systems Market
Key Drivers: Government incentives (e.g., the USD 5 billion NEVI program and state-level grants), rising EV sales, growing environmental awareness, and technological advancements (faster charging speeds and improved energy efficiency).
Key Challenges: High initial investment costs for infrastructure deployment, uneven geographical distribution of charging stations, range anxiety among consumers, grid capacity constraints, and the need for standardized charging technologies. Supply chain disruptions related to raw materials and components can also impact the market.
Emerging Opportunities in US EV Charging Systems Market
Emerging opportunities lie in the expansion of charging infrastructure in underserved areas, development of vehicle-to-grid (V2G) technologies, integration of renewable energy sources into charging networks, and the growth of subscription-based charging services. The increasing adoption of commercial EVs is also creating new opportunities in fleet charging solutions and optimized charging management systems.
Growth Accelerators in the US EV Charging Systems Market Industry
Significant growth acceleration is expected from continued technological innovation, strategic partnerships between charging companies and energy providers, and expansion into new markets. The integration of smart grid technologies, enabling optimized energy distribution and demand response, will play a vital role.
Key Players Shaping the US EV Charging Systems Market Market
- Wallbox
- ChargePoint Inc
- Blink Charging Co
- Leviton Manufacturing Co Inc
- Webasto SE
- Siemens AG
- Schneider Electric SE
- ABB Group
- Tesla Inc
- EVBox Group
- EvoCharge Inc
- Eaton Corporation
Notable Milestones in US EV Charging Systems Market Sector
- March 2024: Wallbox announces the launch of Pulsar Pro North America and Supernova 180 DC fast charger.
- January 2024: The US government announces a USD 623 million investment in EV charging infrastructure.
- January 2024: The US Transportation Department announces USD 148.8 million to replace/repair 4,500 EV charging stations.
In-Depth US EV Charging Systems Market Market Outlook
The US EV charging systems market presents significant long-term growth potential driven by expanding EV adoption, increasing government support, and ongoing technological advancements. Strategic opportunities exist for companies focusing on innovative charging technologies, smart grid integration, and expansion into underserved markets. The market's continued growth hinges on overcoming challenges related to infrastructure deployment, cost reduction, and addressing consumer concerns about range and charging convenience. The future landscape will likely see increased consolidation, strategic partnerships, and a greater focus on sustainable and intelligent charging solutions.
US EV Charging Systems Market Segmentation
-
1. Application Type
- 1.1. Public
- 1.2. Private (Residential and Commercial)
-
2. Equipment Type
- 2.1. Pillar/Charging Station/Dock
- 2.2. Inverter
-
2.3. Charger
- 2.3.1. AC Charger
- 2.3.2. DC Charger
- 2.4. Others (Cord, Port, etc.)
-
3. Vehicle Type
- 3.1. Passenger Cars
- 3.2. Commercial Vehicles
-
4. Charging System Type
- 4.1. Slow Charging Systems
- 4.2. Fast Charging Systems
- 4.3. Rapid Charging Systems
US EV Charging Systems Market Segmentation By Geography
-
1. North America
- 1.1. United States
- 1.2. Canada
- 1.3. Mexico
-
2. South America
- 2.1. Brazil
- 2.2. Argentina
- 2.3. Rest of South America
-
3. Europe
- 3.1. United Kingdom
- 3.2. Germany
- 3.3. France
- 3.4. Italy
- 3.5. Spain
- 3.6. Russia
- 3.7. Benelux
- 3.8. Nordics
- 3.9. Rest of Europe
-
4. Middle East & Africa
- 4.1. Turkey
- 4.2. Israel
- 4.3. GCC
- 4.4. North Africa
- 4.5. South Africa
- 4.6. Rest of Middle East & Africa
-
5. Asia Pacific
- 5.1. China
- 5.2. India
- 5.3. Japan
- 5.4. South Korea
- 5.5. ASEAN
- 5.6. Oceania
- 5.7. Rest of Asia Pacific
US EV Charging Systems Market REPORT HIGHLIGHTS
| Aspects | Details |
|---|---|
| Study Period | 2019-2033 |
| Base Year | 2024 |
| Estimated Year | 2025 |
| Forecast Period | 2025-2033 |
| Historical Period | 2019-2024 |
| Growth Rate | CAGR of 27.65% from 2019-2033 |
| Segmentation |
|
Table of Contents
- 1. Introduction
- 1.1. Research Scope
- 1.2. Market Segmentation
- 1.3. Research Methodology
- 1.4. Definitions and Assumptions
- 2. Executive Summary
- 2.1. Introduction
- 3. Market Dynamics
- 3.1. Introduction
- 3.2. Market Drivers
- 3.2.1. Aggressive Government Focus to Promote the Adoption of Electric Vehicles Fosters the Growth of the Market
- 3.3. Market Restrains
- 3.3.1. High Cost of Setting Up EV Charging Stations Hampers the Growth of the Market
- 3.4. Market Trends
- 3.4.1. Passengers Cars Segment to Gain Traction during the Forecast Period
- 4. Market Factor Analysis
- 4.1. Porters Five Forces
- 4.2. Supply/Value Chain
- 4.3. PESTEL analysis
- 4.4. Market Entropy
- 4.5. Patent/Trademark Analysis
- 5. Global US EV Charging Systems Market Analysis, Insights and Forecast, 2019-2031
- 5.1. Market Analysis, Insights and Forecast - by Application Type
- 5.1.1. Public
- 5.1.2. Private (Residential and Commercial)
- 5.2. Market Analysis, Insights and Forecast - by Equipment Type
- 5.2.1. Pillar/Charging Station/Dock
- 5.2.2. Inverter
- 5.2.3. Charger
- 5.2.3.1. AC Charger
- 5.2.3.2. DC Charger
- 5.2.4. Others (Cord, Port, etc.)
- 5.3. Market Analysis, Insights and Forecast - by Vehicle Type
- 5.3.1. Passenger Cars
- 5.3.2. Commercial Vehicles
- 5.4. Market Analysis, Insights and Forecast - by Charging System Type
- 5.4.1. Slow Charging Systems
- 5.4.2. Fast Charging Systems
- 5.4.3. Rapid Charging Systems
- 5.5. Market Analysis, Insights and Forecast - by Region
- 5.5.1. North America
- 5.5.2. South America
- 5.5.3. Europe
- 5.5.4. Middle East & Africa
- 5.5.5. Asia Pacific
- 5.1. Market Analysis, Insights and Forecast - by Application Type
- 6. North America US EV Charging Systems Market Analysis, Insights and Forecast, 2019-2031
- 6.1. Market Analysis, Insights and Forecast - by Application Type
- 6.1.1. Public
- 6.1.2. Private (Residential and Commercial)
- 6.2. Market Analysis, Insights and Forecast - by Equipment Type
- 6.2.1. Pillar/Charging Station/Dock
- 6.2.2. Inverter
- 6.2.3. Charger
- 6.2.3.1. AC Charger
- 6.2.3.2. DC Charger
- 6.2.4. Others (Cord, Port, etc.)
- 6.3. Market Analysis, Insights and Forecast - by Vehicle Type
- 6.3.1. Passenger Cars
- 6.3.2. Commercial Vehicles
- 6.4. Market Analysis, Insights and Forecast - by Charging System Type
- 6.4.1. Slow Charging Systems
- 6.4.2. Fast Charging Systems
- 6.4.3. Rapid Charging Systems
- 6.1. Market Analysis, Insights and Forecast - by Application Type
- 7. South America US EV Charging Systems Market Analysis, Insights and Forecast, 2019-2031
- 7.1. Market Analysis, Insights and Forecast - by Application Type
- 7.1.1. Public
- 7.1.2. Private (Residential and Commercial)
- 7.2. Market Analysis, Insights and Forecast - by Equipment Type
- 7.2.1. Pillar/Charging Station/Dock
- 7.2.2. Inverter
- 7.2.3. Charger
- 7.2.3.1. AC Charger
- 7.2.3.2. DC Charger
- 7.2.4. Others (Cord, Port, etc.)
- 7.3. Market Analysis, Insights and Forecast - by Vehicle Type
- 7.3.1. Passenger Cars
- 7.3.2. Commercial Vehicles
- 7.4. Market Analysis, Insights and Forecast - by Charging System Type
- 7.4.1. Slow Charging Systems
- 7.4.2. Fast Charging Systems
- 7.4.3. Rapid Charging Systems
- 7.1. Market Analysis, Insights and Forecast - by Application Type
- 8. Europe US EV Charging Systems Market Analysis, Insights and Forecast, 2019-2031
- 8.1. Market Analysis, Insights and Forecast - by Application Type
- 8.1.1. Public
- 8.1.2. Private (Residential and Commercial)
- 8.2. Market Analysis, Insights and Forecast - by Equipment Type
- 8.2.1. Pillar/Charging Station/Dock
- 8.2.2. Inverter
- 8.2.3. Charger
- 8.2.3.1. AC Charger
- 8.2.3.2. DC Charger
- 8.2.4. Others (Cord, Port, etc.)
- 8.3. Market Analysis, Insights and Forecast - by Vehicle Type
- 8.3.1. Passenger Cars
- 8.3.2. Commercial Vehicles
- 8.4. Market Analysis, Insights and Forecast - by Charging System Type
- 8.4.1. Slow Charging Systems
- 8.4.2. Fast Charging Systems
- 8.4.3. Rapid Charging Systems
- 8.1. Market Analysis, Insights and Forecast - by Application Type
- 9. Middle East & Africa US EV Charging Systems Market Analysis, Insights and Forecast, 2019-2031
- 9.1. Market Analysis, Insights and Forecast - by Application Type
- 9.1.1. Public
- 9.1.2. Private (Residential and Commercial)
- 9.2. Market Analysis, Insights and Forecast - by Equipment Type
- 9.2.1. Pillar/Charging Station/Dock
- 9.2.2. Inverter
- 9.2.3. Charger
- 9.2.3.1. AC Charger
- 9.2.3.2. DC Charger
- 9.2.4. Others (Cord, Port, etc.)
- 9.3. Market Analysis, Insights and Forecast - by Vehicle Type
- 9.3.1. Passenger Cars
- 9.3.2. Commercial Vehicles
- 9.4. Market Analysis, Insights and Forecast - by Charging System Type
- 9.4.1. Slow Charging Systems
- 9.4.2. Fast Charging Systems
- 9.4.3. Rapid Charging Systems
- 9.1. Market Analysis, Insights and Forecast - by Application Type
- 10. Asia Pacific US EV Charging Systems Market Analysis, Insights and Forecast, 2019-2031
- 10.1. Market Analysis, Insights and Forecast - by Application Type
- 10.1.1. Public
- 10.1.2. Private (Residential and Commercial)
- 10.2. Market Analysis, Insights and Forecast - by Equipment Type
- 10.2.1. Pillar/Charging Station/Dock
- 10.2.2. Inverter
- 10.2.3. Charger
- 10.2.3.1. AC Charger
- 10.2.3.2. DC Charger
- 10.2.4. Others (Cord, Port, etc.)
- 10.3. Market Analysis, Insights and Forecast - by Vehicle Type
- 10.3.1. Passenger Cars
- 10.3.2. Commercial Vehicles
- 10.4. Market Analysis, Insights and Forecast - by Charging System Type
- 10.4.1. Slow Charging Systems
- 10.4.2. Fast Charging Systems
- 10.4.3. Rapid Charging Systems
- 10.1. Market Analysis, Insights and Forecast - by Application Type
- 11. Northeast US EV Charging Systems Market Analysis, Insights and Forecast, 2019-2031
- 12. Southeast US EV Charging Systems Market Analysis, Insights and Forecast, 2019-2031
- 13. Midwest US EV Charging Systems Market Analysis, Insights and Forecast, 2019-2031
- 14. Southwest US EV Charging Systems Market Analysis, Insights and Forecast, 2019-2031
- 15. West US EV Charging Systems Market Analysis, Insights and Forecast, 2019-2031
- 16. Competitive Analysis
- 16.1. Global Market Share Analysis 2024
- 16.2. Company Profiles
- 16.2.1 Wallbo
- 16.2.1.1. Overview
- 16.2.1.2. Products
- 16.2.1.3. SWOT Analysis
- 16.2.1.4. Recent Developments
- 16.2.1.5. Financials (Based on Availability)
- 16.2.2 ChargePoint Inc
- 16.2.2.1. Overview
- 16.2.2.2. Products
- 16.2.2.3. SWOT Analysis
- 16.2.2.4. Recent Developments
- 16.2.2.5. Financials (Based on Availability)
- 16.2.3 Blink Charging Co
- 16.2.3.1. Overview
- 16.2.3.2. Products
- 16.2.3.3. SWOT Analysis
- 16.2.3.4. Recent Developments
- 16.2.3.5. Financials (Based on Availability)
- 16.2.4 Leviton Manufacturing Co Inc
- 16.2.4.1. Overview
- 16.2.4.2. Products
- 16.2.4.3. SWOT Analysis
- 16.2.4.4. Recent Developments
- 16.2.4.5. Financials (Based on Availability)
- 16.2.5 Webasto SE
- 16.2.5.1. Overview
- 16.2.5.2. Products
- 16.2.5.3. SWOT Analysis
- 16.2.5.4. Recent Developments
- 16.2.5.5. Financials (Based on Availability)
- 16.2.6 Siemens AG
- 16.2.6.1. Overview
- 16.2.6.2. Products
- 16.2.6.3. SWOT Analysis
- 16.2.6.4. Recent Developments
- 16.2.6.5. Financials (Based on Availability)
- 16.2.7 Schneider Electric SE
- 16.2.7.1. Overview
- 16.2.7.2. Products
- 16.2.7.3. SWOT Analysis
- 16.2.7.4. Recent Developments
- 16.2.7.5. Financials (Based on Availability)
- 16.2.8 ABB Group
- 16.2.8.1. Overview
- 16.2.8.2. Products
- 16.2.8.3. SWOT Analysis
- 16.2.8.4. Recent Developments
- 16.2.8.5. Financials (Based on Availability)
- 16.2.9 Tesla Inc
- 16.2.9.1. Overview
- 16.2.9.2. Products
- 16.2.9.3. SWOT Analysis
- 16.2.9.4. Recent Developments
- 16.2.9.5. Financials (Based on Availability)
- 16.2.10 EVBox Group
- 16.2.10.1. Overview
- 16.2.10.2. Products
- 16.2.10.3. SWOT Analysis
- 16.2.10.4. Recent Developments
- 16.2.10.5. Financials (Based on Availability)
- 16.2.11 EvoCharge Inc
- 16.2.11.1. Overview
- 16.2.11.2. Products
- 16.2.11.3. SWOT Analysis
- 16.2.11.4. Recent Developments
- 16.2.11.5. Financials (Based on Availability)
- 16.2.12 Eaton Corporation
- 16.2.12.1. Overview
- 16.2.12.2. Products
- 16.2.12.3. SWOT Analysis
- 16.2.12.4. Recent Developments
- 16.2.12.5. Financials (Based on Availability)
- 16.2.1 Wallbo
List of Figures
- Figure 1: Global US EV Charging Systems Market Revenue Breakdown (Million, %) by Region 2024 & 2032
- Figure 2: United states US EV Charging Systems Market Revenue (Million), by Country 2024 & 2032
- Figure 3: United states US EV Charging Systems Market Revenue Share (%), by Country 2024 & 2032
- Figure 4: North America US EV Charging Systems Market Revenue (Million), by Application Type 2024 & 2032
- Figure 5: North America US EV Charging Systems Market Revenue Share (%), by Application Type 2024 & 2032
- Figure 6: North America US EV Charging Systems Market Revenue (Million), by Equipment Type 2024 & 2032
- Figure 7: North America US EV Charging Systems Market Revenue Share (%), by Equipment Type 2024 & 2032
- Figure 8: North America US EV Charging Systems Market Revenue (Million), by Vehicle Type 2024 & 2032
- Figure 9: North America US EV Charging Systems Market Revenue Share (%), by Vehicle Type 2024 & 2032
- Figure 10: North America US EV Charging Systems Market Revenue (Million), by Charging System Type 2024 & 2032
- Figure 11: North America US EV Charging Systems Market Revenue Share (%), by Charging System Type 2024 & 2032
- Figure 12: North America US EV Charging Systems Market Revenue (Million), by Country 2024 & 2032
- Figure 13: North America US EV Charging Systems Market Revenue Share (%), by Country 2024 & 2032
- Figure 14: South America US EV Charging Systems Market Revenue (Million), by Application Type 2024 & 2032
- Figure 15: South America US EV Charging Systems Market Revenue Share (%), by Application Type 2024 & 2032
- Figure 16: South America US EV Charging Systems Market Revenue (Million), by Equipment Type 2024 & 2032
- Figure 17: South America US EV Charging Systems Market Revenue Share (%), by Equipment Type 2024 & 2032
- Figure 18: South America US EV Charging Systems Market Revenue (Million), by Vehicle Type 2024 & 2032
- Figure 19: South America US EV Charging Systems Market Revenue Share (%), by Vehicle Type 2024 & 2032
- Figure 20: South America US EV Charging Systems Market Revenue (Million), by Charging System Type 2024 & 2032
- Figure 21: South America US EV Charging Systems Market Revenue Share (%), by Charging System Type 2024 & 2032
- Figure 22: South America US EV Charging Systems Market Revenue (Million), by Country 2024 & 2032
- Figure 23: South America US EV Charging Systems Market Revenue Share (%), by Country 2024 & 2032
- Figure 24: Europe US EV Charging Systems Market Revenue (Million), by Application Type 2024 & 2032
- Figure 25: Europe US EV Charging Systems Market Revenue Share (%), by Application Type 2024 & 2032
- Figure 26: Europe US EV Charging Systems Market Revenue (Million), by Equipment Type 2024 & 2032
- Figure 27: Europe US EV Charging Systems Market Revenue Share (%), by Equipment Type 2024 & 2032
- Figure 28: Europe US EV Charging Systems Market Revenue (Million), by Vehicle Type 2024 & 2032
- Figure 29: Europe US EV Charging Systems Market Revenue Share (%), by Vehicle Type 2024 & 2032
- Figure 30: Europe US EV Charging Systems Market Revenue (Million), by Charging System Type 2024 & 2032
- Figure 31: Europe US EV Charging Systems Market Revenue Share (%), by Charging System Type 2024 & 2032
- Figure 32: Europe US EV Charging Systems Market Revenue (Million), by Country 2024 & 2032
- Figure 33: Europe US EV Charging Systems Market Revenue Share (%), by Country 2024 & 2032
- Figure 34: Middle East & Africa US EV Charging Systems Market Revenue (Million), by Application Type 2024 & 2032
- Figure 35: Middle East & Africa US EV Charging Systems Market Revenue Share (%), by Application Type 2024 & 2032
- Figure 36: Middle East & Africa US EV Charging Systems Market Revenue (Million), by Equipment Type 2024 & 2032
- Figure 37: Middle East & Africa US EV Charging Systems Market Revenue Share (%), by Equipment Type 2024 & 2032
- Figure 38: Middle East & Africa US EV Charging Systems Market Revenue (Million), by Vehicle Type 2024 & 2032
- Figure 39: Middle East & Africa US EV Charging Systems Market Revenue Share (%), by Vehicle Type 2024 & 2032
- Figure 40: Middle East & Africa US EV Charging Systems Market Revenue (Million), by Charging System Type 2024 & 2032
- Figure 41: Middle East & Africa US EV Charging Systems Market Revenue Share (%), by Charging System Type 2024 & 2032
- Figure 42: Middle East & Africa US EV Charging Systems Market Revenue (Million), by Country 2024 & 2032
- Figure 43: Middle East & Africa US EV Charging Systems Market Revenue Share (%), by Country 2024 & 2032
- Figure 44: Asia Pacific US EV Charging Systems Market Revenue (Million), by Application Type 2024 & 2032
- Figure 45: Asia Pacific US EV Charging Systems Market Revenue Share (%), by Application Type 2024 & 2032
- Figure 46: Asia Pacific US EV Charging Systems Market Revenue (Million), by Equipment Type 2024 & 2032
- Figure 47: Asia Pacific US EV Charging Systems Market Revenue Share (%), by Equipment Type 2024 & 2032
- Figure 48: Asia Pacific US EV Charging Systems Market Revenue (Million), by Vehicle Type 2024 & 2032
- Figure 49: Asia Pacific US EV Charging Systems Market Revenue Share (%), by Vehicle Type 2024 & 2032
- Figure 50: Asia Pacific US EV Charging Systems Market Revenue (Million), by Charging System Type 2024 & 2032
- Figure 51: Asia Pacific US EV Charging Systems Market Revenue Share (%), by Charging System Type 2024 & 2032
- Figure 52: Asia Pacific US EV Charging Systems Market Revenue (Million), by Country 2024 & 2032
- Figure 53: Asia Pacific US EV Charging Systems Market Revenue Share (%), by Country 2024 & 2032
List of Tables
- Table 1: Global US EV Charging Systems Market Revenue Million Forecast, by Region 2019 & 2032
- Table 2: Global US EV Charging Systems Market Revenue Million Forecast, by Application Type 2019 & 2032
- Table 3: Global US EV Charging Systems Market Revenue Million Forecast, by Equipment Type 2019 & 2032
- Table 4: Global US EV Charging Systems Market Revenue Million Forecast, by Vehicle Type 2019 & 2032
- Table 5: Global US EV Charging Systems Market Revenue Million Forecast, by Charging System Type 2019 & 2032
- Table 6: Global US EV Charging Systems Market Revenue Million Forecast, by Region 2019 & 2032
- Table 7: Global US EV Charging Systems Market Revenue Million Forecast, by Country 2019 & 2032
- Table 8: Northeast US EV Charging Systems Market Revenue (Million) Forecast, by Application 2019 & 2032
- Table 9: Southeast US EV Charging Systems Market Revenue (Million) Forecast, by Application 2019 & 2032
- Table 10: Midwest US EV Charging Systems Market Revenue (Million) Forecast, by Application 2019 & 2032
- Table 11: Southwest US EV Charging Systems Market Revenue (Million) Forecast, by Application 2019 & 2032
- Table 12: West US EV Charging Systems Market Revenue (Million) Forecast, by Application 2019 & 2032
- Table 13: Global US EV Charging Systems Market Revenue Million Forecast, by Application Type 2019 & 2032
- Table 14: Global US EV Charging Systems Market Revenue Million Forecast, by Equipment Type 2019 & 2032
- Table 15: Global US EV Charging Systems Market Revenue Million Forecast, by Vehicle Type 2019 & 2032
- Table 16: Global US EV Charging Systems Market Revenue Million Forecast, by Charging System Type 2019 & 2032
- Table 17: Global US EV Charging Systems Market Revenue Million Forecast, by Country 2019 & 2032
- Table 18: United States US EV Charging Systems Market Revenue (Million) Forecast, by Application 2019 & 2032
- Table 19: Canada US EV Charging Systems Market Revenue (Million) Forecast, by Application 2019 & 2032
- Table 20: Mexico US EV Charging Systems Market Revenue (Million) Forecast, by Application 2019 & 2032
- Table 21: Global US EV Charging Systems Market Revenue Million Forecast, by Application Type 2019 & 2032
- Table 22: Global US EV Charging Systems Market Revenue Million Forecast, by Equipment Type 2019 & 2032
- Table 23: Global US EV Charging Systems Market Revenue Million Forecast, by Vehicle Type 2019 & 2032
- Table 24: Global US EV Charging Systems Market Revenue Million Forecast, by Charging System Type 2019 & 2032
- Table 25: Global US EV Charging Systems Market Revenue Million Forecast, by Country 2019 & 2032
- Table 26: Brazil US EV Charging Systems Market Revenue (Million) Forecast, by Application 2019 & 2032
- Table 27: Argentina US EV Charging Systems Market Revenue (Million) Forecast, by Application 2019 & 2032
- Table 28: Rest of South America US EV Charging Systems Market Revenue (Million) Forecast, by Application 2019 & 2032
- Table 29: Global US EV Charging Systems Market Revenue Million Forecast, by Application Type 2019 & 2032
- Table 30: Global US EV Charging Systems Market Revenue Million Forecast, by Equipment Type 2019 & 2032
- Table 31: Global US EV Charging Systems Market Revenue Million Forecast, by Vehicle Type 2019 & 2032
- Table 32: Global US EV Charging Systems Market Revenue Million Forecast, by Charging System Type 2019 & 2032
- Table 33: Global US EV Charging Systems Market Revenue Million Forecast, by Country 2019 & 2032
- Table 34: United Kingdom US EV Charging Systems Market Revenue (Million) Forecast, by Application 2019 & 2032
- Table 35: Germany US EV Charging Systems Market Revenue (Million) Forecast, by Application 2019 & 2032
- Table 36: France US EV Charging Systems Market Revenue (Million) Forecast, by Application 2019 & 2032
- Table 37: Italy US EV Charging Systems Market Revenue (Million) Forecast, by Application 2019 & 2032
- Table 38: Spain US EV Charging Systems Market Revenue (Million) Forecast, by Application 2019 & 2032
- Table 39: Russia US EV Charging Systems Market Revenue (Million) Forecast, by Application 2019 & 2032
- Table 40: Benelux US EV Charging Systems Market Revenue (Million) Forecast, by Application 2019 & 2032
- Table 41: Nordics US EV Charging Systems Market Revenue (Million) Forecast, by Application 2019 & 2032
- Table 42: Rest of Europe US EV Charging Systems Market Revenue (Million) Forecast, by Application 2019 & 2032
- Table 43: Global US EV Charging Systems Market Revenue Million Forecast, by Application Type 2019 & 2032
- Table 44: Global US EV Charging Systems Market Revenue Million Forecast, by Equipment Type 2019 & 2032
- Table 45: Global US EV Charging Systems Market Revenue Million Forecast, by Vehicle Type 2019 & 2032
- Table 46: Global US EV Charging Systems Market Revenue Million Forecast, by Charging System Type 2019 & 2032
- Table 47: Global US EV Charging Systems Market Revenue Million Forecast, by Country 2019 & 2032
- Table 48: Turkey US EV Charging Systems Market Revenue (Million) Forecast, by Application 2019 & 2032
- Table 49: Israel US EV Charging Systems Market Revenue (Million) Forecast, by Application 2019 & 2032
- Table 50: GCC US EV Charging Systems Market Revenue (Million) Forecast, by Application 2019 & 2032
- Table 51: North Africa US EV Charging Systems Market Revenue (Million) Forecast, by Application 2019 & 2032
- Table 52: South Africa US EV Charging Systems Market Revenue (Million) Forecast, by Application 2019 & 2032
- Table 53: Rest of Middle East & Africa US EV Charging Systems Market Revenue (Million) Forecast, by Application 2019 & 2032
- Table 54: Global US EV Charging Systems Market Revenue Million Forecast, by Application Type 2019 & 2032
- Table 55: Global US EV Charging Systems Market Revenue Million Forecast, by Equipment Type 2019 & 2032
- Table 56: Global US EV Charging Systems Market Revenue Million Forecast, by Vehicle Type 2019 & 2032
- Table 57: Global US EV Charging Systems Market Revenue Million Forecast, by Charging System Type 2019 & 2032
- Table 58: Global US EV Charging Systems Market Revenue Million Forecast, by Country 2019 & 2032
- Table 59: China US EV Charging Systems Market Revenue (Million) Forecast, by Application 2019 & 2032
- Table 60: India US EV Charging Systems Market Revenue (Million) Forecast, by Application 2019 & 2032
- Table 61: Japan US EV Charging Systems Market Revenue (Million) Forecast, by Application 2019 & 2032
- Table 62: South Korea US EV Charging Systems Market Revenue (Million) Forecast, by Application 2019 & 2032
- Table 63: ASEAN US EV Charging Systems Market Revenue (Million) Forecast, by Application 2019 & 2032
- Table 64: Oceania US EV Charging Systems Market Revenue (Million) Forecast, by Application 2019 & 2032
- Table 65: Rest of Asia Pacific US EV Charging Systems Market Revenue (Million) Forecast, by Application 2019 & 2032
Frequently Asked Questions
1. What is the projected Compound Annual Growth Rate (CAGR) of the US EV Charging Systems Market?
The projected CAGR is approximately 27.65%.
2. Which companies are prominent players in the US EV Charging Systems Market?
Key companies in the market include Wallbo, ChargePoint Inc, Blink Charging Co, Leviton Manufacturing Co Inc, Webasto SE, Siemens AG, Schneider Electric SE, ABB Group, Tesla Inc, EVBox Group, EvoCharge Inc, Eaton Corporation.
3. What are the main segments of the US EV Charging Systems Market?
The market segments include Application Type, Equipment Type, Vehicle Type, Charging System Type.
4. Can you provide details about the market size?
The market size is estimated to be USD 3.88 Million as of 2022.
5. What are some drivers contributing to market growth?
Aggressive Government Focus to Promote the Adoption of Electric Vehicles Fosters the Growth of the Market.
6. What are the notable trends driving market growth?
Passengers Cars Segment to Gain Traction during the Forecast Period.
7. Are there any restraints impacting market growth?
High Cost of Setting Up EV Charging Stations Hampers the Growth of the Market.
8. Can you provide examples of recent developments in the market?
In March 2024, Wallbox announced the delivery of its smart chargers, Pulsar Pro North America, designed specifically for residential and commercial properties, which will be available to customers from the United States. Apart from the latest innovation, Wallbox also launched Supernova 180, its DC-fast EV charger, to assist in improving the state of the fast charging ecosystem in the United States.
9. What pricing options are available for accessing the report?
Pricing options include single-user, multi-user, and enterprise licenses priced at USD 3800, USD 4500, and USD 5800 respectively.
10. Is the market size provided in terms of value or volume?
The market size is provided in terms of value, measured in Million.
11. Are there any specific market keywords associated with the report?
Yes, the market keyword associated with the report is "US EV Charging Systems Market," which aids in identifying and referencing the specific market segment covered.
12. How do I determine which pricing option suits my needs best?
The pricing options vary based on user requirements and access needs. Individual users may opt for single-user licenses, while businesses requiring broader access may choose multi-user or enterprise licenses for cost-effective access to the report.
13. Are there any additional resources or data provided in the US EV Charging Systems Market report?
While the report offers comprehensive insights, it's advisable to review the specific contents or supplementary materials provided to ascertain if additional resources or data are available.
14. How can I stay updated on further developments or reports in the US EV Charging Systems Market?
To stay informed about further developments, trends, and reports in the US EV Charging Systems Market, consider subscribing to industry newsletters, following relevant companies and organizations, or regularly checking reputable industry news sources and publications.
Methodology
Step 1 - Identification of Relevant Samples Size from Population Database


Step 2 - Approaches for Defining Global Market Size (Value, Volume* & Price*)

Note*: In applicable scenarios
Step 3 - Data Sources
Primary Research
- Web Analytics
- Survey Reports
- Research Institute
- Latest Research Reports
- Opinion Leaders
Secondary Research
- Annual Reports
- White Paper
- Latest Press Release
- Industry Association
- Paid Database
- Investor Presentations

Step 4 - Data Triangulation
Involves using different sources of information in order to increase the validity of a study
These sources are likely to be stakeholders in a program - participants, other researchers, program staff, other community members, and so on.
Then we put all data in single framework & apply various statistical tools to find out the dynamic on the market.
During the analysis stage, feedback from the stakeholder groups would be compared to determine areas of agreement as well as areas of divergence


