
Key Insights
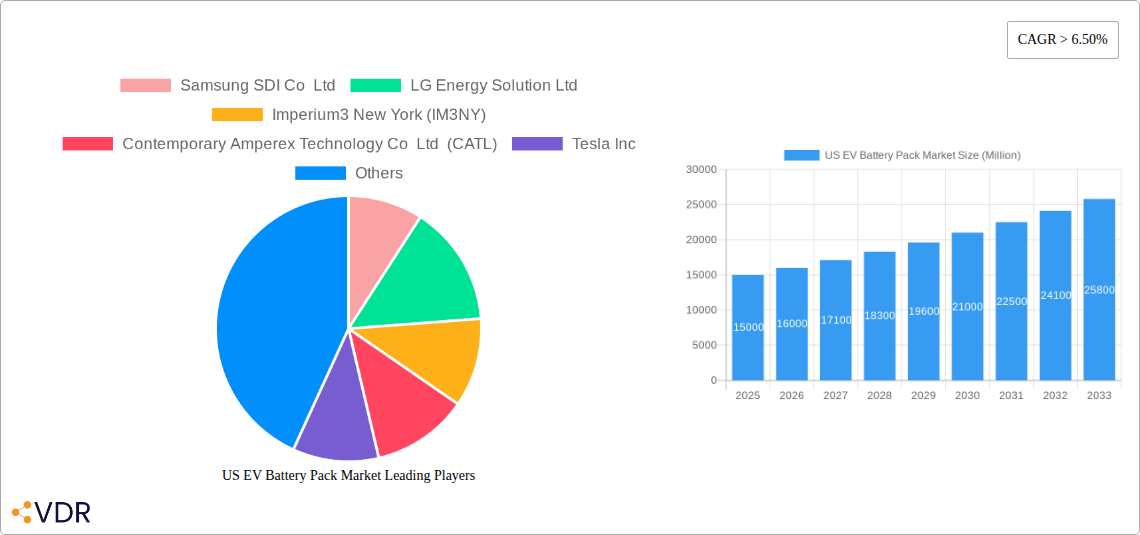
The US electric vehicle (EV) battery pack market is experiencing robust growth, driven by increasing EV adoption fueled by government incentives, rising environmental concerns, and advancements in battery technology. The market's Compound Annual Growth Rate (CAGR) exceeding 6.50% from 2019-2033 indicates a significant expansion. Several factors contribute to this growth. Firstly, the diversification of battery chemistries, including LFP, NCA, NCM, and NMC, offers various performance and cost options to cater to different EV segments. Secondly, the expansion of battery pack capacities, from under 15 kWh to over 80 kWh, caters to diverse vehicle ranges and sizes. This is evident in the market segmentation across passenger cars, light commercial vehicles (LCVs), buses, and medium & heavy-duty trucks (M&HDTs), all driving demand for different battery pack configurations. The prevalent battery forms (cylindrical, pouch, prismatic) and manufacturing methods (laser, wire welding) also influence market dynamics, with ongoing innovation pushing efficiency and reducing costs. Finally, the key players—Samsung SDI, LG Energy Solution, CATL, Tesla, and others—are investing heavily in R&D and expanding production capacities to meet the surging demand.
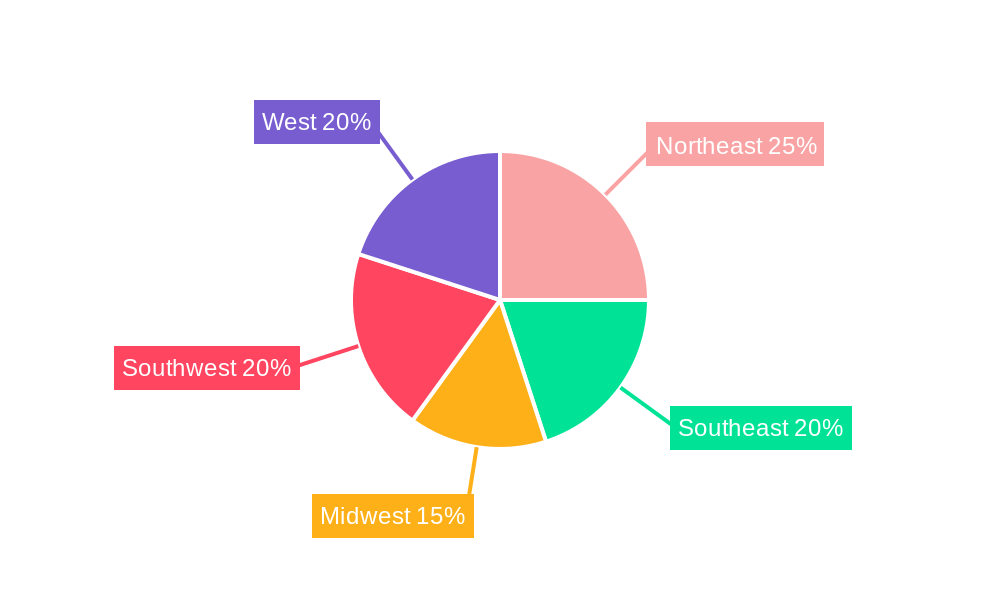
The market's growth is not without challenges. While advancements in battery technology are improving energy density and lifespan, concerns remain about raw material sourcing and supply chain stability, particularly concerning materials like cobalt and lithium. Furthermore, the overall cost of battery packs remains a significant factor influencing EV affordability and market penetration. However, economies of scale and technological advancements are gradually mitigating these costs. The regional breakdown within the US, encompassing Northeast, Southeast, Midwest, Southwest, and West, reveals varying adoption rates depending on infrastructure development, consumer preferences, and government policies at the state level. The forecast period of 2025-2033 promises continued market expansion, driven by ongoing technological improvements, supportive government regulations, and increasing consumer demand for electric vehicles.
US EV Battery Pack Market: A Comprehensive Report (2019-2033)
This comprehensive report provides an in-depth analysis of the US EV battery pack market, encompassing market dynamics, growth trends, key players, and future outlook. The report covers the parent market (Electric Vehicle market) and the child market (EV Battery Packs) providing a holistic view of this rapidly evolving sector. The study period is 2019-2033, with 2025 as the base and estimated year. The forecast period is 2025-2033, and the historical period is 2019-2024. The market size is presented in million units.
US EV Battery Pack Market Dynamics & Structure
The US EV battery pack market is characterized by a dynamic interplay of technological innovation, stringent regulatory frameworks, and intense competition. Market concentration is currently moderate, with key players like Tesla, CATL, LG Energy Solution, and Samsung SDI holding significant shares, but the market exhibits a high degree of fragmentation among smaller players focusing on niche segments or specialized technologies. Technological innovation is a primary driver, with ongoing research and development in battery chemistries (LFP, NCA, NMC, etc.), form factors (cylindrical, pouch, prismatic), and manufacturing processes (laser welding, wire bonding). The regulatory landscape, including incentives and emissions standards, significantly influences market growth. The emergence of robust charging infrastructure and supportive government policies further fuels adoption. Meanwhile, competition from alternative propulsion technologies (e.g., hydrogen fuel cells) presents a challenge. The market is also witnessing a considerable number of M&A activities, with approximately xx deals recorded in the past five years. This suggests a consolidation trend.
- Market Concentration: Moderate, with top players holding xx% market share.
- Technological Innovation: Focus on higher energy density, faster charging, and improved safety.
- Regulatory Framework: Stringent emission standards and government incentives drive market growth.
- Competitive Substitutes: Hydrogen fuel cells and internal combustion engines pose competition.
- M&A Activity: xx deals in the last 5 years indicate market consolidation.
- Innovation Barriers: High R&D costs, complex supply chains, and material sourcing challenges.
US EV Battery Pack Market Growth Trends & Insights
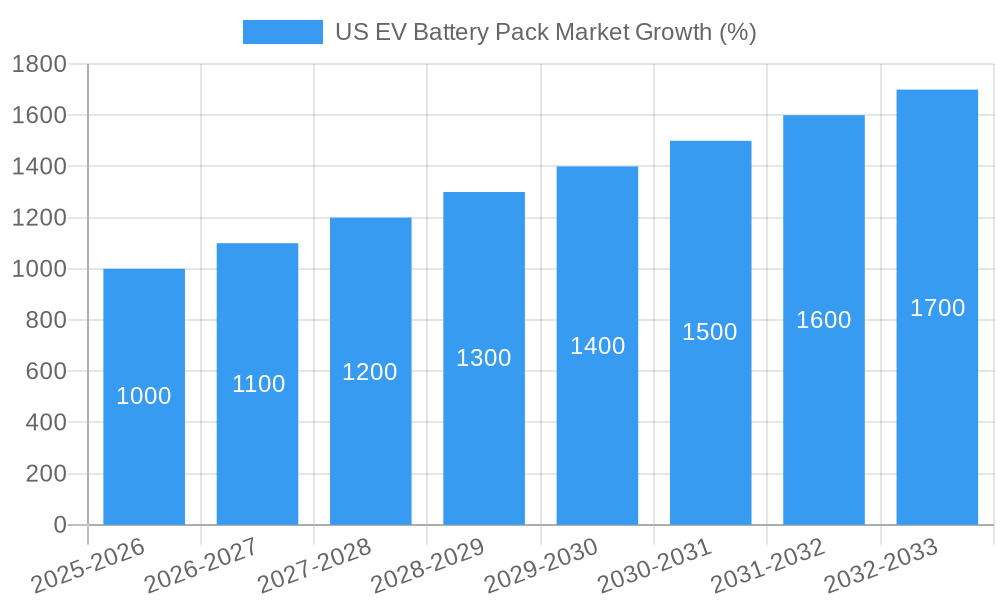
The US EV battery pack market experienced significant growth during the historical period (2019-2024), driven primarily by increasing EV adoption and supportive government policies. The market size was approximately xx million units in 2024 and is projected to reach xx million units by 2033, exhibiting a CAGR of xx%. This growth is attributed to factors such as rising consumer awareness of environmental concerns, decreasing battery costs, and the expanding availability of EV models. Technological advancements, such as the development of solid-state batteries and improved battery management systems, are expected to further accelerate market expansion. Shifting consumer preferences towards electric mobility and enhanced charging infrastructure availability are further fueling the market’s rapid growth trajectory.
Dominant Regions, Countries, or Segments in US EV Battery Pack Market
California, Texas, and Michigan lead the US EV battery pack market, driven by strong EV adoption rates, supportive state policies, and the presence of major automotive manufacturers and battery suppliers. The passenger car segment dominates the market in terms of volume, accounting for approximately xx% of the total. Within battery chemistries, NMC and NCA currently hold the largest market share, although LFP is gaining traction due to its cost-effectiveness. The 40 kWh to 80 kWh capacity segment is currently the largest, but the above 80 kWh segment is experiencing the fastest growth. Prismatic battery form factors are predominantly used, but pouch cells are gaining popularity due to their flexibility and cost-effectiveness.
- Leading Regions: California, Texas, Michigan
- Dominant Segment (Body Type): Passenger Car (xx%)
- Dominant Segment (Battery Chemistry): NMC & NCA (xx%)
- Dominant Segment (Capacity): 40 kWh to 80 kWh (xx%)
- Dominant Segment (Battery Form): Prismatic (xx%)
- Key Drivers: Supportive government policies, increasing EV adoption, robust charging infrastructure
US EV Battery Pack Market Product Landscape
The US EV battery pack market showcases a diverse range of products tailored to varying vehicle types and performance requirements. Innovations focus on improving energy density, extending lifespan, enhancing safety features, and reducing costs. Key features include advanced thermal management systems, sophisticated battery management systems (BMS), and lightweight designs. The market offers solutions optimized for BEVs and PHEVs, encompassing various chemistries, capacities, and form factors to meet the diverse demands of the EV industry.
Key Drivers, Barriers & Challenges in US EV Battery Pack Market
Key Drivers: Growing demand for EVs, stringent emission regulations, government incentives (tax credits, subsidies), technological advancements (higher energy density, faster charging), and the declining cost of battery packs are driving market growth.
Key Barriers & Challenges: The high initial cost of EV battery packs remains a major barrier. Supply chain disruptions, particularly for critical raw materials like lithium and cobalt, pose significant challenges. Furthermore, concerns about battery safety, range anxiety, and limited charging infrastructure continue to hinder widespread adoption. The lack of a robust recycling infrastructure for spent batteries also presents a concern.
Emerging Opportunities in US EV Battery Pack Market
Emerging opportunities lie in the development of next-generation battery technologies like solid-state batteries and advanced battery management systems. The growing adoption of EVs in commercial fleets and public transportation offers significant untapped market potential. Innovation in fast-charging technologies and the development of more affordable battery packs are crucial for accelerating market growth. The increasing demand for energy storage solutions beyond EVs also presents a significant opportunity.
Growth Accelerators in the US EV Battery Pack Market Industry
Technological breakthroughs, particularly in solid-state battery technology and improved battery chemistries, are poised to significantly accelerate market growth. Strategic partnerships between battery manufacturers, automotive companies, and raw material suppliers are crucial for strengthening the supply chain and reducing costs. Expanding charging infrastructure and implementing supportive government policies will further fuel market expansion. The integration of advanced analytics and AI for battery health monitoring and predictive maintenance is another significant growth driver.
Key Players Shaping the US EV Battery Pack Market Market
- Samsung SDI Co Ltd
- LG Energy Solution Ltd
- Imperium3 New York (IM3NY)
- Contemporary Amperex Technology Co Ltd (CATL)
- Tesla Inc
- SK Innovation Co Ltd
- Ambri Inc
- Sila Nanotechnologies Inc
- Panasonic Holdings Corporation
- Envision AESC Japan Co Ltd
Notable Milestones in US EV Battery Pack Market Sector
- June 2023: CATL commits USD 1.4 billion to develop lithium reserves in Bolivia, signifying a significant investment in securing raw materials for battery production.
- March 2023: Tesla explores building a battery factory in the US with CATL, highlighting the strategic importance of domestic battery production.
- January 2023: Tesla invests USD 3.6 billion to expand Gigafactory Nevada, signaling a major commitment to increasing battery production capacity.
In-Depth US EV Battery Pack Market Outlook
The US EV battery pack market is poised for sustained growth, driven by technological advancements, supportive government policies, and increasing consumer demand for electric vehicles. Strategic investments in battery production capacity, securing raw materials, and fostering innovation will be crucial for companies to capitalize on the market's immense potential. The focus will increasingly shift towards sustainable and cost-effective battery solutions, including recycling and reuse of battery materials. The market is projected to experience robust growth, presenting significant opportunities for both established and emerging players.
US EV Battery Pack Market Segmentation
-
1. Body Type
- 1.1. Bus
- 1.2. LCV
- 1.3. M&HDT
- 1.4. Passenger Car
-
2. Propulsion Type
- 2.1. BEV
- 2.2. PHEV
-
3. Battery Chemistry
- 3.1. LFP
- 3.2. NCA
- 3.3. NCM
- 3.4. NMC
- 3.5. Others
-
4. Capacity
- 4.1. 15 kWh to 40 kWh
- 4.2. 40 kWh to 80 kWh
- 4.3. Above 80 kWh
- 4.4. Less than 15 kWh
-
5. Battery Form
- 5.1. Cylindrical
- 5.2. Pouch
- 5.3. Prismatic
-
6. Method
- 6.1. Laser
- 6.2. Wire
-
7. Component
- 7.1. Anode
- 7.2. Cathode
- 7.3. Electrolyte
- 7.4. Separator
-
8. Material Type
- 8.1. Cobalt
- 8.2. Lithium
- 8.3. Manganese
- 8.4. Natural Graphite
- 8.5. Nickel
- 8.6. Other Materials
US EV Battery Pack Market Segmentation By Geography
-
1. North America
- 1.1. United States
- 1.2. Canada
- 1.3. Mexico
-
2. South America
- 2.1. Brazil
- 2.2. Argentina
- 2.3. Rest of South America
-
3. Europe
- 3.1. United Kingdom
- 3.2. Germany
- 3.3. France
- 3.4. Italy
- 3.5. Spain
- 3.6. Russia
- 3.7. Benelux
- 3.8. Nordics
- 3.9. Rest of Europe
-
4. Middle East & Africa
- 4.1. Turkey
- 4.2. Israel
- 4.3. GCC
- 4.4. North Africa
- 4.5. South Africa
- 4.6. Rest of Middle East & Africa
-
5. Asia Pacific
- 5.1. China
- 5.2. India
- 5.3. Japan
- 5.4. South Korea
- 5.5. ASEAN
- 5.6. Oceania
- 5.7. Rest of Asia Pacific
US EV Battery Pack Market REPORT HIGHLIGHTS
| Aspects | Details |
|---|---|
| Study Period | 2019-2033 |
| Base Year | 2024 |
| Estimated Year | 2025 |
| Forecast Period | 2025-2033 |
| Historical Period | 2019-2024 |
| Growth Rate | CAGR of > 6.50% from 2019-2033 |
| Segmentation |
|
Table of Contents
- 1. Introduction
- 1.1. Research Scope
- 1.2. Market Segmentation
- 1.3. Research Methodology
- 1.4. Definitions and Assumptions
- 2. Executive Summary
- 2.1. Introduction
- 3. Market Dynamics
- 3.1. Introduction
- 3.2. Market Drivers
- 3.2.1. Increasing Demand and Sales of Commercial Vehicles is Driving the Market for Hydraulic Systems
- 3.3. Market Restrains
- 3.3.1. Increasing Replacement of Conventional Hydraulic Systems with Fully-electric Hydraulic Systems Acts as a Restraint
- 3.4. Market Trends
- 3.4.1. OTHER KEY INDUSTRY TRENDS COVERED IN THE REPORT
- 4. Market Factor Analysis
- 4.1. Porters Five Forces
- 4.2. Supply/Value Chain
- 4.3. PESTEL analysis
- 4.4. Market Entropy
- 4.5. Patent/Trademark Analysis
- 5. Global US EV Battery Pack Market Analysis, Insights and Forecast, 2019-2031
- 5.1. Market Analysis, Insights and Forecast - by Body Type
- 5.1.1. Bus
- 5.1.2. LCV
- 5.1.3. M&HDT
- 5.1.4. Passenger Car
- 5.2. Market Analysis, Insights and Forecast - by Propulsion Type
- 5.2.1. BEV
- 5.2.2. PHEV
- 5.3. Market Analysis, Insights and Forecast - by Battery Chemistry
- 5.3.1. LFP
- 5.3.2. NCA
- 5.3.3. NCM
- 5.3.4. NMC
- 5.3.5. Others
- 5.4. Market Analysis, Insights and Forecast - by Capacity
- 5.4.1. 15 kWh to 40 kWh
- 5.4.2. 40 kWh to 80 kWh
- 5.4.3. Above 80 kWh
- 5.4.4. Less than 15 kWh
- 5.5. Market Analysis, Insights and Forecast - by Battery Form
- 5.5.1. Cylindrical
- 5.5.2. Pouch
- 5.5.3. Prismatic
- 5.6. Market Analysis, Insights and Forecast - by Method
- 5.6.1. Laser
- 5.6.2. Wire
- 5.7. Market Analysis, Insights and Forecast - by Component
- 5.7.1. Anode
- 5.7.2. Cathode
- 5.7.3. Electrolyte
- 5.7.4. Separator
- 5.8. Market Analysis, Insights and Forecast - by Material Type
- 5.8.1. Cobalt
- 5.8.2. Lithium
- 5.8.3. Manganese
- 5.8.4. Natural Graphite
- 5.8.5. Nickel
- 5.8.6. Other Materials
- 5.9. Market Analysis, Insights and Forecast - by Region
- 5.9.1. North America
- 5.9.2. South America
- 5.9.3. Europe
- 5.9.4. Middle East & Africa
- 5.9.5. Asia Pacific
- 5.1. Market Analysis, Insights and Forecast - by Body Type
- 6. North America US EV Battery Pack Market Analysis, Insights and Forecast, 2019-2031
- 6.1. Market Analysis, Insights and Forecast - by Body Type
- 6.1.1. Bus
- 6.1.2. LCV
- 6.1.3. M&HDT
- 6.1.4. Passenger Car
- 6.2. Market Analysis, Insights and Forecast - by Propulsion Type
- 6.2.1. BEV
- 6.2.2. PHEV
- 6.3. Market Analysis, Insights and Forecast - by Battery Chemistry
- 6.3.1. LFP
- 6.3.2. NCA
- 6.3.3. NCM
- 6.3.4. NMC
- 6.3.5. Others
- 6.4. Market Analysis, Insights and Forecast - by Capacity
- 6.4.1. 15 kWh to 40 kWh
- 6.4.2. 40 kWh to 80 kWh
- 6.4.3. Above 80 kWh
- 6.4.4. Less than 15 kWh
- 6.5. Market Analysis, Insights and Forecast - by Battery Form
- 6.5.1. Cylindrical
- 6.5.2. Pouch
- 6.5.3. Prismatic
- 6.6. Market Analysis, Insights and Forecast - by Method
- 6.6.1. Laser
- 6.6.2. Wire
- 6.7. Market Analysis, Insights and Forecast - by Component
- 6.7.1. Anode
- 6.7.2. Cathode
- 6.7.3. Electrolyte
- 6.7.4. Separator
- 6.8. Market Analysis, Insights and Forecast - by Material Type
- 6.8.1. Cobalt
- 6.8.2. Lithium
- 6.8.3. Manganese
- 6.8.4. Natural Graphite
- 6.8.5. Nickel
- 6.8.6. Other Materials
- 6.1. Market Analysis, Insights and Forecast - by Body Type
- 7. South America US EV Battery Pack Market Analysis, Insights and Forecast, 2019-2031
- 7.1. Market Analysis, Insights and Forecast - by Body Type
- 7.1.1. Bus
- 7.1.2. LCV
- 7.1.3. M&HDT
- 7.1.4. Passenger Car
- 7.2. Market Analysis, Insights and Forecast - by Propulsion Type
- 7.2.1. BEV
- 7.2.2. PHEV
- 7.3. Market Analysis, Insights and Forecast - by Battery Chemistry
- 7.3.1. LFP
- 7.3.2. NCA
- 7.3.3. NCM
- 7.3.4. NMC
- 7.3.5. Others
- 7.4. Market Analysis, Insights and Forecast - by Capacity
- 7.4.1. 15 kWh to 40 kWh
- 7.4.2. 40 kWh to 80 kWh
- 7.4.3. Above 80 kWh
- 7.4.4. Less than 15 kWh
- 7.5. Market Analysis, Insights and Forecast - by Battery Form
- 7.5.1. Cylindrical
- 7.5.2. Pouch
- 7.5.3. Prismatic
- 7.6. Market Analysis, Insights and Forecast - by Method
- 7.6.1. Laser
- 7.6.2. Wire
- 7.7. Market Analysis, Insights and Forecast - by Component
- 7.7.1. Anode
- 7.7.2. Cathode
- 7.7.3. Electrolyte
- 7.7.4. Separator
- 7.8. Market Analysis, Insights and Forecast - by Material Type
- 7.8.1. Cobalt
- 7.8.2. Lithium
- 7.8.3. Manganese
- 7.8.4. Natural Graphite
- 7.8.5. Nickel
- 7.8.6. Other Materials
- 7.1. Market Analysis, Insights and Forecast - by Body Type
- 8. Europe US EV Battery Pack Market Analysis, Insights and Forecast, 2019-2031
- 8.1. Market Analysis, Insights and Forecast - by Body Type
- 8.1.1. Bus
- 8.1.2. LCV
- 8.1.3. M&HDT
- 8.1.4. Passenger Car
- 8.2. Market Analysis, Insights and Forecast - by Propulsion Type
- 8.2.1. BEV
- 8.2.2. PHEV
- 8.3. Market Analysis, Insights and Forecast - by Battery Chemistry
- 8.3.1. LFP
- 8.3.2. NCA
- 8.3.3. NCM
- 8.3.4. NMC
- 8.3.5. Others
- 8.4. Market Analysis, Insights and Forecast - by Capacity
- 8.4.1. 15 kWh to 40 kWh
- 8.4.2. 40 kWh to 80 kWh
- 8.4.3. Above 80 kWh
- 8.4.4. Less than 15 kWh
- 8.5. Market Analysis, Insights and Forecast - by Battery Form
- 8.5.1. Cylindrical
- 8.5.2. Pouch
- 8.5.3. Prismatic
- 8.6. Market Analysis, Insights and Forecast - by Method
- 8.6.1. Laser
- 8.6.2. Wire
- 8.7. Market Analysis, Insights and Forecast - by Component
- 8.7.1. Anode
- 8.7.2. Cathode
- 8.7.3. Electrolyte
- 8.7.4. Separator
- 8.8. Market Analysis, Insights and Forecast - by Material Type
- 8.8.1. Cobalt
- 8.8.2. Lithium
- 8.8.3. Manganese
- 8.8.4. Natural Graphite
- 8.8.5. Nickel
- 8.8.6. Other Materials
- 8.1. Market Analysis, Insights and Forecast - by Body Type
- 9. Middle East & Africa US EV Battery Pack Market Analysis, Insights and Forecast, 2019-2031
- 9.1. Market Analysis, Insights and Forecast - by Body Type
- 9.1.1. Bus
- 9.1.2. LCV
- 9.1.3. M&HDT
- 9.1.4. Passenger Car
- 9.2. Market Analysis, Insights and Forecast - by Propulsion Type
- 9.2.1. BEV
- 9.2.2. PHEV
- 9.3. Market Analysis, Insights and Forecast - by Battery Chemistry
- 9.3.1. LFP
- 9.3.2. NCA
- 9.3.3. NCM
- 9.3.4. NMC
- 9.3.5. Others
- 9.4. Market Analysis, Insights and Forecast - by Capacity
- 9.4.1. 15 kWh to 40 kWh
- 9.4.2. 40 kWh to 80 kWh
- 9.4.3. Above 80 kWh
- 9.4.4. Less than 15 kWh
- 9.5. Market Analysis, Insights and Forecast - by Battery Form
- 9.5.1. Cylindrical
- 9.5.2. Pouch
- 9.5.3. Prismatic
- 9.6. Market Analysis, Insights and Forecast - by Method
- 9.6.1. Laser
- 9.6.2. Wire
- 9.7. Market Analysis, Insights and Forecast - by Component
- 9.7.1. Anode
- 9.7.2. Cathode
- 9.7.3. Electrolyte
- 9.7.4. Separator
- 9.8. Market Analysis, Insights and Forecast - by Material Type
- 9.8.1. Cobalt
- 9.8.2. Lithium
- 9.8.3. Manganese
- 9.8.4. Natural Graphite
- 9.8.5. Nickel
- 9.8.6. Other Materials
- 9.1. Market Analysis, Insights and Forecast - by Body Type
- 10. Asia Pacific US EV Battery Pack Market Analysis, Insights and Forecast, 2019-2031
- 10.1. Market Analysis, Insights and Forecast - by Body Type
- 10.1.1. Bus
- 10.1.2. LCV
- 10.1.3. M&HDT
- 10.1.4. Passenger Car
- 10.2. Market Analysis, Insights and Forecast - by Propulsion Type
- 10.2.1. BEV
- 10.2.2. PHEV
- 10.3. Market Analysis, Insights and Forecast - by Battery Chemistry
- 10.3.1. LFP
- 10.3.2. NCA
- 10.3.3. NCM
- 10.3.4. NMC
- 10.3.5. Others
- 10.4. Market Analysis, Insights and Forecast - by Capacity
- 10.4.1. 15 kWh to 40 kWh
- 10.4.2. 40 kWh to 80 kWh
- 10.4.3. Above 80 kWh
- 10.4.4. Less than 15 kWh
- 10.5. Market Analysis, Insights and Forecast - by Battery Form
- 10.5.1. Cylindrical
- 10.5.2. Pouch
- 10.5.3. Prismatic
- 10.6. Market Analysis, Insights and Forecast - by Method
- 10.6.1. Laser
- 10.6.2. Wire
- 10.7. Market Analysis, Insights and Forecast - by Component
- 10.7.1. Anode
- 10.7.2. Cathode
- 10.7.3. Electrolyte
- 10.7.4. Separator
- 10.8. Market Analysis, Insights and Forecast - by Material Type
- 10.8.1. Cobalt
- 10.8.2. Lithium
- 10.8.3. Manganese
- 10.8.4. Natural Graphite
- 10.8.5. Nickel
- 10.8.6. Other Materials
- 10.1. Market Analysis, Insights and Forecast - by Body Type
- 11. Northeast US EV Battery Pack Market Analysis, Insights and Forecast, 2019-2031
- 12. Southeast US EV Battery Pack Market Analysis, Insights and Forecast, 2019-2031
- 13. Midwest US EV Battery Pack Market Analysis, Insights and Forecast, 2019-2031
- 14. Southwest US EV Battery Pack Market Analysis, Insights and Forecast, 2019-2031
- 15. West US EV Battery Pack Market Analysis, Insights and Forecast, 2019-2031
- 16. Competitive Analysis
- 16.1. Global Market Share Analysis 2024
- 16.2. Company Profiles
- 16.2.1 Samsung SDI Co Ltd
- 16.2.1.1. Overview
- 16.2.1.2. Products
- 16.2.1.3. SWOT Analysis
- 16.2.1.4. Recent Developments
- 16.2.1.5. Financials (Based on Availability)
- 16.2.2 LG Energy Solution Ltd
- 16.2.2.1. Overview
- 16.2.2.2. Products
- 16.2.2.3. SWOT Analysis
- 16.2.2.4. Recent Developments
- 16.2.2.5. Financials (Based on Availability)
- 16.2.3 Imperium3 New York (IM3NY)
- 16.2.3.1. Overview
- 16.2.3.2. Products
- 16.2.3.3. SWOT Analysis
- 16.2.3.4. Recent Developments
- 16.2.3.5. Financials (Based on Availability)
- 16.2.4 Contemporary Amperex Technology Co Ltd (CATL)
- 16.2.4.1. Overview
- 16.2.4.2. Products
- 16.2.4.3. SWOT Analysis
- 16.2.4.4. Recent Developments
- 16.2.4.5. Financials (Based on Availability)
- 16.2.5 Tesla Inc
- 16.2.5.1. Overview
- 16.2.5.2. Products
- 16.2.5.3. SWOT Analysis
- 16.2.5.4. Recent Developments
- 16.2.5.5. Financials (Based on Availability)
- 16.2.6 SK Innovation Co Ltd
- 16.2.6.1. Overview
- 16.2.6.2. Products
- 16.2.6.3. SWOT Analysis
- 16.2.6.4. Recent Developments
- 16.2.6.5. Financials (Based on Availability)
- 16.2.7 Ambri Inc
- 16.2.7.1. Overview
- 16.2.7.2. Products
- 16.2.7.3. SWOT Analysis
- 16.2.7.4. Recent Developments
- 16.2.7.5. Financials (Based on Availability)
- 16.2.8 Sila Nanotechnologies Inc
- 16.2.8.1. Overview
- 16.2.8.2. Products
- 16.2.8.3. SWOT Analysis
- 16.2.8.4. Recent Developments
- 16.2.8.5. Financials (Based on Availability)
- 16.2.9 Panasonic Holdings Corporation
- 16.2.9.1. Overview
- 16.2.9.2. Products
- 16.2.9.3. SWOT Analysis
- 16.2.9.4. Recent Developments
- 16.2.9.5. Financials (Based on Availability)
- 16.2.10 Envision AESC Japan Co Ltd
- 16.2.10.1. Overview
- 16.2.10.2. Products
- 16.2.10.3. SWOT Analysis
- 16.2.10.4. Recent Developments
- 16.2.10.5. Financials (Based on Availability)
- 16.2.1 Samsung SDI Co Ltd
List of Figures
- Figure 1: Global US EV Battery Pack Market Revenue Breakdown (Million, %) by Region 2024 & 2032
- Figure 2: United states US EV Battery Pack Market Revenue (Million), by Country 2024 & 2032
- Figure 3: United states US EV Battery Pack Market Revenue Share (%), by Country 2024 & 2032
- Figure 4: North America US EV Battery Pack Market Revenue (Million), by Body Type 2024 & 2032
- Figure 5: North America US EV Battery Pack Market Revenue Share (%), by Body Type 2024 & 2032
- Figure 6: North America US EV Battery Pack Market Revenue (Million), by Propulsion Type 2024 & 2032
- Figure 7: North America US EV Battery Pack Market Revenue Share (%), by Propulsion Type 2024 & 2032
- Figure 8: North America US EV Battery Pack Market Revenue (Million), by Battery Chemistry 2024 & 2032
- Figure 9: North America US EV Battery Pack Market Revenue Share (%), by Battery Chemistry 2024 & 2032
- Figure 10: North America US EV Battery Pack Market Revenue (Million), by Capacity 2024 & 2032
- Figure 11: North America US EV Battery Pack Market Revenue Share (%), by Capacity 2024 & 2032
- Figure 12: North America US EV Battery Pack Market Revenue (Million), by Battery Form 2024 & 2032
- Figure 13: North America US EV Battery Pack Market Revenue Share (%), by Battery Form 2024 & 2032
- Figure 14: North America US EV Battery Pack Market Revenue (Million), by Method 2024 & 2032
- Figure 15: North America US EV Battery Pack Market Revenue Share (%), by Method 2024 & 2032
- Figure 16: North America US EV Battery Pack Market Revenue (Million), by Component 2024 & 2032
- Figure 17: North America US EV Battery Pack Market Revenue Share (%), by Component 2024 & 2032
- Figure 18: North America US EV Battery Pack Market Revenue (Million), by Material Type 2024 & 2032
- Figure 19: North America US EV Battery Pack Market Revenue Share (%), by Material Type 2024 & 2032
- Figure 20: North America US EV Battery Pack Market Revenue (Million), by Country 2024 & 2032
- Figure 21: North America US EV Battery Pack Market Revenue Share (%), by Country 2024 & 2032
- Figure 22: South America US EV Battery Pack Market Revenue (Million), by Body Type 2024 & 2032
- Figure 23: South America US EV Battery Pack Market Revenue Share (%), by Body Type 2024 & 2032
- Figure 24: South America US EV Battery Pack Market Revenue (Million), by Propulsion Type 2024 & 2032
- Figure 25: South America US EV Battery Pack Market Revenue Share (%), by Propulsion Type 2024 & 2032
- Figure 26: South America US EV Battery Pack Market Revenue (Million), by Battery Chemistry 2024 & 2032
- Figure 27: South America US EV Battery Pack Market Revenue Share (%), by Battery Chemistry 2024 & 2032
- Figure 28: South America US EV Battery Pack Market Revenue (Million), by Capacity 2024 & 2032
- Figure 29: South America US EV Battery Pack Market Revenue Share (%), by Capacity 2024 & 2032
- Figure 30: South America US EV Battery Pack Market Revenue (Million), by Battery Form 2024 & 2032
- Figure 31: South America US EV Battery Pack Market Revenue Share (%), by Battery Form 2024 & 2032
- Figure 32: South America US EV Battery Pack Market Revenue (Million), by Method 2024 & 2032
- Figure 33: South America US EV Battery Pack Market Revenue Share (%), by Method 2024 & 2032
- Figure 34: South America US EV Battery Pack Market Revenue (Million), by Component 2024 & 2032
- Figure 35: South America US EV Battery Pack Market Revenue Share (%), by Component 2024 & 2032
- Figure 36: South America US EV Battery Pack Market Revenue (Million), by Material Type 2024 & 2032
- Figure 37: South America US EV Battery Pack Market Revenue Share (%), by Material Type 2024 & 2032
- Figure 38: South America US EV Battery Pack Market Revenue (Million), by Country 2024 & 2032
- Figure 39: South America US EV Battery Pack Market Revenue Share (%), by Country 2024 & 2032
- Figure 40: Europe US EV Battery Pack Market Revenue (Million), by Body Type 2024 & 2032
- Figure 41: Europe US EV Battery Pack Market Revenue Share (%), by Body Type 2024 & 2032
- Figure 42: Europe US EV Battery Pack Market Revenue (Million), by Propulsion Type 2024 & 2032
- Figure 43: Europe US EV Battery Pack Market Revenue Share (%), by Propulsion Type 2024 & 2032
- Figure 44: Europe US EV Battery Pack Market Revenue (Million), by Battery Chemistry 2024 & 2032
- Figure 45: Europe US EV Battery Pack Market Revenue Share (%), by Battery Chemistry 2024 & 2032
- Figure 46: Europe US EV Battery Pack Market Revenue (Million), by Capacity 2024 & 2032
- Figure 47: Europe US EV Battery Pack Market Revenue Share (%), by Capacity 2024 & 2032
- Figure 48: Europe US EV Battery Pack Market Revenue (Million), by Battery Form 2024 & 2032
- Figure 49: Europe US EV Battery Pack Market Revenue Share (%), by Battery Form 2024 & 2032
- Figure 50: Europe US EV Battery Pack Market Revenue (Million), by Method 2024 & 2032
- Figure 51: Europe US EV Battery Pack Market Revenue Share (%), by Method 2024 & 2032
- Figure 52: Europe US EV Battery Pack Market Revenue (Million), by Component 2024 & 2032
- Figure 53: Europe US EV Battery Pack Market Revenue Share (%), by Component 2024 & 2032
- Figure 54: Europe US EV Battery Pack Market Revenue (Million), by Material Type 2024 & 2032
- Figure 55: Europe US EV Battery Pack Market Revenue Share (%), by Material Type 2024 & 2032
- Figure 56: Europe US EV Battery Pack Market Revenue (Million), by Country 2024 & 2032
- Figure 57: Europe US EV Battery Pack Market Revenue Share (%), by Country 2024 & 2032
- Figure 58: Middle East & Africa US EV Battery Pack Market Revenue (Million), by Body Type 2024 & 2032
- Figure 59: Middle East & Africa US EV Battery Pack Market Revenue Share (%), by Body Type 2024 & 2032
- Figure 60: Middle East & Africa US EV Battery Pack Market Revenue (Million), by Propulsion Type 2024 & 2032
- Figure 61: Middle East & Africa US EV Battery Pack Market Revenue Share (%), by Propulsion Type 2024 & 2032
- Figure 62: Middle East & Africa US EV Battery Pack Market Revenue (Million), by Battery Chemistry 2024 & 2032
- Figure 63: Middle East & Africa US EV Battery Pack Market Revenue Share (%), by Battery Chemistry 2024 & 2032
- Figure 64: Middle East & Africa US EV Battery Pack Market Revenue (Million), by Capacity 2024 & 2032
- Figure 65: Middle East & Africa US EV Battery Pack Market Revenue Share (%), by Capacity 2024 & 2032
- Figure 66: Middle East & Africa US EV Battery Pack Market Revenue (Million), by Battery Form 2024 & 2032
- Figure 67: Middle East & Africa US EV Battery Pack Market Revenue Share (%), by Battery Form 2024 & 2032
- Figure 68: Middle East & Africa US EV Battery Pack Market Revenue (Million), by Method 2024 & 2032
- Figure 69: Middle East & Africa US EV Battery Pack Market Revenue Share (%), by Method 2024 & 2032
- Figure 70: Middle East & Africa US EV Battery Pack Market Revenue (Million), by Component 2024 & 2032
- Figure 71: Middle East & Africa US EV Battery Pack Market Revenue Share (%), by Component 2024 & 2032
- Figure 72: Middle East & Africa US EV Battery Pack Market Revenue (Million), by Material Type 2024 & 2032
- Figure 73: Middle East & Africa US EV Battery Pack Market Revenue Share (%), by Material Type 2024 & 2032
- Figure 74: Middle East & Africa US EV Battery Pack Market Revenue (Million), by Country 2024 & 2032
- Figure 75: Middle East & Africa US EV Battery Pack Market Revenue Share (%), by Country 2024 & 2032
- Figure 76: Asia Pacific US EV Battery Pack Market Revenue (Million), by Body Type 2024 & 2032
- Figure 77: Asia Pacific US EV Battery Pack Market Revenue Share (%), by Body Type 2024 & 2032
- Figure 78: Asia Pacific US EV Battery Pack Market Revenue (Million), by Propulsion Type 2024 & 2032
- Figure 79: Asia Pacific US EV Battery Pack Market Revenue Share (%), by Propulsion Type 2024 & 2032
- Figure 80: Asia Pacific US EV Battery Pack Market Revenue (Million), by Battery Chemistry 2024 & 2032
- Figure 81: Asia Pacific US EV Battery Pack Market Revenue Share (%), by Battery Chemistry 2024 & 2032
- Figure 82: Asia Pacific US EV Battery Pack Market Revenue (Million), by Capacity 2024 & 2032
- Figure 83: Asia Pacific US EV Battery Pack Market Revenue Share (%), by Capacity 2024 & 2032
- Figure 84: Asia Pacific US EV Battery Pack Market Revenue (Million), by Battery Form 2024 & 2032
- Figure 85: Asia Pacific US EV Battery Pack Market Revenue Share (%), by Battery Form 2024 & 2032
- Figure 86: Asia Pacific US EV Battery Pack Market Revenue (Million), by Method 2024 & 2032
- Figure 87: Asia Pacific US EV Battery Pack Market Revenue Share (%), by Method 2024 & 2032
- Figure 88: Asia Pacific US EV Battery Pack Market Revenue (Million), by Component 2024 & 2032
- Figure 89: Asia Pacific US EV Battery Pack Market Revenue Share (%), by Component 2024 & 2032
- Figure 90: Asia Pacific US EV Battery Pack Market Revenue (Million), by Material Type 2024 & 2032
- Figure 91: Asia Pacific US EV Battery Pack Market Revenue Share (%), by Material Type 2024 & 2032
- Figure 92: Asia Pacific US EV Battery Pack Market Revenue (Million), by Country 2024 & 2032
- Figure 93: Asia Pacific US EV Battery Pack Market Revenue Share (%), by Country 2024 & 2032
List of Tables
- Table 1: Global US EV Battery Pack Market Revenue Million Forecast, by Region 2019 & 2032
- Table 2: Global US EV Battery Pack Market Revenue Million Forecast, by Body Type 2019 & 2032
- Table 3: Global US EV Battery Pack Market Revenue Million Forecast, by Propulsion Type 2019 & 2032
- Table 4: Global US EV Battery Pack Market Revenue Million Forecast, by Battery Chemistry 2019 & 2032
- Table 5: Global US EV Battery Pack Market Revenue Million Forecast, by Capacity 2019 & 2032
- Table 6: Global US EV Battery Pack Market Revenue Million Forecast, by Battery Form 2019 & 2032
- Table 7: Global US EV Battery Pack Market Revenue Million Forecast, by Method 2019 & 2032
- Table 8: Global US EV Battery Pack Market Revenue Million Forecast, by Component 2019 & 2032
- Table 9: Global US EV Battery Pack Market Revenue Million Forecast, by Material Type 2019 & 2032
- Table 10: Global US EV Battery Pack Market Revenue Million Forecast, by Region 2019 & 2032
- Table 11: Global US EV Battery Pack Market Revenue Million Forecast, by Country 2019 & 2032
- Table 12: Northeast US EV Battery Pack Market Revenue (Million) Forecast, by Application 2019 & 2032
- Table 13: Southeast US EV Battery Pack Market Revenue (Million) Forecast, by Application 2019 & 2032
- Table 14: Midwest US EV Battery Pack Market Revenue (Million) Forecast, by Application 2019 & 2032
- Table 15: Southwest US EV Battery Pack Market Revenue (Million) Forecast, by Application 2019 & 2032
- Table 16: West US EV Battery Pack Market Revenue (Million) Forecast, by Application 2019 & 2032
- Table 17: Global US EV Battery Pack Market Revenue Million Forecast, by Body Type 2019 & 2032
- Table 18: Global US EV Battery Pack Market Revenue Million Forecast, by Propulsion Type 2019 & 2032
- Table 19: Global US EV Battery Pack Market Revenue Million Forecast, by Battery Chemistry 2019 & 2032
- Table 20: Global US EV Battery Pack Market Revenue Million Forecast, by Capacity 2019 & 2032
- Table 21: Global US EV Battery Pack Market Revenue Million Forecast, by Battery Form 2019 & 2032
- Table 22: Global US EV Battery Pack Market Revenue Million Forecast, by Method 2019 & 2032
- Table 23: Global US EV Battery Pack Market Revenue Million Forecast, by Component 2019 & 2032
- Table 24: Global US EV Battery Pack Market Revenue Million Forecast, by Material Type 2019 & 2032
- Table 25: Global US EV Battery Pack Market Revenue Million Forecast, by Country 2019 & 2032
- Table 26: United States US EV Battery Pack Market Revenue (Million) Forecast, by Application 2019 & 2032
- Table 27: Canada US EV Battery Pack Market Revenue (Million) Forecast, by Application 2019 & 2032
- Table 28: Mexico US EV Battery Pack Market Revenue (Million) Forecast, by Application 2019 & 2032
- Table 29: Global US EV Battery Pack Market Revenue Million Forecast, by Body Type 2019 & 2032
- Table 30: Global US EV Battery Pack Market Revenue Million Forecast, by Propulsion Type 2019 & 2032
- Table 31: Global US EV Battery Pack Market Revenue Million Forecast, by Battery Chemistry 2019 & 2032
- Table 32: Global US EV Battery Pack Market Revenue Million Forecast, by Capacity 2019 & 2032
- Table 33: Global US EV Battery Pack Market Revenue Million Forecast, by Battery Form 2019 & 2032
- Table 34: Global US EV Battery Pack Market Revenue Million Forecast, by Method 2019 & 2032
- Table 35: Global US EV Battery Pack Market Revenue Million Forecast, by Component 2019 & 2032
- Table 36: Global US EV Battery Pack Market Revenue Million Forecast, by Material Type 2019 & 2032
- Table 37: Global US EV Battery Pack Market Revenue Million Forecast, by Country 2019 & 2032
- Table 38: Brazil US EV Battery Pack Market Revenue (Million) Forecast, by Application 2019 & 2032
- Table 39: Argentina US EV Battery Pack Market Revenue (Million) Forecast, by Application 2019 & 2032
- Table 40: Rest of South America US EV Battery Pack Market Revenue (Million) Forecast, by Application 2019 & 2032
- Table 41: Global US EV Battery Pack Market Revenue Million Forecast, by Body Type 2019 & 2032
- Table 42: Global US EV Battery Pack Market Revenue Million Forecast, by Propulsion Type 2019 & 2032
- Table 43: Global US EV Battery Pack Market Revenue Million Forecast, by Battery Chemistry 2019 & 2032
- Table 44: Global US EV Battery Pack Market Revenue Million Forecast, by Capacity 2019 & 2032
- Table 45: Global US EV Battery Pack Market Revenue Million Forecast, by Battery Form 2019 & 2032
- Table 46: Global US EV Battery Pack Market Revenue Million Forecast, by Method 2019 & 2032
- Table 47: Global US EV Battery Pack Market Revenue Million Forecast, by Component 2019 & 2032
- Table 48: Global US EV Battery Pack Market Revenue Million Forecast, by Material Type 2019 & 2032
- Table 49: Global US EV Battery Pack Market Revenue Million Forecast, by Country 2019 & 2032
- Table 50: United Kingdom US EV Battery Pack Market Revenue (Million) Forecast, by Application 2019 & 2032
- Table 51: Germany US EV Battery Pack Market Revenue (Million) Forecast, by Application 2019 & 2032
- Table 52: France US EV Battery Pack Market Revenue (Million) Forecast, by Application 2019 & 2032
- Table 53: Italy US EV Battery Pack Market Revenue (Million) Forecast, by Application 2019 & 2032
- Table 54: Spain US EV Battery Pack Market Revenue (Million) Forecast, by Application 2019 & 2032
- Table 55: Russia US EV Battery Pack Market Revenue (Million) Forecast, by Application 2019 & 2032
- Table 56: Benelux US EV Battery Pack Market Revenue (Million) Forecast, by Application 2019 & 2032
- Table 57: Nordics US EV Battery Pack Market Revenue (Million) Forecast, by Application 2019 & 2032
- Table 58: Rest of Europe US EV Battery Pack Market Revenue (Million) Forecast, by Application 2019 & 2032
- Table 59: Global US EV Battery Pack Market Revenue Million Forecast, by Body Type 2019 & 2032
- Table 60: Global US EV Battery Pack Market Revenue Million Forecast, by Propulsion Type 2019 & 2032
- Table 61: Global US EV Battery Pack Market Revenue Million Forecast, by Battery Chemistry 2019 & 2032
- Table 62: Global US EV Battery Pack Market Revenue Million Forecast, by Capacity 2019 & 2032
- Table 63: Global US EV Battery Pack Market Revenue Million Forecast, by Battery Form 2019 & 2032
- Table 64: Global US EV Battery Pack Market Revenue Million Forecast, by Method 2019 & 2032
- Table 65: Global US EV Battery Pack Market Revenue Million Forecast, by Component 2019 & 2032
- Table 66: Global US EV Battery Pack Market Revenue Million Forecast, by Material Type 2019 & 2032
- Table 67: Global US EV Battery Pack Market Revenue Million Forecast, by Country 2019 & 2032
- Table 68: Turkey US EV Battery Pack Market Revenue (Million) Forecast, by Application 2019 & 2032
- Table 69: Israel US EV Battery Pack Market Revenue (Million) Forecast, by Application 2019 & 2032
- Table 70: GCC US EV Battery Pack Market Revenue (Million) Forecast, by Application 2019 & 2032
- Table 71: North Africa US EV Battery Pack Market Revenue (Million) Forecast, by Application 2019 & 2032
- Table 72: South Africa US EV Battery Pack Market Revenue (Million) Forecast, by Application 2019 & 2032
- Table 73: Rest of Middle East & Africa US EV Battery Pack Market Revenue (Million) Forecast, by Application 2019 & 2032
- Table 74: Global US EV Battery Pack Market Revenue Million Forecast, by Body Type 2019 & 2032
- Table 75: Global US EV Battery Pack Market Revenue Million Forecast, by Propulsion Type 2019 & 2032
- Table 76: Global US EV Battery Pack Market Revenue Million Forecast, by Battery Chemistry 2019 & 2032
- Table 77: Global US EV Battery Pack Market Revenue Million Forecast, by Capacity 2019 & 2032
- Table 78: Global US EV Battery Pack Market Revenue Million Forecast, by Battery Form 2019 & 2032
- Table 79: Global US EV Battery Pack Market Revenue Million Forecast, by Method 2019 & 2032
- Table 80: Global US EV Battery Pack Market Revenue Million Forecast, by Component 2019 & 2032
- Table 81: Global US EV Battery Pack Market Revenue Million Forecast, by Material Type 2019 & 2032
- Table 82: Global US EV Battery Pack Market Revenue Million Forecast, by Country 2019 & 2032
- Table 83: China US EV Battery Pack Market Revenue (Million) Forecast, by Application 2019 & 2032
- Table 84: India US EV Battery Pack Market Revenue (Million) Forecast, by Application 2019 & 2032
- Table 85: Japan US EV Battery Pack Market Revenue (Million) Forecast, by Application 2019 & 2032
- Table 86: South Korea US EV Battery Pack Market Revenue (Million) Forecast, by Application 2019 & 2032
- Table 87: ASEAN US EV Battery Pack Market Revenue (Million) Forecast, by Application 2019 & 2032
- Table 88: Oceania US EV Battery Pack Market Revenue (Million) Forecast, by Application 2019 & 2032
- Table 89: Rest of Asia Pacific US EV Battery Pack Market Revenue (Million) Forecast, by Application 2019 & 2032
Frequently Asked Questions
1. What is the projected Compound Annual Growth Rate (CAGR) of the US EV Battery Pack Market?
The projected CAGR is approximately > 6.50%.
2. Which companies are prominent players in the US EV Battery Pack Market?
Key companies in the market include Samsung SDI Co Ltd, LG Energy Solution Ltd, Imperium3 New York (IM3NY), Contemporary Amperex Technology Co Ltd (CATL), Tesla Inc, SK Innovation Co Ltd, Ambri Inc, Sila Nanotechnologies Inc, Panasonic Holdings Corporation, Envision AESC Japan Co Ltd.
3. What are the main segments of the US EV Battery Pack Market?
The market segments include Body Type, Propulsion Type, Battery Chemistry, Capacity, Battery Form, Method, Component, Material Type.
4. Can you provide details about the market size?
The market size is estimated to be USD XX Million as of 2022.
5. What are some drivers contributing to market growth?
Increasing Demand and Sales of Commercial Vehicles is Driving the Market for Hydraulic Systems.
6. What are the notable trends driving market growth?
OTHER KEY INDUSTRY TRENDS COVERED IN THE REPORT.
7. Are there any restraints impacting market growth?
Increasing Replacement of Conventional Hydraulic Systems with Fully-electric Hydraulic Systems Acts as a Restraint.
8. Can you provide examples of recent developments in the market?
June 2023: CATL will invest USD 1.4 billion in helping Bolivia develop its huge but largely untapped reserves of lithium. Following a meeting with CATL executives on June 25, Bolivian President Luis Arce confirmed the commitment to build two lithium plants to extract minerals from the country’s Uyuni and Oruro salt flats. Construction of both plants could begin as soon as July, according to the country’s energy ministry.March 2023: Tesla was reported to be in talks with Contemporary Amperex Technology Co. Ltd. (CATL) regarding plans to build a battery factory in the U.S., according to sources familiar with the matter.January 2023: Tesla has announced a new investment of USD 3.6 billion to expand its Gigafactory Nevada complex, hire 3,000 additional employees, and construct two new facilities on the site, including a 100 GWh 4680 cell factory.
9. What pricing options are available for accessing the report?
Pricing options include single-user, multi-user, and enterprise licenses priced at USD 3800, USD 4500, and USD 5800 respectively.
10. Is the market size provided in terms of value or volume?
The market size is provided in terms of value, measured in Million.
11. Are there any specific market keywords associated with the report?
Yes, the market keyword associated with the report is "US EV Battery Pack Market," which aids in identifying and referencing the specific market segment covered.
12. How do I determine which pricing option suits my needs best?
The pricing options vary based on user requirements and access needs. Individual users may opt for single-user licenses, while businesses requiring broader access may choose multi-user or enterprise licenses for cost-effective access to the report.
13. Are there any additional resources or data provided in the US EV Battery Pack Market report?
While the report offers comprehensive insights, it's advisable to review the specific contents or supplementary materials provided to ascertain if additional resources or data are available.
14. How can I stay updated on further developments or reports in the US EV Battery Pack Market?
To stay informed about further developments, trends, and reports in the US EV Battery Pack Market, consider subscribing to industry newsletters, following relevant companies and organizations, or regularly checking reputable industry news sources and publications.
Methodology
Step 1 - Identification of Relevant Samples Size from Population Database


Step 2 - Approaches for Defining Global Market Size (Value, Volume* & Price*)

Note*: In applicable scenarios
Step 3 - Data Sources
Primary Research
- Web Analytics
- Survey Reports
- Research Institute
- Latest Research Reports
- Opinion Leaders
Secondary Research
- Annual Reports
- White Paper
- Latest Press Release
- Industry Association
- Paid Database
- Investor Presentations

Step 4 - Data Triangulation
Involves using different sources of information in order to increase the validity of a study
These sources are likely to be stakeholders in a program - participants, other researchers, program staff, other community members, and so on.
Then we put all data in single framework & apply various statistical tools to find out the dynamic on the market.
During the analysis stage, feedback from the stakeholder groups would be compared to determine areas of agreement as well as areas of divergence


