
Key Insights
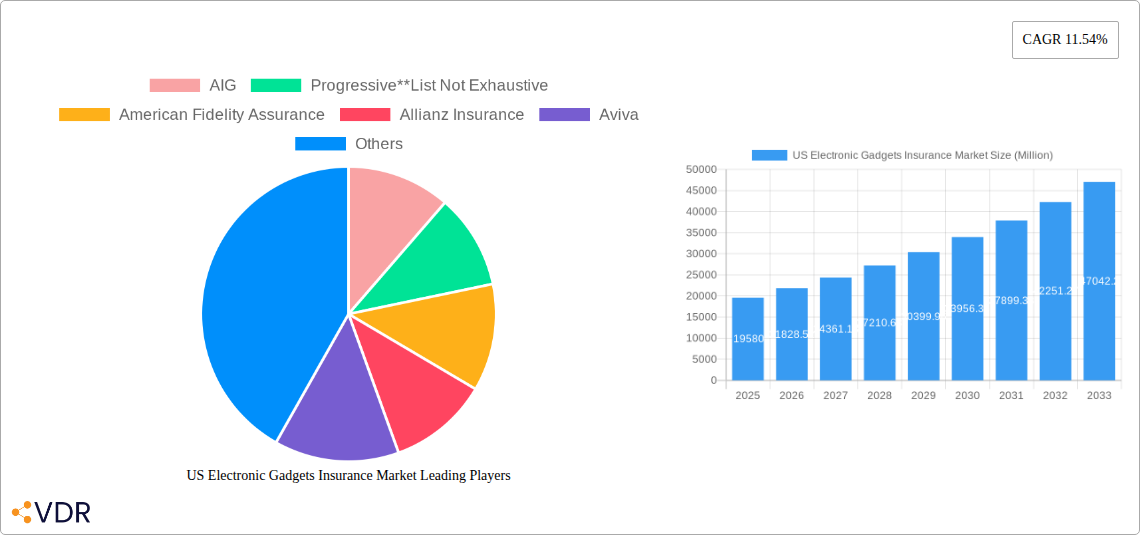
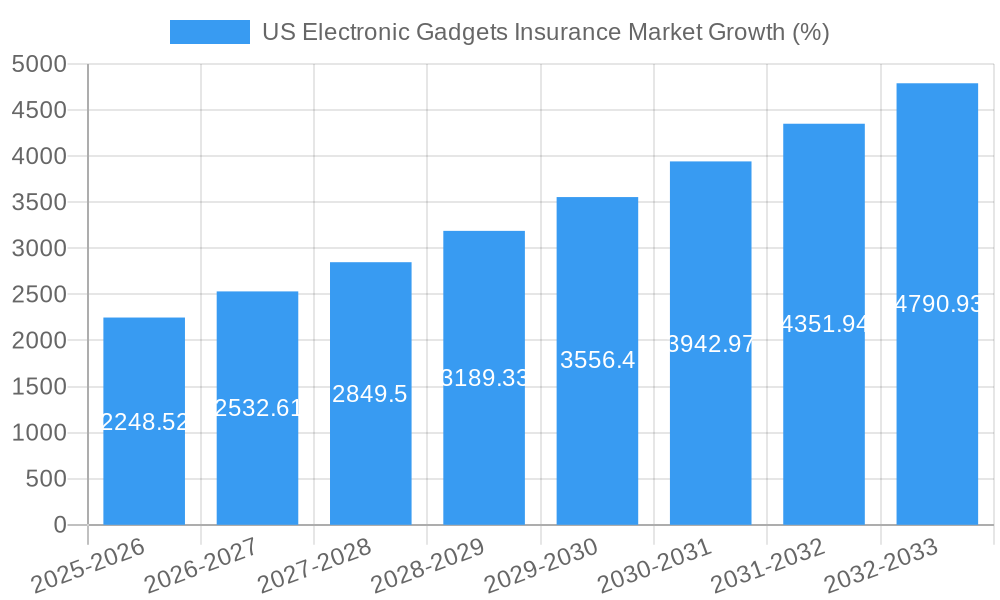
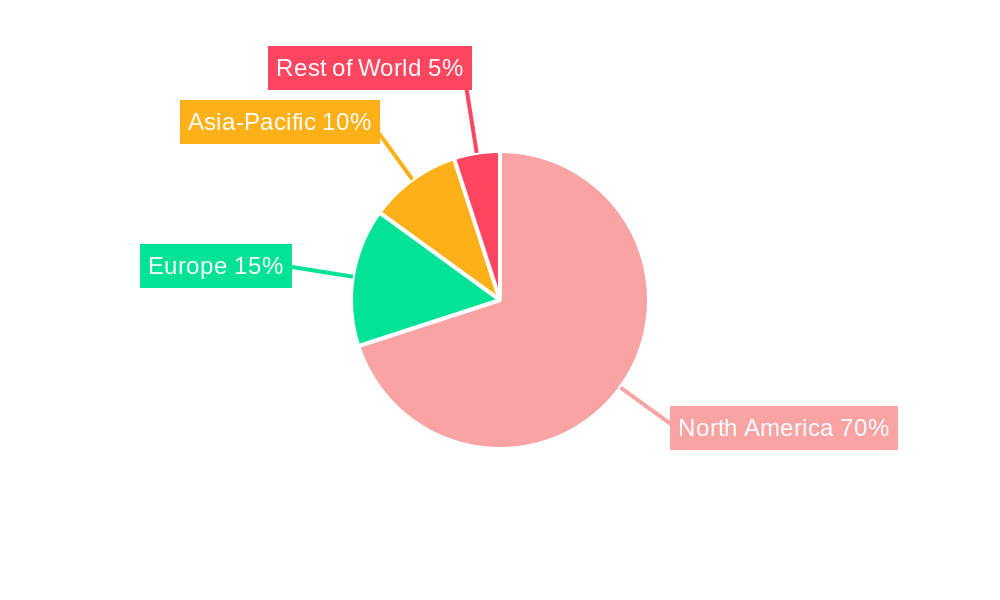
The US electronic gadgets insurance market is experiencing robust growth, projected to reach a substantial size driven by increasing consumer electronics ownership and the rising value of these devices. The market's Compound Annual Growth Rate (CAGR) of 11.54% from 2019 to 2024 indicates significant market expansion. This growth is fueled by several factors. Firstly, the increasing prevalence of smartphones, laptops, and other smart devices among both individuals and corporations creates a higher demand for protection against loss, theft, and accidental damage. Secondly, the rising cost of repairing or replacing these gadgets makes insurance a more appealing option. Furthermore, evolving insurance product offerings, such as bundled packages covering multiple devices or extended warranties, are driving market penetration. Segmentation reveals strong demand across various device types, with mobile devices and laptops leading the way, followed by cameras, computers, and drones. Both individual and corporate end-users contribute significantly to the market's overall size. The competitive landscape includes established players like AIG, Progressive, Allianz, and others, highlighting market maturity and the presence of both specialized insurers and broader financial services companies. Geographic focus on North America (particularly the US, Canada, and Mexico) suggests a strong regional concentration, reflective of high tech adoption rates and consumer spending patterns.
Looking ahead, from 2025 to 2033, the market is expected to continue its upward trajectory, influenced by further technological advancements, increased device affordability, and enhanced consumer awareness of insurance benefits. However, potential restraints include fluctuating economic conditions that could impact consumer spending and the emergence of alternative warranty and repair options. The market is likely to see continued innovation in product offerings, with a focus on personalized insurance plans catering to specific user needs and device types. Further segmentation based on insurance plan features (e.g., deductible amounts, coverage limits) will also contribute to market sophistication and growth. The sustained growth is anticipated to create opportunities for both existing and new market entrants, fostering a competitive landscape of innovation and expanding coverage options for consumers and businesses alike.
US Electronic Gadgets Insurance Market Report: 2019-2033
This comprehensive report provides a detailed analysis of the US Electronic Gadgets Insurance market, encompassing its current state, future trends, and key players. With a focus on parent markets (Insurance) and child markets (Electronic Gadget Insurance), this report offers invaluable insights for industry professionals, investors, and strategists. The study period covers 2019-2033, with 2025 as the base and estimated year. The forecast period is 2025-2033, and the historical period is 2019-2024. The market size is presented in Million units.
US Electronic Gadgets Insurance Market Dynamics & Structure
This section analyzes the market's competitive landscape, technological advancements, regulatory environment, and market trends. The US Electronic Gadgets Insurance market is characterized by a moderately concentrated structure, with key players holding significant market share. However, the market is witnessing increased competition from new entrants offering specialized or niche products. Technological innovations, particularly in areas such as IoT and AI-driven risk assessment, are driving market growth. Regulatory frameworks, including data privacy regulations and insurance licensing requirements, significantly impact market operations.
- Market Concentration: The top 5 players account for approximately xx% of the market share in 2025. (Further breakdown available in the full report).
- Technological Innovation Drivers: Advancements in IoT, AI, and big data analytics are enabling more accurate risk assessment and personalized insurance offerings.
- Regulatory Frameworks: Compliance with state-level insurance regulations and data privacy laws like CCPA and GDPR significantly influence market dynamics.
- Competitive Product Substitutes: Self-insurance, manufacturer warranties, and extended warranties act as substitutes, impacting market growth.
- End-User Demographics: The market is driven by increasing ownership of electronic gadgets among both individuals and corporations.
- M&A Trends: The number of M&A deals in the US Electronic Gadgets Insurance market increased to xx in 2024, driven by a need for expansion and technological integration.
US Electronic Gadgets Insurance Market Growth Trends & Insights
The US Electronic Gadgets Insurance market is experiencing robust growth, driven by several key factors. The market size increased from xx million units in 2019 to xx million units in 2024, exhibiting a CAGR of xx% during the historical period. This growth is anticipated to continue during the forecast period (2025-2033), with a projected CAGR of xx%. Increased adoption of smartphones, laptops, and other electronic gadgets, coupled with rising awareness of the need for insurance coverage against theft, loss, and accidental damage, are contributing to this growth. Technological advancements, such as embedded insurance and AI-powered claims processing, are further boosting market expansion. Consumer behavior shifts, including increasing online purchase of insurance products, are also influencing market growth. The full report provides a comprehensive analysis, including market penetration rates across different segments.
Dominant Regions, Countries, or Segments in US Electronic Gadgets Insurance Market
The US Electronic Gadgets Insurance market exhibits significant regional variations in growth. California, New York, and Texas are the leading states, driven by high adoption rates of electronic gadgets and a thriving tech industry. In terms of segments, the Accidental Damage coverage type holds the largest market share, followed by Theft and Loss. Within device types, Mobile Devices lead, showcasing substantial growth potential. The Individual end-user segment accounts for a larger share than the Corporate segment.
- Key Drivers:
- High penetration of smartphones and other electronic devices.
- Increasing awareness of the risks associated with gadget damage and loss.
- Growing preference for online purchase and claims processing.
- Dominance Factors:
- High population density and electronic device ownership in leading states.
- Growing demand for comprehensive insurance coverage.
- Favorable regulatory environment in certain regions.
US Electronic Gadgets Insurance Market Product Landscape
The market offers a range of products catering to diverse needs, including standalone gadget insurance policies, bundled packages with mobile phone plans, and extended warranties. Innovations focus on enhancing customer experience through AI-powered claims processing, personalized risk assessment, and seamless integration with digital platforms. Unique selling propositions include features such as 24/7 customer support, fast claims processing, and coverage for a wide array of devices. Technological advancements enable real-time tracking of devices, predictive analytics for risk assessment, and improved fraud detection mechanisms.
Key Drivers, Barriers & Challenges in US Electronic Gadgets Insurance Market
Key Drivers: Rising electronic gadget ownership, increasing awareness of the need for insurance, technological advancements in risk assessment and claims processing, and favorable regulatory changes.
Key Barriers & Challenges: High competition, pressure on pricing, claims fraud, regulatory complexities, and supply chain disruptions related to device repair and replacement. These challenges result in a xx% reduction in profit margins for the industry.
Emerging Opportunities in US Electronic Gadgets Insurance Market
Emerging opportunities include expansion into untapped markets (e.g., rural areas), the development of innovative insurance products for emerging technologies (e.g., wearables, smart home devices), and catering to specific consumer segments (e.g., gamers, photographers). The integration of embedded insurance within e-commerce platforms presents another significant opportunity for growth. Further opportunities lie in offering customized insurance packages based on individual risk profiles and device usage patterns.
Growth Accelerators in the US Electronic Gadgets Insurance Market Industry
Technological breakthroughs in AI and IoT are enabling more efficient and personalized insurance services. Strategic partnerships between insurers and technology providers, as well as expansion into new geographic markets and product categories, will drive long-term growth. The increasing adoption of digital distribution channels and improved customer service mechanisms also serve as key growth accelerators.
Key Players Shaping the US Electronic Gadgets Insurance Market Market
- AIG
- Progressive
- American Fidelity Assurance
- Allianz Insurance
- Aviva
- AXA
- Chubb
- Assurant Inc
- AT&T Inc
- Amica Mutual Insurance
Notable Milestones in US Electronic Gadgets Insurance Sector
- October 2023: Bolttech and Allianz Partners partnered to launch insurance solutions for embedded devices and appliances in the United States. This partnership expands the reach of insurance solutions to a wider range of products.
- February 2023: Moonrock Insurance, in collaboration with Apollo Insurance, unveiled an innovative drone insurance offering. This signifies the market expansion into niche areas.
In-Depth US Electronic Gadgets Insurance Market Outlook
The US Electronic Gadgets Insurance market is poised for continued strong growth, driven by ongoing technological advancements, increasing device ownership, and the expansion of insurance offerings into new product categories. Strategic partnerships and innovative product development will be key to success in this competitive market. The market's future potential lies in leveraging data analytics to personalize insurance offerings, enhancing customer experience through seamless digital integration, and expanding into the rapidly growing market for connected devices.
US Electronic Gadgets Insurance Market Segmentation
-
1. Coverage Type
- 1.1. Accidental Damage
- 1.2. Theft and Loss
-
2. Device Type
- 2.1. Laptops
- 2.2. Computers
- 2.3. Cameras
- 2.4. Mobile Devices
- 2.5. Drones
-
3. End Users
- 3.1. Corporate
- 3.2. Individual
US Electronic Gadgets Insurance Market Segmentation By Geography
-
1. North America
- 1.1. United States
- 1.2. Canada
- 1.3. Mexico
-
2. South America
- 2.1. Brazil
- 2.2. Argentina
- 2.3. Rest of South America
-
3. Europe
- 3.1. United Kingdom
- 3.2. Germany
- 3.3. France
- 3.4. Italy
- 3.5. Spain
- 3.6. Russia
- 3.7. Benelux
- 3.8. Nordics
- 3.9. Rest of Europe
-
4. Middle East & Africa
- 4.1. Turkey
- 4.2. Israel
- 4.3. GCC
- 4.4. North Africa
- 4.5. South Africa
- 4.6. Rest of Middle East & Africa
-
5. Asia Pacific
- 5.1. China
- 5.2. India
- 5.3. Japan
- 5.4. South Korea
- 5.5. ASEAN
- 5.6. Oceania
- 5.7. Rest of Asia Pacific
US Electronic Gadgets Insurance Market REPORT HIGHLIGHTS
| Aspects | Details |
|---|---|
| Study Period | 2019-2033 |
| Base Year | 2024 |
| Estimated Year | 2025 |
| Forecast Period | 2025-2033 |
| Historical Period | 2019-2024 |
| Growth Rate | CAGR of 11.54% from 2019-2033 |
| Segmentation |
|
Table of Contents
- 1. Introduction
- 1.1. Research Scope
- 1.2. Market Segmentation
- 1.3. Research Methodology
- 1.4. Definitions and Assumptions
- 2. Executive Summary
- 2.1. Introduction
- 3. Market Dynamics
- 3.1. Introduction
- 3.2. Market Drivers
- 3.2.1. Increse in Consumer spending for Electronic gadgets.; Rising living living standard of the the people
- 3.3. Market Restrains
- 3.3.1. Fluctuation in price of electronic gadgets raw material.; Fragmented market in electronic gadgets insurance business
- 3.4. Market Trends
- 3.4.1. Increase In Demand For Electronic Gadget Post Pandemic
- 4. Market Factor Analysis
- 4.1. Porters Five Forces
- 4.2. Supply/Value Chain
- 4.3. PESTEL analysis
- 4.4. Market Entropy
- 4.5. Patent/Trademark Analysis
- 5. Global US Electronic Gadgets Insurance Market Analysis, Insights and Forecast, 2019-2031
- 5.1. Market Analysis, Insights and Forecast - by Coverage Type
- 5.1.1. Accidental Damage
- 5.1.2. Theft and Loss
- 5.2. Market Analysis, Insights and Forecast - by Device Type
- 5.2.1. Laptops
- 5.2.2. Computers
- 5.2.3. Cameras
- 5.2.4. Mobile Devices
- 5.2.5. Drones
- 5.3. Market Analysis, Insights and Forecast - by End Users
- 5.3.1. Corporate
- 5.3.2. Individual
- 5.4. Market Analysis, Insights and Forecast - by Region
- 5.4.1. North America
- 5.4.2. South America
- 5.4.3. Europe
- 5.4.4. Middle East & Africa
- 5.4.5. Asia Pacific
- 5.1. Market Analysis, Insights and Forecast - by Coverage Type
- 6. North America US Electronic Gadgets Insurance Market Analysis, Insights and Forecast, 2019-2031
- 6.1. Market Analysis, Insights and Forecast - by Coverage Type
- 6.1.1. Accidental Damage
- 6.1.2. Theft and Loss
- 6.2. Market Analysis, Insights and Forecast - by Device Type
- 6.2.1. Laptops
- 6.2.2. Computers
- 6.2.3. Cameras
- 6.2.4. Mobile Devices
- 6.2.5. Drones
- 6.3. Market Analysis, Insights and Forecast - by End Users
- 6.3.1. Corporate
- 6.3.2. Individual
- 6.1. Market Analysis, Insights and Forecast - by Coverage Type
- 7. South America US Electronic Gadgets Insurance Market Analysis, Insights and Forecast, 2019-2031
- 7.1. Market Analysis, Insights and Forecast - by Coverage Type
- 7.1.1. Accidental Damage
- 7.1.2. Theft and Loss
- 7.2. Market Analysis, Insights and Forecast - by Device Type
- 7.2.1. Laptops
- 7.2.2. Computers
- 7.2.3. Cameras
- 7.2.4. Mobile Devices
- 7.2.5. Drones
- 7.3. Market Analysis, Insights and Forecast - by End Users
- 7.3.1. Corporate
- 7.3.2. Individual
- 7.1. Market Analysis, Insights and Forecast - by Coverage Type
- 8. Europe US Electronic Gadgets Insurance Market Analysis, Insights and Forecast, 2019-2031
- 8.1. Market Analysis, Insights and Forecast - by Coverage Type
- 8.1.1. Accidental Damage
- 8.1.2. Theft and Loss
- 8.2. Market Analysis, Insights and Forecast - by Device Type
- 8.2.1. Laptops
- 8.2.2. Computers
- 8.2.3. Cameras
- 8.2.4. Mobile Devices
- 8.2.5. Drones
- 8.3. Market Analysis, Insights and Forecast - by End Users
- 8.3.1. Corporate
- 8.3.2. Individual
- 8.1. Market Analysis, Insights and Forecast - by Coverage Type
- 9. Middle East & Africa US Electronic Gadgets Insurance Market Analysis, Insights and Forecast, 2019-2031
- 9.1. Market Analysis, Insights and Forecast - by Coverage Type
- 9.1.1. Accidental Damage
- 9.1.2. Theft and Loss
- 9.2. Market Analysis, Insights and Forecast - by Device Type
- 9.2.1. Laptops
- 9.2.2. Computers
- 9.2.3. Cameras
- 9.2.4. Mobile Devices
- 9.2.5. Drones
- 9.3. Market Analysis, Insights and Forecast - by End Users
- 9.3.1. Corporate
- 9.3.2. Individual
- 9.1. Market Analysis, Insights and Forecast - by Coverage Type
- 10. Asia Pacific US Electronic Gadgets Insurance Market Analysis, Insights and Forecast, 2019-2031
- 10.1. Market Analysis, Insights and Forecast - by Coverage Type
- 10.1.1. Accidental Damage
- 10.1.2. Theft and Loss
- 10.2. Market Analysis, Insights and Forecast - by Device Type
- 10.2.1. Laptops
- 10.2.2. Computers
- 10.2.3. Cameras
- 10.2.4. Mobile Devices
- 10.2.5. Drones
- 10.3. Market Analysis, Insights and Forecast - by End Users
- 10.3.1. Corporate
- 10.3.2. Individual
- 10.1. Market Analysis, Insights and Forecast - by Coverage Type
- 11. United States US Electronic Gadgets Insurance Market Analysis, Insights and Forecast, 2019-2031
- 12. Canada US Electronic Gadgets Insurance Market Analysis, Insights and Forecast, 2019-2031
- 13. Mexico US Electronic Gadgets Insurance Market Analysis, Insights and Forecast, 2019-2031
- 14. Competitive Analysis
- 14.1. Global Market Share Analysis 2024
- 14.2. Company Profiles
- 14.2.1 AIG
- 14.2.1.1. Overview
- 14.2.1.2. Products
- 14.2.1.3. SWOT Analysis
- 14.2.1.4. Recent Developments
- 14.2.1.5. Financials (Based on Availability)
- 14.2.2 Progressive**List Not Exhaustive
- 14.2.2.1. Overview
- 14.2.2.2. Products
- 14.2.2.3. SWOT Analysis
- 14.2.2.4. Recent Developments
- 14.2.2.5. Financials (Based on Availability)
- 14.2.3 American Fidelity Assurance
- 14.2.3.1. Overview
- 14.2.3.2. Products
- 14.2.3.3. SWOT Analysis
- 14.2.3.4. Recent Developments
- 14.2.3.5. Financials (Based on Availability)
- 14.2.4 Allianz Insurance
- 14.2.4.1. Overview
- 14.2.4.2. Products
- 14.2.4.3. SWOT Analysis
- 14.2.4.4. Recent Developments
- 14.2.4.5. Financials (Based on Availability)
- 14.2.5 Aviva
- 14.2.5.1. Overview
- 14.2.5.2. Products
- 14.2.5.3. SWOT Analysis
- 14.2.5.4. Recent Developments
- 14.2.5.5. Financials (Based on Availability)
- 14.2.6 AXA
- 14.2.6.1. Overview
- 14.2.6.2. Products
- 14.2.6.3. SWOT Analysis
- 14.2.6.4. Recent Developments
- 14.2.6.5. Financials (Based on Availability)
- 14.2.7 Chubb
- 14.2.7.1. Overview
- 14.2.7.2. Products
- 14.2.7.3. SWOT Analysis
- 14.2.7.4. Recent Developments
- 14.2.7.5. Financials (Based on Availability)
- 14.2.8 Assurant Inc
- 14.2.8.1. Overview
- 14.2.8.2. Products
- 14.2.8.3. SWOT Analysis
- 14.2.8.4. Recent Developments
- 14.2.8.5. Financials (Based on Availability)
- 14.2.9 AT&T Inc
- 14.2.9.1. Overview
- 14.2.9.2. Products
- 14.2.9.3. SWOT Analysis
- 14.2.9.4. Recent Developments
- 14.2.9.5. Financials (Based on Availability)
- 14.2.10 Amica Mutual Insurance
- 14.2.10.1. Overview
- 14.2.10.2. Products
- 14.2.10.3. SWOT Analysis
- 14.2.10.4. Recent Developments
- 14.2.10.5. Financials (Based on Availability)
- 14.2.1 AIG
List of Figures
- Figure 1: Global US Electronic Gadgets Insurance Market Revenue Breakdown (Million, %) by Region 2024 & 2032
- Figure 2: North America US Electronic Gadgets Insurance Market Revenue (Million), by Country 2024 & 2032
- Figure 3: North America US Electronic Gadgets Insurance Market Revenue Share (%), by Country 2024 & 2032
- Figure 4: North America US Electronic Gadgets Insurance Market Revenue (Million), by Coverage Type 2024 & 2032
- Figure 5: North America US Electronic Gadgets Insurance Market Revenue Share (%), by Coverage Type 2024 & 2032
- Figure 6: North America US Electronic Gadgets Insurance Market Revenue (Million), by Device Type 2024 & 2032
- Figure 7: North America US Electronic Gadgets Insurance Market Revenue Share (%), by Device Type 2024 & 2032
- Figure 8: North America US Electronic Gadgets Insurance Market Revenue (Million), by End Users 2024 & 2032
- Figure 9: North America US Electronic Gadgets Insurance Market Revenue Share (%), by End Users 2024 & 2032
- Figure 10: North America US Electronic Gadgets Insurance Market Revenue (Million), by Country 2024 & 2032
- Figure 11: North America US Electronic Gadgets Insurance Market Revenue Share (%), by Country 2024 & 2032
- Figure 12: South America US Electronic Gadgets Insurance Market Revenue (Million), by Coverage Type 2024 & 2032
- Figure 13: South America US Electronic Gadgets Insurance Market Revenue Share (%), by Coverage Type 2024 & 2032
- Figure 14: South America US Electronic Gadgets Insurance Market Revenue (Million), by Device Type 2024 & 2032
- Figure 15: South America US Electronic Gadgets Insurance Market Revenue Share (%), by Device Type 2024 & 2032
- Figure 16: South America US Electronic Gadgets Insurance Market Revenue (Million), by End Users 2024 & 2032
- Figure 17: South America US Electronic Gadgets Insurance Market Revenue Share (%), by End Users 2024 & 2032
- Figure 18: South America US Electronic Gadgets Insurance Market Revenue (Million), by Country 2024 & 2032
- Figure 19: South America US Electronic Gadgets Insurance Market Revenue Share (%), by Country 2024 & 2032
- Figure 20: Europe US Electronic Gadgets Insurance Market Revenue (Million), by Coverage Type 2024 & 2032
- Figure 21: Europe US Electronic Gadgets Insurance Market Revenue Share (%), by Coverage Type 2024 & 2032
- Figure 22: Europe US Electronic Gadgets Insurance Market Revenue (Million), by Device Type 2024 & 2032
- Figure 23: Europe US Electronic Gadgets Insurance Market Revenue Share (%), by Device Type 2024 & 2032
- Figure 24: Europe US Electronic Gadgets Insurance Market Revenue (Million), by End Users 2024 & 2032
- Figure 25: Europe US Electronic Gadgets Insurance Market Revenue Share (%), by End Users 2024 & 2032
- Figure 26: Europe US Electronic Gadgets Insurance Market Revenue (Million), by Country 2024 & 2032
- Figure 27: Europe US Electronic Gadgets Insurance Market Revenue Share (%), by Country 2024 & 2032
- Figure 28: Middle East & Africa US Electronic Gadgets Insurance Market Revenue (Million), by Coverage Type 2024 & 2032
- Figure 29: Middle East & Africa US Electronic Gadgets Insurance Market Revenue Share (%), by Coverage Type 2024 & 2032
- Figure 30: Middle East & Africa US Electronic Gadgets Insurance Market Revenue (Million), by Device Type 2024 & 2032
- Figure 31: Middle East & Africa US Electronic Gadgets Insurance Market Revenue Share (%), by Device Type 2024 & 2032
- Figure 32: Middle East & Africa US Electronic Gadgets Insurance Market Revenue (Million), by End Users 2024 & 2032
- Figure 33: Middle East & Africa US Electronic Gadgets Insurance Market Revenue Share (%), by End Users 2024 & 2032
- Figure 34: Middle East & Africa US Electronic Gadgets Insurance Market Revenue (Million), by Country 2024 & 2032
- Figure 35: Middle East & Africa US Electronic Gadgets Insurance Market Revenue Share (%), by Country 2024 & 2032
- Figure 36: Asia Pacific US Electronic Gadgets Insurance Market Revenue (Million), by Coverage Type 2024 & 2032
- Figure 37: Asia Pacific US Electronic Gadgets Insurance Market Revenue Share (%), by Coverage Type 2024 & 2032
- Figure 38: Asia Pacific US Electronic Gadgets Insurance Market Revenue (Million), by Device Type 2024 & 2032
- Figure 39: Asia Pacific US Electronic Gadgets Insurance Market Revenue Share (%), by Device Type 2024 & 2032
- Figure 40: Asia Pacific US Electronic Gadgets Insurance Market Revenue (Million), by End Users 2024 & 2032
- Figure 41: Asia Pacific US Electronic Gadgets Insurance Market Revenue Share (%), by End Users 2024 & 2032
- Figure 42: Asia Pacific US Electronic Gadgets Insurance Market Revenue (Million), by Country 2024 & 2032
- Figure 43: Asia Pacific US Electronic Gadgets Insurance Market Revenue Share (%), by Country 2024 & 2032
List of Tables
- Table 1: Global US Electronic Gadgets Insurance Market Revenue Million Forecast, by Region 2019 & 2032
- Table 2: Global US Electronic Gadgets Insurance Market Revenue Million Forecast, by Coverage Type 2019 & 2032
- Table 3: Global US Electronic Gadgets Insurance Market Revenue Million Forecast, by Device Type 2019 & 2032
- Table 4: Global US Electronic Gadgets Insurance Market Revenue Million Forecast, by End Users 2019 & 2032
- Table 5: Global US Electronic Gadgets Insurance Market Revenue Million Forecast, by Region 2019 & 2032
- Table 6: Global US Electronic Gadgets Insurance Market Revenue Million Forecast, by Country 2019 & 2032
- Table 7: United States US Electronic Gadgets Insurance Market Revenue (Million) Forecast, by Application 2019 & 2032
- Table 8: Canada US Electronic Gadgets Insurance Market Revenue (Million) Forecast, by Application 2019 & 2032
- Table 9: Mexico US Electronic Gadgets Insurance Market Revenue (Million) Forecast, by Application 2019 & 2032
- Table 10: Global US Electronic Gadgets Insurance Market Revenue Million Forecast, by Coverage Type 2019 & 2032
- Table 11: Global US Electronic Gadgets Insurance Market Revenue Million Forecast, by Device Type 2019 & 2032
- Table 12: Global US Electronic Gadgets Insurance Market Revenue Million Forecast, by End Users 2019 & 2032
- Table 13: Global US Electronic Gadgets Insurance Market Revenue Million Forecast, by Country 2019 & 2032
- Table 14: United States US Electronic Gadgets Insurance Market Revenue (Million) Forecast, by Application 2019 & 2032
- Table 15: Canada US Electronic Gadgets Insurance Market Revenue (Million) Forecast, by Application 2019 & 2032
- Table 16: Mexico US Electronic Gadgets Insurance Market Revenue (Million) Forecast, by Application 2019 & 2032
- Table 17: Global US Electronic Gadgets Insurance Market Revenue Million Forecast, by Coverage Type 2019 & 2032
- Table 18: Global US Electronic Gadgets Insurance Market Revenue Million Forecast, by Device Type 2019 & 2032
- Table 19: Global US Electronic Gadgets Insurance Market Revenue Million Forecast, by End Users 2019 & 2032
- Table 20: Global US Electronic Gadgets Insurance Market Revenue Million Forecast, by Country 2019 & 2032
- Table 21: Brazil US Electronic Gadgets Insurance Market Revenue (Million) Forecast, by Application 2019 & 2032
- Table 22: Argentina US Electronic Gadgets Insurance Market Revenue (Million) Forecast, by Application 2019 & 2032
- Table 23: Rest of South America US Electronic Gadgets Insurance Market Revenue (Million) Forecast, by Application 2019 & 2032
- Table 24: Global US Electronic Gadgets Insurance Market Revenue Million Forecast, by Coverage Type 2019 & 2032
- Table 25: Global US Electronic Gadgets Insurance Market Revenue Million Forecast, by Device Type 2019 & 2032
- Table 26: Global US Electronic Gadgets Insurance Market Revenue Million Forecast, by End Users 2019 & 2032
- Table 27: Global US Electronic Gadgets Insurance Market Revenue Million Forecast, by Country 2019 & 2032
- Table 28: United Kingdom US Electronic Gadgets Insurance Market Revenue (Million) Forecast, by Application 2019 & 2032
- Table 29: Germany US Electronic Gadgets Insurance Market Revenue (Million) Forecast, by Application 2019 & 2032
- Table 30: France US Electronic Gadgets Insurance Market Revenue (Million) Forecast, by Application 2019 & 2032
- Table 31: Italy US Electronic Gadgets Insurance Market Revenue (Million) Forecast, by Application 2019 & 2032
- Table 32: Spain US Electronic Gadgets Insurance Market Revenue (Million) Forecast, by Application 2019 & 2032
- Table 33: Russia US Electronic Gadgets Insurance Market Revenue (Million) Forecast, by Application 2019 & 2032
- Table 34: Benelux US Electronic Gadgets Insurance Market Revenue (Million) Forecast, by Application 2019 & 2032
- Table 35: Nordics US Electronic Gadgets Insurance Market Revenue (Million) Forecast, by Application 2019 & 2032
- Table 36: Rest of Europe US Electronic Gadgets Insurance Market Revenue (Million) Forecast, by Application 2019 & 2032
- Table 37: Global US Electronic Gadgets Insurance Market Revenue Million Forecast, by Coverage Type 2019 & 2032
- Table 38: Global US Electronic Gadgets Insurance Market Revenue Million Forecast, by Device Type 2019 & 2032
- Table 39: Global US Electronic Gadgets Insurance Market Revenue Million Forecast, by End Users 2019 & 2032
- Table 40: Global US Electronic Gadgets Insurance Market Revenue Million Forecast, by Country 2019 & 2032
- Table 41: Turkey US Electronic Gadgets Insurance Market Revenue (Million) Forecast, by Application 2019 & 2032
- Table 42: Israel US Electronic Gadgets Insurance Market Revenue (Million) Forecast, by Application 2019 & 2032
- Table 43: GCC US Electronic Gadgets Insurance Market Revenue (Million) Forecast, by Application 2019 & 2032
- Table 44: North Africa US Electronic Gadgets Insurance Market Revenue (Million) Forecast, by Application 2019 & 2032
- Table 45: South Africa US Electronic Gadgets Insurance Market Revenue (Million) Forecast, by Application 2019 & 2032
- Table 46: Rest of Middle East & Africa US Electronic Gadgets Insurance Market Revenue (Million) Forecast, by Application 2019 & 2032
- Table 47: Global US Electronic Gadgets Insurance Market Revenue Million Forecast, by Coverage Type 2019 & 2032
- Table 48: Global US Electronic Gadgets Insurance Market Revenue Million Forecast, by Device Type 2019 & 2032
- Table 49: Global US Electronic Gadgets Insurance Market Revenue Million Forecast, by End Users 2019 & 2032
- Table 50: Global US Electronic Gadgets Insurance Market Revenue Million Forecast, by Country 2019 & 2032
- Table 51: China US Electronic Gadgets Insurance Market Revenue (Million) Forecast, by Application 2019 & 2032
- Table 52: India US Electronic Gadgets Insurance Market Revenue (Million) Forecast, by Application 2019 & 2032
- Table 53: Japan US Electronic Gadgets Insurance Market Revenue (Million) Forecast, by Application 2019 & 2032
- Table 54: South Korea US Electronic Gadgets Insurance Market Revenue (Million) Forecast, by Application 2019 & 2032
- Table 55: ASEAN US Electronic Gadgets Insurance Market Revenue (Million) Forecast, by Application 2019 & 2032
- Table 56: Oceania US Electronic Gadgets Insurance Market Revenue (Million) Forecast, by Application 2019 & 2032
- Table 57: Rest of Asia Pacific US Electronic Gadgets Insurance Market Revenue (Million) Forecast, by Application 2019 & 2032
Frequently Asked Questions
1. What is the projected Compound Annual Growth Rate (CAGR) of the US Electronic Gadgets Insurance Market?
The projected CAGR is approximately 11.54%.
2. Which companies are prominent players in the US Electronic Gadgets Insurance Market?
Key companies in the market include AIG, Progressive**List Not Exhaustive, American Fidelity Assurance, Allianz Insurance, Aviva, AXA, Chubb, Assurant Inc, AT&T Inc, Amica Mutual Insurance.
3. What are the main segments of the US Electronic Gadgets Insurance Market?
The market segments include Coverage Type, Device Type, End Users.
4. Can you provide details about the market size?
The market size is estimated to be USD 19.58 Million as of 2022.
5. What are some drivers contributing to market growth?
Increse in Consumer spending for Electronic gadgets.; Rising living living standard of the the people.
6. What are the notable trends driving market growth?
Increase In Demand For Electronic Gadget Post Pandemic.
7. Are there any restraints impacting market growth?
Fluctuation in price of electronic gadgets raw material.; Fragmented market in electronic gadgets insurance business.
8. Can you provide examples of recent developments in the market?
In October 2023, Bolttech and Allianz Partners partnered to launch insurance solutions for embedded devices and appliances in the United States.
9. What pricing options are available for accessing the report?
Pricing options include single-user, multi-user, and enterprise licenses priced at USD 3800, USD 4500, and USD 5800 respectively.
10. Is the market size provided in terms of value or volume?
The market size is provided in terms of value, measured in Million.
11. Are there any specific market keywords associated with the report?
Yes, the market keyword associated with the report is "US Electronic Gadgets Insurance Market," which aids in identifying and referencing the specific market segment covered.
12. How do I determine which pricing option suits my needs best?
The pricing options vary based on user requirements and access needs. Individual users may opt for single-user licenses, while businesses requiring broader access may choose multi-user or enterprise licenses for cost-effective access to the report.
13. Are there any additional resources or data provided in the US Electronic Gadgets Insurance Market report?
While the report offers comprehensive insights, it's advisable to review the specific contents or supplementary materials provided to ascertain if additional resources or data are available.
14. How can I stay updated on further developments or reports in the US Electronic Gadgets Insurance Market?
To stay informed about further developments, trends, and reports in the US Electronic Gadgets Insurance Market, consider subscribing to industry newsletters, following relevant companies and organizations, or regularly checking reputable industry news sources and publications.
Methodology
Step 1 - Identification of Relevant Samples Size from Population Database


Step 2 - Approaches for Defining Global Market Size (Value, Volume* & Price*)

Note*: In applicable scenarios
Step 3 - Data Sources
Primary Research
- Web Analytics
- Survey Reports
- Research Institute
- Latest Research Reports
- Opinion Leaders
Secondary Research
- Annual Reports
- White Paper
- Latest Press Release
- Industry Association
- Paid Database
- Investor Presentations

Step 4 - Data Triangulation
Involves using different sources of information in order to increase the validity of a study
These sources are likely to be stakeholders in a program - participants, other researchers, program staff, other community members, and so on.
Then we put all data in single framework & apply various statistical tools to find out the dynamic on the market.
During the analysis stage, feedback from the stakeholder groups would be compared to determine areas of agreement as well as areas of divergence


