

Key Insights
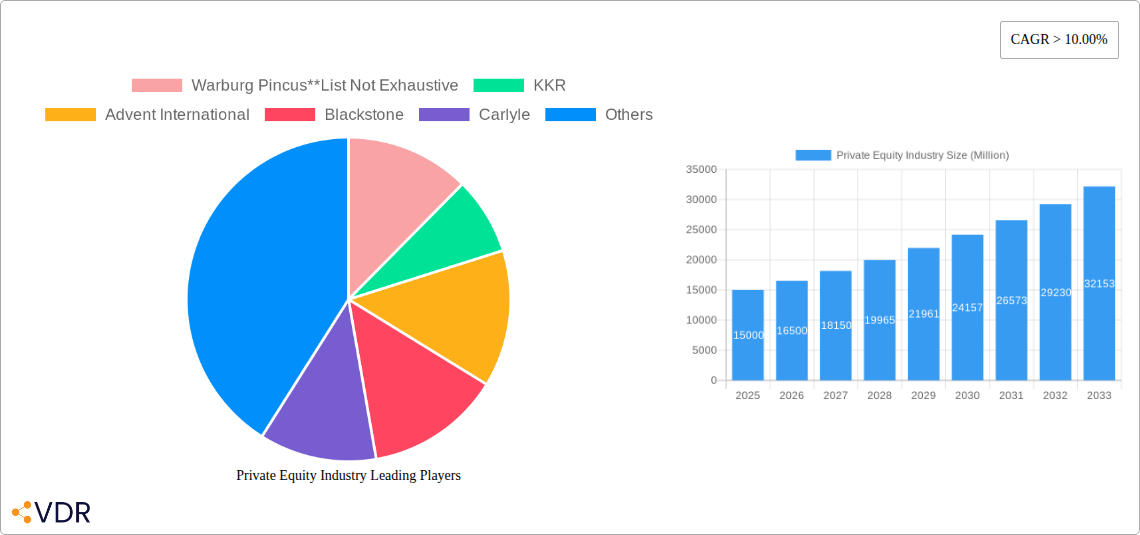
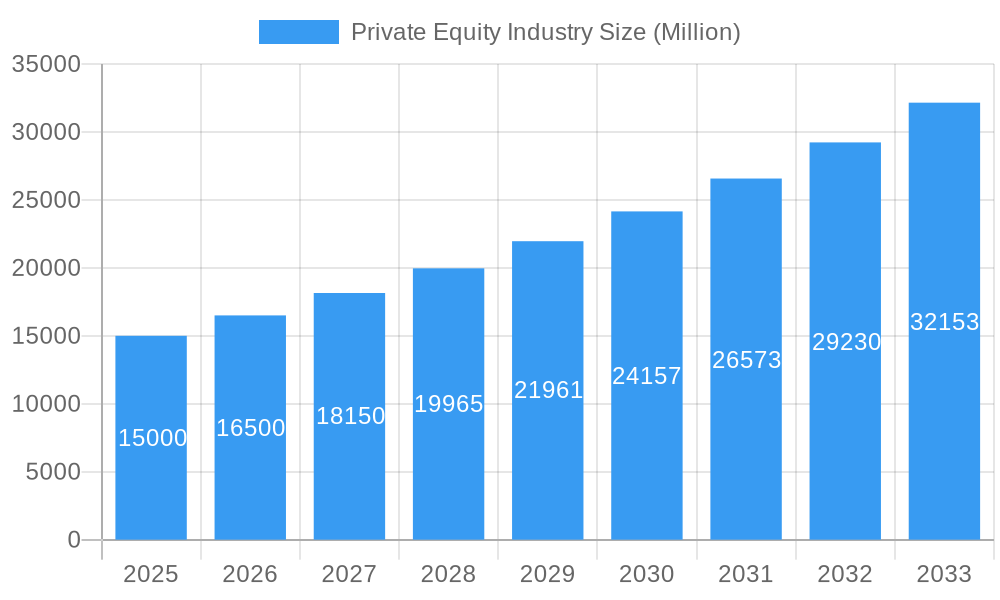
The private equity (PE) industry is experiencing robust growth, projected to maintain a Compound Annual Growth Rate (CAGR) exceeding 10% from 2025 to 2033. This expansion is fueled by several key drivers. Firstly, abundant capital available for investment, both from institutional investors and high-net-worth individuals, is continuously seeking high-yield opportunities. Secondly, a favorable regulatory environment in many regions encourages PE activity and facilitates mergers and acquisitions. Thirdly, the increasing prevalence of technology-driven disruptions across sectors presents ample opportunities for PE firms to invest in innovative companies poised for significant growth. Strategic sectors like technology (especially software), healthcare, and financial services are proving particularly attractive due to their high growth potential and potential for technological transformation. While the industry faces certain restraints, such as macroeconomic volatility and increased regulatory scrutiny in some jurisdictions, the overall outlook remains positive. The PE landscape is also evolving, with a growing emphasis on ESG (Environmental, Social, and Governance) factors influencing investment decisions, and a shift towards more diverse investment strategies across fund types (buyout, venture capital, real estate, infrastructure), investment stages (large cap, upper middle market, lower middle market), and geographical regions.
Private Equity Industry Market Size (In Billion)
The geographic distribution of PE activity demonstrates a continued dominance of North America and Europe, but Asia-Pacific is witnessing significant growth, driven by the expanding middle class and increasing economic activity in countries like China and India. Competition among established PE giants like Warburg Pincus, KKR, Blackstone, and Carlyle remains intense, yet the industry also sees the emergence of new players and specialized funds. This competitive landscape fosters innovation and efficiency in deal sourcing, valuation, and portfolio management. The ongoing expansion of the private equity market across various sectors and regions indicates a sustained period of growth and substantial investment opportunities throughout the forecast period. This is further supported by the continued appetite for alternative investment strategies and the ongoing evolution of the financial markets.
Private Equity Industry Company Market Share
Private Equity Industry Market Report: 2019-2033
This comprehensive report provides an in-depth analysis of the Private Equity industry, encompassing market dynamics, growth trends, dominant segments, and key players. With a study period spanning 2019-2033, a base year of 2025, and a forecast period of 2025-2033, this report offers invaluable insights for investors, industry professionals, and strategic decision-makers. The report leverages extensive data and analysis to project a xx Million market size by 2033, showcasing significant growth opportunities within various segments.
Private Equity Industry Market Dynamics & Structure
The Private Equity industry is characterized by high market concentration, with major players like Blackstone, KKR, and Carlyle commanding significant market share. Technological advancements, particularly in data analytics and AI, are reshaping investment strategies and deal sourcing. Regulatory frameworks, including those related to anti-trust and compliance, significantly influence deal activity. Competitive pressures arise from alternative investment vehicles, such as hedge funds and real estate investment trusts. M&A activity remains a key driver, with deal volumes exhibiting fluctuations based on economic conditions and investor sentiment. The industry also sees diverse end-user demographics including high net worth individuals, institutional investors and sovereign wealth funds.
- Market Concentration: Top 10 firms control xx% of the market (2024).
- Technological Innovation: AI-driven due diligence and portfolio management are key drivers.
- Regulatory Landscape: Stringent compliance requirements impact operational efficiency.
- M&A Trends: Deal volume reached xx Million in 2024, projected to reach xx Million in 2033.
- End-User Demographics: Increasing participation from institutional investors.
Private Equity Industry Growth Trends & Insights
The Private Equity market experienced significant growth during the historical period (2019-2024), driven by increased investor appetite for alternative assets and favorable macroeconomic conditions. The sector's evolution is marked by a shift towards technology-driven strategies, including big data analysis for deal sourcing and portfolio management. Consumer behavior shifts, such as increased demand for sustainable investments, are influencing investment strategies. The market is anticipated to experience a Compound Annual Growth Rate (CAGR) of xx% during the forecast period (2025-2033), reaching a projected market size of xx Million by 2033. Market penetration within specific sectors, such as technology and healthcare, is also expected to increase significantly. Technological disruptions like the rise of fintech and blockchain are reshaping the landscape and introducing new investment opportunities.
Dominant Regions, Countries, or Segments in Private Equity Industry
North America (specifically the US) currently holds the largest market share in the Private Equity industry, followed by Europe and Asia. Within Fund Types, Buyouts represent the largest segment, followed by Real Estate and Venture Capital. The Technology (Software), Healthcare, and Financial Services sectors are particularly attractive for PE investments. Large Cap deals dominate in terms of deal value, though the Upper Middle Market segment shows strong growth potential.
- Leading Region: North America (xx% market share)
- Key Sectors: Technology (Software), Healthcare, Financial Services
- Dominant Fund Type: Buyouts (xx% of total investments)
- Investment Size: Large Cap transactions account for xx% of total deal value.
- Growth Drivers: Strong economic growth in target markets and favorable regulatory environments.
Private Equity Industry Product Landscape
The "product" in the Private Equity industry encompasses various investment strategies and portfolio management techniques. Recent innovations include sophisticated data analytics tools for deal sourcing and risk assessment. The unique selling proposition lies in the ability to generate high returns through active portfolio management and value creation strategies. Technological advancements are driving greater efficiency in due diligence processes and performance monitoring.
Key Drivers, Barriers & Challenges in Private Equity Industry
Key Drivers:
- Rising institutional investor participation
- Favorable regulatory environment in certain markets
- Technological advancements improving efficiency
Challenges & Restraints:
- Increased competition from other asset classes
- Regulatory scrutiny and compliance costs
- Economic downturns impacting deal flow (xx% decrease in deal volume during previous recession)
Emerging Opportunities in Private Equity Industry
- Investments in sustainable and ESG-focused companies
- Expansion into emerging markets
- Utilizing technology for enhanced deal sourcing and portfolio management
Growth Accelerators in the Private Equity Industry
Technological breakthroughs in AI and machine learning will accelerate deal flow and portfolio optimization. Strategic partnerships between private equity firms and technology companies will drive innovation. Expansion into new geographical markets and sectors with high growth potential will further fuel market growth.
Key Players Shaping the Private Equity Industry Market
- Warburg Pincus
- KKR
- Advent International
- Blackstone
- Carlyle
- EnCap Investments
- CVC Capital Partners
- TPG Capital
- Neuberger Berman
- Apollo Global Management
Notable Milestones in Private Equity Industry Sector
- September 2022: Nonantum Capital Partners acquired LJP Waste Solutions.
- August 2022: Prosus Ventures and PayU India acquired BillDesk for USD 4.7 Billion.
In-Depth Private Equity Industry Market Outlook
The Private Equity industry is poised for continued growth, driven by technological advancements, strategic partnerships, and expansion into new markets. The increasing demand for alternative investments and the ongoing evolution of investment strategies will create significant opportunities for both established and emerging players. The sector's future trajectory is promising, with a sustained upward trend projected throughout the forecast period.
Private Equity Industry Segmentation
-
1. Fund Type
- 1.1. Buyout
- 1.2. Venture Capital (VCs)
- 1.3. Real Estate
- 1.4. Infrastructure
- 1.5. Other (Distressed PE, Direct Lending, etc.)
-
2. Sector
- 2.1. Technology (Software)
- 2.2. Healthcare
- 2.3. Real Estate and Services
- 2.4. Financial Services
- 2.5. Industrials
- 2.6. Consumer & Retail
- 2.7. Energy & Power
- 2.8. Media & Entertainment
- 2.9. Telecom
- 2.10. Others (Transportation, etc.)
-
3. Investments
- 3.1. Large Cap
- 3.2. Upper Middle Market
- 3.3. Lower Middle Market
- 3.4. Real Estate
Private Equity Industry Segmentation By Geography
- 1. North America
- 2. Europe
- 3. Asia Pacific
- 4. Latin America
- 5. Middle East
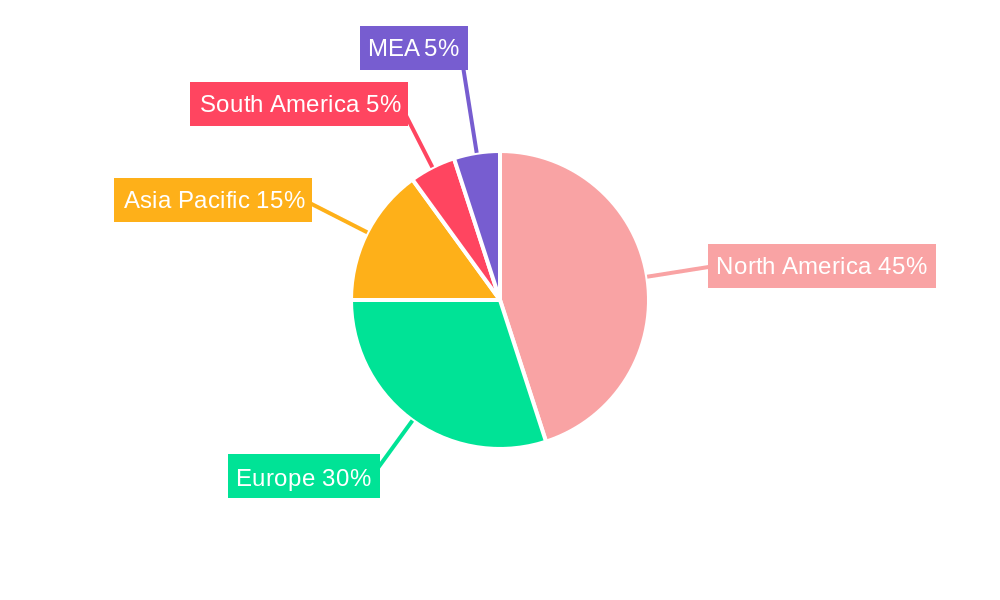
Private Equity Industry Regional Market Share
Geographic Coverage of Private Equity Industry
Private Equity Industry REPORT HIGHLIGHTS
| Aspects | Details |
|---|---|
| Study Period | 2020-2034 |
| Base Year | 2025 |
| Estimated Year | 2026 |
| Forecast Period | 2026-2034 |
| Historical Period | 2020-2025 |
| Growth Rate | CAGR of 11% from 2020-2034 |
| Segmentation |
|
Table of Contents
- 1. Introduction
- 1.1. Research Scope
- 1.2. Market Segmentation
- 1.3. Research Objective
- 1.4. Definitions and Assumptions
- 2. Executive Summary
- 2.1. Market Snapshot
- 3. Market Dynamics
- 3.1. Market Drivers
- 3.2. Market Restrains
- 3.3. Market Trends
- 3.4. Market Opportunities
- 4. Market Factor Analysis
- 4.1. Porters Five Forces
- 4.1.1. Bargaining Power of Suppliers
- 4.1.2. Bargaining Power of Buyers
- 4.1.3. Threat of New Entrants
- 4.1.4. Threat of Substitutes
- 4.1.5. Competitive Rivalry
- 4.2. PESTEL analysis
- 4.3. BCG Analysis
- 4.3.1. Stars (High Growth, High Market Share)
- 4.3.2. Cash Cows (Low Growth, High Market Share)
- 4.3.3. Question Mark (High Growth, Low Market Share)
- 4.3.4. Dogs (Low Growth, Low Market Share)
- 4.4. Ansoff Matrix Analysis
- 4.5. Supply Chain Analysis
- 4.6. Regulatory Landscape
- 4.7. Current Market Potential and Opportunity Assessment (TAM–SAM–SOM Framework)
- 4.8. VDR Analyst Note
- 4.1. Porters Five Forces
- 5. Market Analysis, Insights and Forecast 2021-2033
- 5.1. Market Analysis, Insights and Forecast - by Fund Type
- 5.1.1. Buyout
- 5.1.2. Venture Capital (VCs)
- 5.1.3. Real Estate
- 5.1.4. Infrastructure
- 5.1.5. Other (Distressed PE, Direct Lending, etc.)
- 5.2. Market Analysis, Insights and Forecast - by Sector
- 5.2.1. Technology (Software)
- 5.2.2. Healthcare
- 5.2.3. Real Estate and Services
- 5.2.4. Financial Services
- 5.2.5. Industrials
- 5.2.6. Consumer & Retail
- 5.2.7. Energy & Power
- 5.2.8. Media & Entertainment
- 5.2.9. Telecom
- 5.2.10. Others (Transportation, etc.)
- 5.3. Market Analysis, Insights and Forecast - by Investments
- 5.3.1. Large Cap
- 5.3.2. Upper Middle Market
- 5.3.3. Lower Middle Market
- 5.3.4. Real Estate
- 5.4. Market Analysis, Insights and Forecast - by Region
- 5.4.1. North America
- 5.4.2. Europe
- 5.4.3. Asia Pacific
- 5.4.4. Latin America
- 5.4.5. Middle East
- 5.1. Market Analysis, Insights and Forecast - by Fund Type
- 6. Global Private Equity Industry Analysis, Insights and Forecast, 2021-2033
- 6.1. Market Analysis, Insights and Forecast - by Fund Type
- 6.1.1. Buyout
- 6.1.2. Venture Capital (VCs)
- 6.1.3. Real Estate
- 6.1.4. Infrastructure
- 6.1.5. Other (Distressed PE, Direct Lending, etc.)
- 6.2. Market Analysis, Insights and Forecast - by Sector
- 6.2.1. Technology (Software)
- 6.2.2. Healthcare
- 6.2.3. Real Estate and Services
- 6.2.4. Financial Services
- 6.2.5. Industrials
- 6.2.6. Consumer & Retail
- 6.2.7. Energy & Power
- 6.2.8. Media & Entertainment
- 6.2.9. Telecom
- 6.2.10. Others (Transportation, etc.)
- 6.3. Market Analysis, Insights and Forecast - by Investments
- 6.3.1. Large Cap
- 6.3.2. Upper Middle Market
- 6.3.3. Lower Middle Market
- 6.3.4. Real Estate
- 6.1. Market Analysis, Insights and Forecast - by Fund Type
- 7. North America Private Equity Industry Analysis, Insights and Forecast, 2021-2033
- 7.1. Market Analysis, Insights and Forecast - by Fund Type
- 7.1.1. Buyout
- 7.1.2. Venture Capital (VCs)
- 7.1.3. Real Estate
- 7.1.4. Infrastructure
- 7.1.5. Other (Distressed PE, Direct Lending, etc.)
- 7.2. Market Analysis, Insights and Forecast - by Sector
- 7.2.1. Technology (Software)
- 7.2.2. Healthcare
- 7.2.3. Real Estate and Services
- 7.2.4. Financial Services
- 7.2.5. Industrials
- 7.2.6. Consumer & Retail
- 7.2.7. Energy & Power
- 7.2.8. Media & Entertainment
- 7.2.9. Telecom
- 7.2.10. Others (Transportation, etc.)
- 7.3. Market Analysis, Insights and Forecast - by Investments
- 7.3.1. Large Cap
- 7.3.2. Upper Middle Market
- 7.3.3. Lower Middle Market
- 7.3.4. Real Estate
- 7.1. Market Analysis, Insights and Forecast - by Fund Type
- 8. Europe Private Equity Industry Analysis, Insights and Forecast, 2021-2033
- 8.1. Market Analysis, Insights and Forecast - by Fund Type
- 8.1.1. Buyout
- 8.1.2. Venture Capital (VCs)
- 8.1.3. Real Estate
- 8.1.4. Infrastructure
- 8.1.5. Other (Distressed PE, Direct Lending, etc.)
- 8.2. Market Analysis, Insights and Forecast - by Sector
- 8.2.1. Technology (Software)
- 8.2.2. Healthcare
- 8.2.3. Real Estate and Services
- 8.2.4. Financial Services
- 8.2.5. Industrials
- 8.2.6. Consumer & Retail
- 8.2.7. Energy & Power
- 8.2.8. Media & Entertainment
- 8.2.9. Telecom
- 8.2.10. Others (Transportation, etc.)
- 8.3. Market Analysis, Insights and Forecast - by Investments
- 8.3.1. Large Cap
- 8.3.2. Upper Middle Market
- 8.3.3. Lower Middle Market
- 8.3.4. Real Estate
- 8.1. Market Analysis, Insights and Forecast - by Fund Type
- 9. Asia Pacific Private Equity Industry Analysis, Insights and Forecast, 2021-2033
- 9.1. Market Analysis, Insights and Forecast - by Fund Type
- 9.1.1. Buyout
- 9.1.2. Venture Capital (VCs)
- 9.1.3. Real Estate
- 9.1.4. Infrastructure
- 9.1.5. Other (Distressed PE, Direct Lending, etc.)
- 9.2. Market Analysis, Insights and Forecast - by Sector
- 9.2.1. Technology (Software)
- 9.2.2. Healthcare
- 9.2.3. Real Estate and Services
- 9.2.4. Financial Services
- 9.2.5. Industrials
- 9.2.6. Consumer & Retail
- 9.2.7. Energy & Power
- 9.2.8. Media & Entertainment
- 9.2.9. Telecom
- 9.2.10. Others (Transportation, etc.)
- 9.3. Market Analysis, Insights and Forecast - by Investments
- 9.3.1. Large Cap
- 9.3.2. Upper Middle Market
- 9.3.3. Lower Middle Market
- 9.3.4. Real Estate
- 9.1. Market Analysis, Insights and Forecast - by Fund Type
- 10. Latin America Private Equity Industry Analysis, Insights and Forecast, 2021-2033
- 10.1. Market Analysis, Insights and Forecast - by Fund Type
- 10.1.1. Buyout
- 10.1.2. Venture Capital (VCs)
- 10.1.3. Real Estate
- 10.1.4. Infrastructure
- 10.1.5. Other (Distressed PE, Direct Lending, etc.)
- 10.2. Market Analysis, Insights and Forecast - by Sector
- 10.2.1. Technology (Software)
- 10.2.2. Healthcare
- 10.2.3. Real Estate and Services
- 10.2.4. Financial Services
- 10.2.5. Industrials
- 10.2.6. Consumer & Retail
- 10.2.7. Energy & Power
- 10.2.8. Media & Entertainment
- 10.2.9. Telecom
- 10.2.10. Others (Transportation, etc.)
- 10.3. Market Analysis, Insights and Forecast - by Investments
- 10.3.1. Large Cap
- 10.3.2. Upper Middle Market
- 10.3.3. Lower Middle Market
- 10.3.4. Real Estate
- 10.1. Market Analysis, Insights and Forecast - by Fund Type
- 11. Middle East Private Equity Industry Analysis, Insights and Forecast, 2021-2033
- 11.1. Market Analysis, Insights and Forecast - by Fund Type
- 11.1.1. Buyout
- 11.1.2. Venture Capital (VCs)
- 11.1.3. Real Estate
- 11.1.4. Infrastructure
- 11.1.5. Other (Distressed PE, Direct Lending, etc.)
- 11.2. Market Analysis, Insights and Forecast - by Sector
- 11.2.1. Technology (Software)
- 11.2.2. Healthcare
- 11.2.3. Real Estate and Services
- 11.2.4. Financial Services
- 11.2.5. Industrials
- 11.2.6. Consumer & Retail
- 11.2.7. Energy & Power
- 11.2.8. Media & Entertainment
- 11.2.9. Telecom
- 11.2.10. Others (Transportation, etc.)
- 11.3. Market Analysis, Insights and Forecast - by Investments
- 11.3.1. Large Cap
- 11.3.2. Upper Middle Market
- 11.3.3. Lower Middle Market
- 11.3.4. Real Estate
- 11.1. Market Analysis, Insights and Forecast - by Fund Type
- 12. Competitive Analysis
- 12.1. Company Profiles
- 12.1.1 Warburg Pincus**List Not Exhaustive
- 12.1.1.1. Company Overview
- 12.1.1.2. Products
- 12.1.1.3. Company Financials
- 12.1.1.4. SWOT Analysis
- 12.1.2 KKR
- 12.1.2.1. Company Overview
- 12.1.2.2. Products
- 12.1.2.3. Company Financials
- 12.1.2.4. SWOT Analysis
- 12.1.3 Advent International
- 12.1.3.1. Company Overview
- 12.1.3.2. Products
- 12.1.3.3. Company Financials
- 12.1.3.4. SWOT Analysis
- 12.1.4 Blackstone
- 12.1.4.1. Company Overview
- 12.1.4.2. Products
- 12.1.4.3. Company Financials
- 12.1.4.4. SWOT Analysis
- 12.1.5 Carlyle
- 12.1.5.1. Company Overview
- 12.1.5.2. Products
- 12.1.5.3. Company Financials
- 12.1.5.4. SWOT Analysis
- 12.1.6 EnCap Investments
- 12.1.6.1. Company Overview
- 12.1.6.2. Products
- 12.1.6.3. Company Financials
- 12.1.6.4. SWOT Analysis
- 12.1.7 CVC Capital Partners
- 12.1.7.1. Company Overview
- 12.1.7.2. Products
- 12.1.7.3. Company Financials
- 12.1.7.4. SWOT Analysis
- 12.1.8 TPG Capital
- 12.1.8.1. Company Overview
- 12.1.8.2. Products
- 12.1.8.3. Company Financials
- 12.1.8.4. SWOT Analysis
- 12.1.9 Neuberger Berman
- 12.1.9.1. Company Overview
- 12.1.9.2. Products
- 12.1.9.3. Company Financials
- 12.1.9.4. SWOT Analysis
- 12.1.10 Apollo Global Management
- 12.1.10.1. Company Overview
- 12.1.10.2. Products
- 12.1.10.3. Company Financials
- 12.1.10.4. SWOT Analysis
- 12.1.1 Warburg Pincus**List Not Exhaustive
- 12.2. Market Entropy
- 12.2.1 Company's Key Areas Served
- 12.2.2 Recent Developments
- 12.3. Company Market Share Analysis 2025
- 12.3.1 Top 5 Companies Market Share Analysis
- 12.3.2 Top 3 Companies Market Share Analysis
- 12.4. List of Potential Customers
- 13. Research Methodology
List of Figures
- Figure 1: Global Private Equity Industry Revenue Breakdown (billion, %) by Region 2025 & 2033
- Figure 2: North America Private Equity Industry Revenue (billion), by Fund Type 2025 & 2033
- Figure 3: North America Private Equity Industry Revenue Share (%), by Fund Type 2025 & 2033
- Figure 4: North America Private Equity Industry Revenue (billion), by Sector 2025 & 2033
- Figure 5: North America Private Equity Industry Revenue Share (%), by Sector 2025 & 2033
- Figure 6: North America Private Equity Industry Revenue (billion), by Investments 2025 & 2033
- Figure 7: North America Private Equity Industry Revenue Share (%), by Investments 2025 & 2033
- Figure 8: North America Private Equity Industry Revenue (billion), by Country 2025 & 2033
- Figure 9: North America Private Equity Industry Revenue Share (%), by Country 2025 & 2033
- Figure 10: Europe Private Equity Industry Revenue (billion), by Fund Type 2025 & 2033
- Figure 11: Europe Private Equity Industry Revenue Share (%), by Fund Type 2025 & 2033
- Figure 12: Europe Private Equity Industry Revenue (billion), by Sector 2025 & 2033
- Figure 13: Europe Private Equity Industry Revenue Share (%), by Sector 2025 & 2033
- Figure 14: Europe Private Equity Industry Revenue (billion), by Investments 2025 & 2033
- Figure 15: Europe Private Equity Industry Revenue Share (%), by Investments 2025 & 2033
- Figure 16: Europe Private Equity Industry Revenue (billion), by Country 2025 & 2033
- Figure 17: Europe Private Equity Industry Revenue Share (%), by Country 2025 & 2033
- Figure 18: Asia Pacific Private Equity Industry Revenue (billion), by Fund Type 2025 & 2033
- Figure 19: Asia Pacific Private Equity Industry Revenue Share (%), by Fund Type 2025 & 2033
- Figure 20: Asia Pacific Private Equity Industry Revenue (billion), by Sector 2025 & 2033
- Figure 21: Asia Pacific Private Equity Industry Revenue Share (%), by Sector 2025 & 2033
- Figure 22: Asia Pacific Private Equity Industry Revenue (billion), by Investments 2025 & 2033
- Figure 23: Asia Pacific Private Equity Industry Revenue Share (%), by Investments 2025 & 2033
- Figure 24: Asia Pacific Private Equity Industry Revenue (billion), by Country 2025 & 2033
- Figure 25: Asia Pacific Private Equity Industry Revenue Share (%), by Country 2025 & 2033
- Figure 26: Latin America Private Equity Industry Revenue (billion), by Fund Type 2025 & 2033
- Figure 27: Latin America Private Equity Industry Revenue Share (%), by Fund Type 2025 & 2033
- Figure 28: Latin America Private Equity Industry Revenue (billion), by Sector 2025 & 2033
- Figure 29: Latin America Private Equity Industry Revenue Share (%), by Sector 2025 & 2033
- Figure 30: Latin America Private Equity Industry Revenue (billion), by Investments 2025 & 2033
- Figure 31: Latin America Private Equity Industry Revenue Share (%), by Investments 2025 & 2033
- Figure 32: Latin America Private Equity Industry Revenue (billion), by Country 2025 & 2033
- Figure 33: Latin America Private Equity Industry Revenue Share (%), by Country 2025 & 2033
- Figure 34: Middle East Private Equity Industry Revenue (billion), by Fund Type 2025 & 2033
- Figure 35: Middle East Private Equity Industry Revenue Share (%), by Fund Type 2025 & 2033
- Figure 36: Middle East Private Equity Industry Revenue (billion), by Sector 2025 & 2033
- Figure 37: Middle East Private Equity Industry Revenue Share (%), by Sector 2025 & 2033
- Figure 38: Middle East Private Equity Industry Revenue (billion), by Investments 2025 & 2033
- Figure 39: Middle East Private Equity Industry Revenue Share (%), by Investments 2025 & 2033
- Figure 40: Middle East Private Equity Industry Revenue (billion), by Country 2025 & 2033
- Figure 41: Middle East Private Equity Industry Revenue Share (%), by Country 2025 & 2033
List of Tables
- Table 1: Global Private Equity Industry Revenue billion Forecast, by Fund Type 2020 & 2033
- Table 2: Global Private Equity Industry Revenue billion Forecast, by Sector 2020 & 2033
- Table 3: Global Private Equity Industry Revenue billion Forecast, by Investments 2020 & 2033
- Table 4: Global Private Equity Industry Revenue billion Forecast, by Region 2020 & 2033
- Table 5: Global Private Equity Industry Revenue billion Forecast, by Fund Type 2020 & 2033
- Table 6: Global Private Equity Industry Revenue billion Forecast, by Sector 2020 & 2033
- Table 7: Global Private Equity Industry Revenue billion Forecast, by Investments 2020 & 2033
- Table 8: Global Private Equity Industry Revenue billion Forecast, by Country 2020 & 2033
- Table 9: Global Private Equity Industry Revenue billion Forecast, by Fund Type 2020 & 2033
- Table 10: Global Private Equity Industry Revenue billion Forecast, by Sector 2020 & 2033
- Table 11: Global Private Equity Industry Revenue billion Forecast, by Investments 2020 & 2033
- Table 12: Global Private Equity Industry Revenue billion Forecast, by Country 2020 & 2033
- Table 13: Global Private Equity Industry Revenue billion Forecast, by Fund Type 2020 & 2033
- Table 14: Global Private Equity Industry Revenue billion Forecast, by Sector 2020 & 2033
- Table 15: Global Private Equity Industry Revenue billion Forecast, by Investments 2020 & 2033
- Table 16: Global Private Equity Industry Revenue billion Forecast, by Country 2020 & 2033
- Table 17: Global Private Equity Industry Revenue billion Forecast, by Fund Type 2020 & 2033
- Table 18: Global Private Equity Industry Revenue billion Forecast, by Sector 2020 & 2033
- Table 19: Global Private Equity Industry Revenue billion Forecast, by Investments 2020 & 2033
- Table 20: Global Private Equity Industry Revenue billion Forecast, by Country 2020 & 2033
- Table 21: Global Private Equity Industry Revenue billion Forecast, by Fund Type 2020 & 2033
- Table 22: Global Private Equity Industry Revenue billion Forecast, by Sector 2020 & 2033
- Table 23: Global Private Equity Industry Revenue billion Forecast, by Investments 2020 & 2033
- Table 24: Global Private Equity Industry Revenue billion Forecast, by Country 2020 & 2033
Frequently Asked Questions
1. What is the projected Compound Annual Growth Rate (CAGR) of the Private Equity Industry?
The projected CAGR is approximately 11%.
2. Which companies are prominent players in the Private Equity Industry?
Key companies in the market include Warburg Pincus**List Not Exhaustive, KKR, Advent International, Blackstone, Carlyle, EnCap Investments, CVC Capital Partners, TPG Capital, Neuberger Berman, Apollo Global Management.
3. What are the main segments of the Private Equity Industry?
The market segments include Fund Type, Sector, Investments.
4. Can you provide details about the market size?
The market size is estimated to be USD 460 billion as of 2022.
5. What are some drivers contributing to market growth?
Increasing Adoption of Innovative Tracking Technologies.
6. What are the notable trends driving market growth?
Growth Investments Have Become Larger and More Complex.
7. Are there any restraints impacting market growth?
Rising Competition of Banks with Fintech and Financial Services.
8. Can you provide examples of recent developments in the market?
September 2022: Nonantum Capital Partners, a middle-market private equity firm, today announced the acquisition of LJP Waste Solutions ("LJP") from Aperion Management. LJP is a leading regional provider of non-hazardous solid waste and recycling services specializing in zero landfill and waste-to-energy solutions.
9. What pricing options are available for accessing the report?
Pricing options include single-user, multi-user, and enterprise licenses priced at USD 4750, USD 5250, and USD 8750 respectively.
10. Is the market size provided in terms of value or volume?
The market size is provided in terms of value, measured in billion.
11. Are there any specific market keywords associated with the report?
Yes, the market keyword associated with the report is "Private Equity Industry," which aids in identifying and referencing the specific market segment covered.
12. How do I determine which pricing option suits my needs best?
The pricing options vary based on user requirements and access needs. Individual users may opt for single-user licenses, while businesses requiring broader access may choose multi-user or enterprise licenses for cost-effective access to the report.
13. Are there any additional resources or data provided in the Private Equity Industry report?
While the report offers comprehensive insights, it's advisable to review the specific contents or supplementary materials provided to ascertain if additional resources or data are available.
14. How can I stay updated on further developments or reports in the Private Equity Industry?
To stay informed about further developments, trends, and reports in the Private Equity Industry, consider subscribing to industry newsletters, following relevant companies and organizations, or regularly checking reputable industry news sources and publications.
Methodology
Step 1 - Identification of Relevant Samples Size from Population Database


Step 2 - Approaches for Defining Global Market Size (Value, Volume* & Price*)

Note*: In applicable scenarios
Step 3 - Data Sources
Primary Research
- Web Analytics
- Survey Reports
- Research Institute
- Latest Research Reports
- Opinion Leaders
Secondary Research
- Annual Reports
- White Paper
- Latest Press Release
- Industry Association
- Paid Database
- Investor Presentations

Step 4 - Data Triangulation
Involves using different sources of information in order to increase the validity of a study
These sources are likely to be stakeholders in a program - participants, other researchers, program staff, other community members, and so on.
Then we put all data in single framework & apply various statistical tools to find out the dynamic on the market.
During the analysis stage, feedback from the stakeholder groups would be compared to determine areas of agreement as well as areas of divergence