
Key Insights
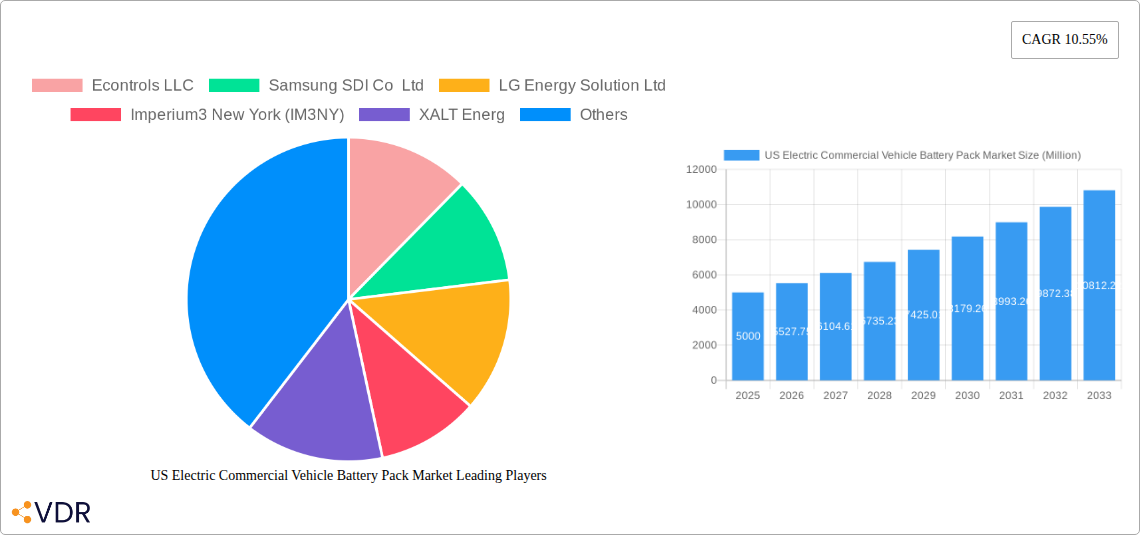
The US electric commercial vehicle (ECV) battery pack market is experiencing robust growth, driven by stringent emission regulations, increasing fuel costs, and government incentives promoting electric transportation. The market's compound annual growth rate (CAGR) of 10.55% from 2019 to 2024 suggests a significant expansion, and this momentum is expected to continue through 2033. Several factors contribute to this growth. Firstly, the increasing adoption of Battery Electric Vehicles (BEVs) and Plug-in Hybrid Electric Vehicles (PHEVs) across various commercial segments, including buses, light commercial vehicles (LCVs), and medium & heavy-duty trucks (M&HDTs), fuels demand for battery packs. Secondly, advancements in battery technology, leading to higher energy density, longer lifespan, and faster charging times, are making EVs more attractive and practical for commercial applications. The market is segmented by various components (anode, cathode, electrolyte, separator), material types (cobalt, lithium, manganese, etc.), body type, propulsion type, battery chemistry (LFP, NCA, NCM, NMC), capacity, battery form (cylindrical, pouch, prismatic), and manufacturing methods. This segmentation reflects the diverse technological landscape and the ongoing innovation within the industry. Key players like Tesla, CATL, LG Energy Solution, and others are actively competing in this expanding market, investing heavily in R&D and manufacturing capacity to meet the growing demand.
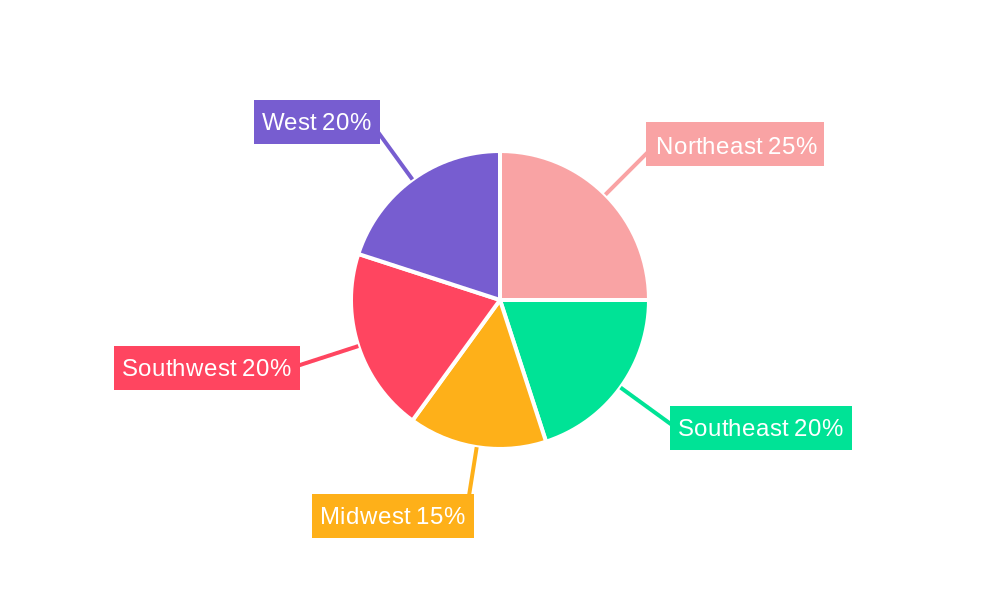
Despite the positive outlook, challenges remain. The high initial cost of ECV battery packs and the limited charging infrastructure in certain regions could impede wider adoption. Furthermore, concerns about battery lifespan, safety, and the sourcing of raw materials, particularly critical minerals like lithium and cobalt, represent potential restraints. However, ongoing research and development in battery technologies, coupled with government initiatives to improve charging infrastructure and secure raw material supplies, are expected to mitigate these challenges. The US market, specifically focusing on regions like the Northeast, Southeast, Midwest, Southwest, and West, presents a diverse landscape of opportunities and challenges, with growth potential varying across these regions depending on factors such as existing infrastructure, adoption rates, and policy support. The continued focus on sustainability and the increasing urgency to reduce carbon emissions will further accelerate the growth of the US ECV battery pack market in the coming years.
US Electric Commercial Vehicle Battery Pack Market: A Comprehensive Report (2019-2033)
This comprehensive report provides an in-depth analysis of the US Electric Commercial Vehicle Battery Pack Market, encompassing the parent market of Electric Commercial Vehicles and the child market of Battery Packs. We delve into market dynamics, growth trends, regional dominance, product landscapes, and key players shaping this rapidly evolving sector. The study period covers 2019-2033, with a base year of 2025 and a forecast period of 2025-2033. This report is crucial for industry professionals, investors, and strategic decision-makers seeking a detailed understanding of this lucrative market. The market size is expected to reach xx million units by 2033.
US Electric Commercial Vehicle Battery Pack Market Market Dynamics & Structure
The US electric commercial vehicle battery pack market is characterized by intense competition, rapid technological advancements, and evolving regulatory landscapes. Market concentration is moderate, with several key players holding significant shares, but a fragmented landscape also exists, particularly amongst smaller component suppliers. Technological innovation, primarily driven by improvements in battery chemistry (NMC, LFP, NCA), energy density, and thermal management systems, is a key driver. Stringent emission regulations and government incentives significantly influence market growth. Competitive substitutes, such as fuel cells, pose a challenge, but the cost advantages and technological maturity of battery packs currently maintain their dominance. End-user demographics are expanding, encompassing various commercial segments including buses, light commercial vehicles (LCVs), and medium & heavy-duty trucks (M&HDT).
- Market Concentration: Moderate, with top 5 players holding approximately xx% market share (2024).
- M&A Activity: xx deals recorded between 2019-2024, indicating high consolidation trends.
- Technological Innovation Drivers: Enhanced energy density, improved thermal management, faster charging capabilities.
- Regulatory Framework: Increasingly stringent emission standards and supportive government policies.
- Innovation Barriers: High R&D costs, complexities in battery recycling, and securing raw materials.
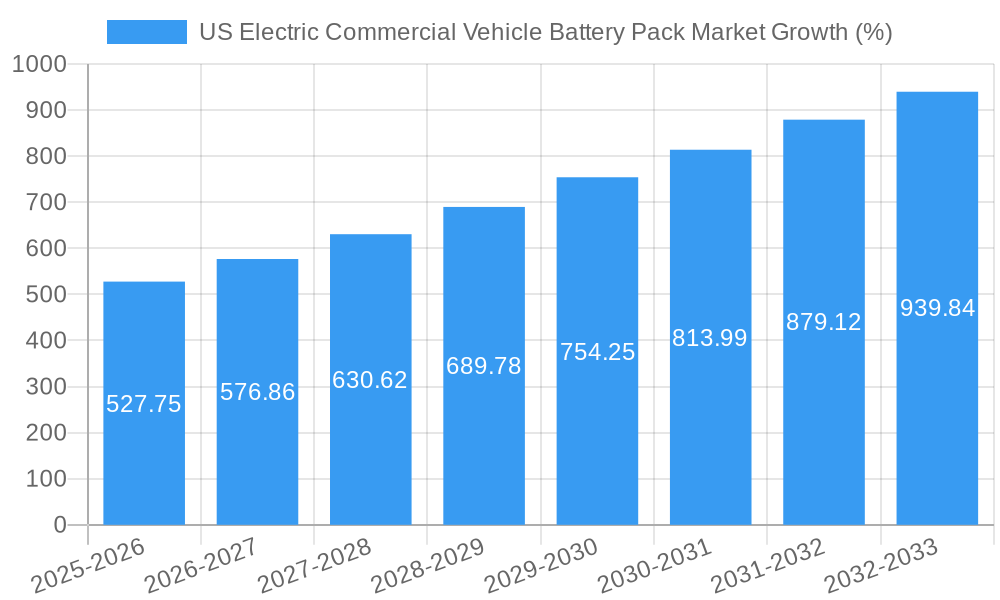
US Electric Commercial Vehicle Battery Pack Market Growth Trends & Insights
The US electric commercial vehicle battery pack market exhibits significant growth potential, driven by increasing adoption of electric commercial vehicles across various segments. The market size is projected to expand at a Compound Annual Growth Rate (CAGR) of xx% during the forecast period (2025-2033), reaching xx million units by 2033. This growth is fueled by several factors, including declining battery costs, improved battery performance, and supportive government policies promoting electrification. Technological disruptions, particularly advancements in solid-state batteries, promise further market expansion. Consumer behavior shifts, towards sustainability and reduced emissions, are also contributing factors. Market penetration is expected to reach xx% by 2033, up from xx% in 2024. The shift towards larger capacity batteries (above 80 kWh) is a noticeable trend.
Dominant Regions, Countries, or Segments in US Electric Commercial Vehicle Battery Pack Market
California, New York, and Texas are the leading states in the US electric commercial vehicle battery pack market due to supportive policies, robust infrastructure, and high adoption rates. Within segments, BEV propulsion type dominates, followed by PHEV. The Bus segment exhibits the fastest growth rate, followed by M&HDT and LCV. NMC and LFP battery chemistries hold significant market share, driven by their cost-effectiveness and performance. High-capacity battery packs (above 80 kWh) are experiencing robust growth, reflecting the demand for longer range and higher payload capabilities. The prismatic battery form factor leads the market.
- Key Drivers:
- California's Zero Emission Vehicle (ZEV) mandates.
- Federal tax credits and incentives for electric vehicle adoption.
- Growing demand for sustainable transportation solutions.
- Expanding charging infrastructure.
- Dominant Segments:
- Propulsion Type: BEV > PHEV
- Body Type: Bus > M&HDT > LCV
- Battery Chemistry: NMC & LFP
- Battery Capacity: Above 80 kWh
- Battery Form: Prismatic
US Electric Commercial Vehicle Battery Pack Market Product Landscape
The US electric commercial vehicle battery pack market showcases a diverse range of products, differing in capacity, chemistry, form factor, and thermal management systems. Innovation centers around enhancing energy density, improving lifespan, and optimizing safety features. Unique selling propositions include fast charging capabilities, advanced battery management systems (BMS), and robust thermal control mechanisms. Technological advancements are focused on solid-state batteries, which promise higher energy density and improved safety.
Key Drivers, Barriers & Challenges in US Electric Commercial Vehicle Battery Pack Market
Key Drivers:
- Growing environmental concerns and stringent emission regulations are driving the adoption of electric commercial vehicles.
- Government incentives and subsidies are accelerating the transition to electric mobility.
- Technological advancements in battery technology are making electric commercial vehicles more competitive.
Challenges:
- High initial cost of electric commercial vehicles remains a barrier for many businesses.
- Limited charging infrastructure in some regions restricts adoption.
- Supply chain disruptions and raw material price volatility impact battery production costs. This issue has increased production costs by approximately xx% in 2024.
Emerging Opportunities in US Electric Commercial Vehicle Battery Pack Market
Untapped markets in rural areas and smaller cities present significant growth opportunities. The development of second-life battery applications for energy storage offers potential for revenue generation and sustainability. Emerging battery chemistries like solid-state batteries promise improved performance and safety, opening new avenues for innovation. Growth in the last-mile delivery and urban transit sectors presents strong market expansion opportunities.
Growth Accelerators in the US Electric Commercial Vehicle Battery Pack Market Industry
Strategic partnerships between battery manufacturers and vehicle OEMs are fostering innovation and accelerating market growth. Technological breakthroughs in battery chemistry and manufacturing processes are driving down costs and enhancing performance. Government initiatives promoting the development of domestic battery manufacturing capacity enhance supply chain resilience and market competitiveness. Expansion into new segments, such as heavy-duty trucks and specialized commercial vehicles, broadens the market's reach.
Key Players Shaping the US Electric Commercial Vehicle Battery Pack Market Market
- Econtrols LLC
- Samsung SDI Co Ltd
- LG Energy Solution Ltd
- Imperium3 New York (IM3NY)
- XALT Energ
- Contemporary Amperex Technology Co Ltd (CATL)
- Tesla Inc
- Robert Bosch GmbH
- BYD Company Ltd
- SK Innovation Co Ltd
- Proterra Operating Company Inc
- Panasonic Holdings Corporation
- Envision AESC Japan Co Ltd
Notable Milestones in US Electric Commercial Vehicle Battery Pack Market Sector
- August 2022: LG Energy Solutions and Honda Motor Co. announced a joint venture to produce electric vehicle batteries in the United States, significantly boosting domestic production capacity and securing supply chain partnerships.
- September 2022: LG Energy Solution partnered with three Canadian suppliers to strengthen the North American EV battery supply chain, addressing concerns over raw material sourcing and geopolitical risks.
- February 2023: LG Energy Solution received USD 237 million in funding for a Honda battery plant project in Ohio, highlighting substantial government support for domestic battery manufacturing and large-scale investments in the sector.
In-Depth US Electric Commercial Vehicle Battery Pack Market Market Outlook
The future of the US electric commercial vehicle battery pack market is bright, driven by ongoing technological advancements, supportive government policies, and increasing demand for sustainable transportation solutions. Strategic opportunities exist in developing advanced battery chemistries, optimizing supply chains, and expanding into new and underserved market segments. The continued focus on improving battery performance, lowering costs, and enhancing safety will shape the market's trajectory in the coming years. The market's robust growth trajectory promises significant returns for investors and stakeholders across the value chain.
US Electric Commercial Vehicle Battery Pack Market Segmentation
-
1. Body Type
- 1.1. Bus
- 1.2. LCV
- 1.3. M&HDT
-
2. Propulsion Type
- 2.1. BEV
- 2.2. PHEV
-
3. Battery Chemistry
- 3.1. LFP
- 3.2. NCA
- 3.3. NCM
- 3.4. NMC
- 3.5. Others
-
4. Capacity
- 4.1. 15 kWh to 40 kWh
- 4.2. 40 kWh to 80 kWh
- 4.3. Above 80 kWh
- 4.4. Less than 15 kWh
-
5. Battery Form
- 5.1. Cylindrical
- 5.2. Pouch
- 5.3. Prismatic
-
6. Method
- 6.1. Laser
- 6.2. Wire
-
7. Component
- 7.1. Anode
- 7.2. Cathode
- 7.3. Electrolyte
- 7.4. Separator
-
8. Material Type
- 8.1. Cobalt
- 8.2. Lithium
- 8.3. Manganese
- 8.4. Natural Graphite
- 8.5. Nickel
- 8.6. Other Materials
US Electric Commercial Vehicle Battery Pack Market Segmentation By Geography
-
1. North America
- 1.1. United States
- 1.2. Canada
- 1.3. Mexico
-
2. South America
- 2.1. Brazil
- 2.2. Argentina
- 2.3. Rest of South America
-
3. Europe
- 3.1. United Kingdom
- 3.2. Germany
- 3.3. France
- 3.4. Italy
- 3.5. Spain
- 3.6. Russia
- 3.7. Benelux
- 3.8. Nordics
- 3.9. Rest of Europe
-
4. Middle East & Africa
- 4.1. Turkey
- 4.2. Israel
- 4.3. GCC
- 4.4. North Africa
- 4.5. South Africa
- 4.6. Rest of Middle East & Africa
-
5. Asia Pacific
- 5.1. China
- 5.2. India
- 5.3. Japan
- 5.4. South Korea
- 5.5. ASEAN
- 5.6. Oceania
- 5.7. Rest of Asia Pacific
US Electric Commercial Vehicle Battery Pack Market REPORT HIGHLIGHTS
| Aspects | Details |
|---|---|
| Study Period | 2019-2033 |
| Base Year | 2024 |
| Estimated Year | 2025 |
| Forecast Period | 2025-2033 |
| Historical Period | 2019-2024 |
| Growth Rate | CAGR of 10.55% from 2019-2033 |
| Segmentation |
|
Table of Contents
- 1. Introduction
- 1.1. Research Scope
- 1.2. Market Segmentation
- 1.3. Research Methodology
- 1.4. Definitions and Assumptions
- 2. Executive Summary
- 2.1. Introduction
- 3. Market Dynamics
- 3.1. Introduction
- 3.2. Market Drivers
- 3.2.1. Growing Travel and Tourism Industry is Driving the Car Rental Market
- 3.3. Market Restrains
- 3.3.1. Increasing Popularity of Ride-Sharing Services Pose Challenges for the Conventional Car Rental Market
- 3.4. Market Trends
- 3.4.1. OTHER KEY INDUSTRY TRENDS COVERED IN THE REPORT
- 4. Market Factor Analysis
- 4.1. Porters Five Forces
- 4.2. Supply/Value Chain
- 4.3. PESTEL analysis
- 4.4. Market Entropy
- 4.5. Patent/Trademark Analysis
- 5. Global US Electric Commercial Vehicle Battery Pack Market Analysis, Insights and Forecast, 2019-2031
- 5.1. Market Analysis, Insights and Forecast - by Body Type
- 5.1.1. Bus
- 5.1.2. LCV
- 5.1.3. M&HDT
- 5.2. Market Analysis, Insights and Forecast - by Propulsion Type
- 5.2.1. BEV
- 5.2.2. PHEV
- 5.3. Market Analysis, Insights and Forecast - by Battery Chemistry
- 5.3.1. LFP
- 5.3.2. NCA
- 5.3.3. NCM
- 5.3.4. NMC
- 5.3.5. Others
- 5.4. Market Analysis, Insights and Forecast - by Capacity
- 5.4.1. 15 kWh to 40 kWh
- 5.4.2. 40 kWh to 80 kWh
- 5.4.3. Above 80 kWh
- 5.4.4. Less than 15 kWh
- 5.5. Market Analysis, Insights and Forecast - by Battery Form
- 5.5.1. Cylindrical
- 5.5.2. Pouch
- 5.5.3. Prismatic
- 5.6. Market Analysis, Insights and Forecast - by Method
- 5.6.1. Laser
- 5.6.2. Wire
- 5.7. Market Analysis, Insights and Forecast - by Component
- 5.7.1. Anode
- 5.7.2. Cathode
- 5.7.3. Electrolyte
- 5.7.4. Separator
- 5.8. Market Analysis, Insights and Forecast - by Material Type
- 5.8.1. Cobalt
- 5.8.2. Lithium
- 5.8.3. Manganese
- 5.8.4. Natural Graphite
- 5.8.5. Nickel
- 5.8.6. Other Materials
- 5.9. Market Analysis, Insights and Forecast - by Region
- 5.9.1. North America
- 5.9.2. South America
- 5.9.3. Europe
- 5.9.4. Middle East & Africa
- 5.9.5. Asia Pacific
- 5.1. Market Analysis, Insights and Forecast - by Body Type
- 6. North America US Electric Commercial Vehicle Battery Pack Market Analysis, Insights and Forecast, 2019-2031
- 6.1. Market Analysis, Insights and Forecast - by Body Type
- 6.1.1. Bus
- 6.1.2. LCV
- 6.1.3. M&HDT
- 6.2. Market Analysis, Insights and Forecast - by Propulsion Type
- 6.2.1. BEV
- 6.2.2. PHEV
- 6.3. Market Analysis, Insights and Forecast - by Battery Chemistry
- 6.3.1. LFP
- 6.3.2. NCA
- 6.3.3. NCM
- 6.3.4. NMC
- 6.3.5. Others
- 6.4. Market Analysis, Insights and Forecast - by Capacity
- 6.4.1. 15 kWh to 40 kWh
- 6.4.2. 40 kWh to 80 kWh
- 6.4.3. Above 80 kWh
- 6.4.4. Less than 15 kWh
- 6.5. Market Analysis, Insights and Forecast - by Battery Form
- 6.5.1. Cylindrical
- 6.5.2. Pouch
- 6.5.3. Prismatic
- 6.6. Market Analysis, Insights and Forecast - by Method
- 6.6.1. Laser
- 6.6.2. Wire
- 6.7. Market Analysis, Insights and Forecast - by Component
- 6.7.1. Anode
- 6.7.2. Cathode
- 6.7.3. Electrolyte
- 6.7.4. Separator
- 6.8. Market Analysis, Insights and Forecast - by Material Type
- 6.8.1. Cobalt
- 6.8.2. Lithium
- 6.8.3. Manganese
- 6.8.4. Natural Graphite
- 6.8.5. Nickel
- 6.8.6. Other Materials
- 6.1. Market Analysis, Insights and Forecast - by Body Type
- 7. South America US Electric Commercial Vehicle Battery Pack Market Analysis, Insights and Forecast, 2019-2031
- 7.1. Market Analysis, Insights and Forecast - by Body Type
- 7.1.1. Bus
- 7.1.2. LCV
- 7.1.3. M&HDT
- 7.2. Market Analysis, Insights and Forecast - by Propulsion Type
- 7.2.1. BEV
- 7.2.2. PHEV
- 7.3. Market Analysis, Insights and Forecast - by Battery Chemistry
- 7.3.1. LFP
- 7.3.2. NCA
- 7.3.3. NCM
- 7.3.4. NMC
- 7.3.5. Others
- 7.4. Market Analysis, Insights and Forecast - by Capacity
- 7.4.1. 15 kWh to 40 kWh
- 7.4.2. 40 kWh to 80 kWh
- 7.4.3. Above 80 kWh
- 7.4.4. Less than 15 kWh
- 7.5. Market Analysis, Insights and Forecast - by Battery Form
- 7.5.1. Cylindrical
- 7.5.2. Pouch
- 7.5.3. Prismatic
- 7.6. Market Analysis, Insights and Forecast - by Method
- 7.6.1. Laser
- 7.6.2. Wire
- 7.7. Market Analysis, Insights and Forecast - by Component
- 7.7.1. Anode
- 7.7.2. Cathode
- 7.7.3. Electrolyte
- 7.7.4. Separator
- 7.8. Market Analysis, Insights and Forecast - by Material Type
- 7.8.1. Cobalt
- 7.8.2. Lithium
- 7.8.3. Manganese
- 7.8.4. Natural Graphite
- 7.8.5. Nickel
- 7.8.6. Other Materials
- 7.1. Market Analysis, Insights and Forecast - by Body Type
- 8. Europe US Electric Commercial Vehicle Battery Pack Market Analysis, Insights and Forecast, 2019-2031
- 8.1. Market Analysis, Insights and Forecast - by Body Type
- 8.1.1. Bus
- 8.1.2. LCV
- 8.1.3. M&HDT
- 8.2. Market Analysis, Insights and Forecast - by Propulsion Type
- 8.2.1. BEV
- 8.2.2. PHEV
- 8.3. Market Analysis, Insights and Forecast - by Battery Chemistry
- 8.3.1. LFP
- 8.3.2. NCA
- 8.3.3. NCM
- 8.3.4. NMC
- 8.3.5. Others
- 8.4. Market Analysis, Insights and Forecast - by Capacity
- 8.4.1. 15 kWh to 40 kWh
- 8.4.2. 40 kWh to 80 kWh
- 8.4.3. Above 80 kWh
- 8.4.4. Less than 15 kWh
- 8.5. Market Analysis, Insights and Forecast - by Battery Form
- 8.5.1. Cylindrical
- 8.5.2. Pouch
- 8.5.3. Prismatic
- 8.6. Market Analysis, Insights and Forecast - by Method
- 8.6.1. Laser
- 8.6.2. Wire
- 8.7. Market Analysis, Insights and Forecast - by Component
- 8.7.1. Anode
- 8.7.2. Cathode
- 8.7.3. Electrolyte
- 8.7.4. Separator
- 8.8. Market Analysis, Insights and Forecast - by Material Type
- 8.8.1. Cobalt
- 8.8.2. Lithium
- 8.8.3. Manganese
- 8.8.4. Natural Graphite
- 8.8.5. Nickel
- 8.8.6. Other Materials
- 8.1. Market Analysis, Insights and Forecast - by Body Type
- 9. Middle East & Africa US Electric Commercial Vehicle Battery Pack Market Analysis, Insights and Forecast, 2019-2031
- 9.1. Market Analysis, Insights and Forecast - by Body Type
- 9.1.1. Bus
- 9.1.2. LCV
- 9.1.3. M&HDT
- 9.2. Market Analysis, Insights and Forecast - by Propulsion Type
- 9.2.1. BEV
- 9.2.2. PHEV
- 9.3. Market Analysis, Insights and Forecast - by Battery Chemistry
- 9.3.1. LFP
- 9.3.2. NCA
- 9.3.3. NCM
- 9.3.4. NMC
- 9.3.5. Others
- 9.4. Market Analysis, Insights and Forecast - by Capacity
- 9.4.1. 15 kWh to 40 kWh
- 9.4.2. 40 kWh to 80 kWh
- 9.4.3. Above 80 kWh
- 9.4.4. Less than 15 kWh
- 9.5. Market Analysis, Insights and Forecast - by Battery Form
- 9.5.1. Cylindrical
- 9.5.2. Pouch
- 9.5.3. Prismatic
- 9.6. Market Analysis, Insights and Forecast - by Method
- 9.6.1. Laser
- 9.6.2. Wire
- 9.7. Market Analysis, Insights and Forecast - by Component
- 9.7.1. Anode
- 9.7.2. Cathode
- 9.7.3. Electrolyte
- 9.7.4. Separator
- 9.8. Market Analysis, Insights and Forecast - by Material Type
- 9.8.1. Cobalt
- 9.8.2. Lithium
- 9.8.3. Manganese
- 9.8.4. Natural Graphite
- 9.8.5. Nickel
- 9.8.6. Other Materials
- 9.1. Market Analysis, Insights and Forecast - by Body Type
- 10. Asia Pacific US Electric Commercial Vehicle Battery Pack Market Analysis, Insights and Forecast, 2019-2031
- 10.1. Market Analysis, Insights and Forecast - by Body Type
- 10.1.1. Bus
- 10.1.2. LCV
- 10.1.3. M&HDT
- 10.2. Market Analysis, Insights and Forecast - by Propulsion Type
- 10.2.1. BEV
- 10.2.2. PHEV
- 10.3. Market Analysis, Insights and Forecast - by Battery Chemistry
- 10.3.1. LFP
- 10.3.2. NCA
- 10.3.3. NCM
- 10.3.4. NMC
- 10.3.5. Others
- 10.4. Market Analysis, Insights and Forecast - by Capacity
- 10.4.1. 15 kWh to 40 kWh
- 10.4.2. 40 kWh to 80 kWh
- 10.4.3. Above 80 kWh
- 10.4.4. Less than 15 kWh
- 10.5. Market Analysis, Insights and Forecast - by Battery Form
- 10.5.1. Cylindrical
- 10.5.2. Pouch
- 10.5.3. Prismatic
- 10.6. Market Analysis, Insights and Forecast - by Method
- 10.6.1. Laser
- 10.6.2. Wire
- 10.7. Market Analysis, Insights and Forecast - by Component
- 10.7.1. Anode
- 10.7.2. Cathode
- 10.7.3. Electrolyte
- 10.7.4. Separator
- 10.8. Market Analysis, Insights and Forecast - by Material Type
- 10.8.1. Cobalt
- 10.8.2. Lithium
- 10.8.3. Manganese
- 10.8.4. Natural Graphite
- 10.8.5. Nickel
- 10.8.6. Other Materials
- 10.1. Market Analysis, Insights and Forecast - by Body Type
- 11. Northeast US Electric Commercial Vehicle Battery Pack Market Analysis, Insights and Forecast, 2019-2031
- 12. Southeast US Electric Commercial Vehicle Battery Pack Market Analysis, Insights and Forecast, 2019-2031
- 13. Midwest US Electric Commercial Vehicle Battery Pack Market Analysis, Insights and Forecast, 2019-2031
- 14. Southwest US Electric Commercial Vehicle Battery Pack Market Analysis, Insights and Forecast, 2019-2031
- 15. West US Electric Commercial Vehicle Battery Pack Market Analysis, Insights and Forecast, 2019-2031
- 16. Competitive Analysis
- 16.1. Global Market Share Analysis 2024
- 16.2. Company Profiles
- 16.2.1 Econtrols LLC
- 16.2.1.1. Overview
- 16.2.1.2. Products
- 16.2.1.3. SWOT Analysis
- 16.2.1.4. Recent Developments
- 16.2.1.5. Financials (Based on Availability)
- 16.2.2 Samsung SDI Co Ltd
- 16.2.2.1. Overview
- 16.2.2.2. Products
- 16.2.2.3. SWOT Analysis
- 16.2.2.4. Recent Developments
- 16.2.2.5. Financials (Based on Availability)
- 16.2.3 LG Energy Solution Ltd
- 16.2.3.1. Overview
- 16.2.3.2. Products
- 16.2.3.3. SWOT Analysis
- 16.2.3.4. Recent Developments
- 16.2.3.5. Financials (Based on Availability)
- 16.2.4 Imperium3 New York (IM3NY)
- 16.2.4.1. Overview
- 16.2.4.2. Products
- 16.2.4.3. SWOT Analysis
- 16.2.4.4. Recent Developments
- 16.2.4.5. Financials (Based on Availability)
- 16.2.5 XALT Energ
- 16.2.5.1. Overview
- 16.2.5.2. Products
- 16.2.5.3. SWOT Analysis
- 16.2.5.4. Recent Developments
- 16.2.5.5. Financials (Based on Availability)
- 16.2.6 Contemporary Amperex Technology Co Ltd (CATL)
- 16.2.6.1. Overview
- 16.2.6.2. Products
- 16.2.6.3. SWOT Analysis
- 16.2.6.4. Recent Developments
- 16.2.6.5. Financials (Based on Availability)
- 16.2.7 Tesla Inc
- 16.2.7.1. Overview
- 16.2.7.2. Products
- 16.2.7.3. SWOT Analysis
- 16.2.7.4. Recent Developments
- 16.2.7.5. Financials (Based on Availability)
- 16.2.8 Robert Bosch GmbH
- 16.2.8.1. Overview
- 16.2.8.2. Products
- 16.2.8.3. SWOT Analysis
- 16.2.8.4. Recent Developments
- 16.2.8.5. Financials (Based on Availability)
- 16.2.9 BYD Company Ltd
- 16.2.9.1. Overview
- 16.2.9.2. Products
- 16.2.9.3. SWOT Analysis
- 16.2.9.4. Recent Developments
- 16.2.9.5. Financials (Based on Availability)
- 16.2.10 SK Innovation Co Ltd
- 16.2.10.1. Overview
- 16.2.10.2. Products
- 16.2.10.3. SWOT Analysis
- 16.2.10.4. Recent Developments
- 16.2.10.5. Financials (Based on Availability)
- 16.2.11 Proterra Operating Company Inc
- 16.2.11.1. Overview
- 16.2.11.2. Products
- 16.2.11.3. SWOT Analysis
- 16.2.11.4. Recent Developments
- 16.2.11.5. Financials (Based on Availability)
- 16.2.12 Panasonic Holdings Corporation
- 16.2.12.1. Overview
- 16.2.12.2. Products
- 16.2.12.3. SWOT Analysis
- 16.2.12.4. Recent Developments
- 16.2.12.5. Financials (Based on Availability)
- 16.2.13 Envision AESC Japan Co Ltd
- 16.2.13.1. Overview
- 16.2.13.2. Products
- 16.2.13.3. SWOT Analysis
- 16.2.13.4. Recent Developments
- 16.2.13.5. Financials (Based on Availability)
- 16.2.1 Econtrols LLC
List of Figures
- Figure 1: Global US Electric Commercial Vehicle Battery Pack Market Revenue Breakdown (Million, %) by Region 2024 & 2032
- Figure 2: United states US Electric Commercial Vehicle Battery Pack Market Revenue (Million), by Country 2024 & 2032
- Figure 3: United states US Electric Commercial Vehicle Battery Pack Market Revenue Share (%), by Country 2024 & 2032
- Figure 4: North America US Electric Commercial Vehicle Battery Pack Market Revenue (Million), by Body Type 2024 & 2032
- Figure 5: North America US Electric Commercial Vehicle Battery Pack Market Revenue Share (%), by Body Type 2024 & 2032
- Figure 6: North America US Electric Commercial Vehicle Battery Pack Market Revenue (Million), by Propulsion Type 2024 & 2032
- Figure 7: North America US Electric Commercial Vehicle Battery Pack Market Revenue Share (%), by Propulsion Type 2024 & 2032
- Figure 8: North America US Electric Commercial Vehicle Battery Pack Market Revenue (Million), by Battery Chemistry 2024 & 2032
- Figure 9: North America US Electric Commercial Vehicle Battery Pack Market Revenue Share (%), by Battery Chemistry 2024 & 2032
- Figure 10: North America US Electric Commercial Vehicle Battery Pack Market Revenue (Million), by Capacity 2024 & 2032
- Figure 11: North America US Electric Commercial Vehicle Battery Pack Market Revenue Share (%), by Capacity 2024 & 2032
- Figure 12: North America US Electric Commercial Vehicle Battery Pack Market Revenue (Million), by Battery Form 2024 & 2032
- Figure 13: North America US Electric Commercial Vehicle Battery Pack Market Revenue Share (%), by Battery Form 2024 & 2032
- Figure 14: North America US Electric Commercial Vehicle Battery Pack Market Revenue (Million), by Method 2024 & 2032
- Figure 15: North America US Electric Commercial Vehicle Battery Pack Market Revenue Share (%), by Method 2024 & 2032
- Figure 16: North America US Electric Commercial Vehicle Battery Pack Market Revenue (Million), by Component 2024 & 2032
- Figure 17: North America US Electric Commercial Vehicle Battery Pack Market Revenue Share (%), by Component 2024 & 2032
- Figure 18: North America US Electric Commercial Vehicle Battery Pack Market Revenue (Million), by Material Type 2024 & 2032
- Figure 19: North America US Electric Commercial Vehicle Battery Pack Market Revenue Share (%), by Material Type 2024 & 2032
- Figure 20: North America US Electric Commercial Vehicle Battery Pack Market Revenue (Million), by Country 2024 & 2032
- Figure 21: North America US Electric Commercial Vehicle Battery Pack Market Revenue Share (%), by Country 2024 & 2032
- Figure 22: South America US Electric Commercial Vehicle Battery Pack Market Revenue (Million), by Body Type 2024 & 2032
- Figure 23: South America US Electric Commercial Vehicle Battery Pack Market Revenue Share (%), by Body Type 2024 & 2032
- Figure 24: South America US Electric Commercial Vehicle Battery Pack Market Revenue (Million), by Propulsion Type 2024 & 2032
- Figure 25: South America US Electric Commercial Vehicle Battery Pack Market Revenue Share (%), by Propulsion Type 2024 & 2032
- Figure 26: South America US Electric Commercial Vehicle Battery Pack Market Revenue (Million), by Battery Chemistry 2024 & 2032
- Figure 27: South America US Electric Commercial Vehicle Battery Pack Market Revenue Share (%), by Battery Chemistry 2024 & 2032
- Figure 28: South America US Electric Commercial Vehicle Battery Pack Market Revenue (Million), by Capacity 2024 & 2032
- Figure 29: South America US Electric Commercial Vehicle Battery Pack Market Revenue Share (%), by Capacity 2024 & 2032
- Figure 30: South America US Electric Commercial Vehicle Battery Pack Market Revenue (Million), by Battery Form 2024 & 2032
- Figure 31: South America US Electric Commercial Vehicle Battery Pack Market Revenue Share (%), by Battery Form 2024 & 2032
- Figure 32: South America US Electric Commercial Vehicle Battery Pack Market Revenue (Million), by Method 2024 & 2032
- Figure 33: South America US Electric Commercial Vehicle Battery Pack Market Revenue Share (%), by Method 2024 & 2032
- Figure 34: South America US Electric Commercial Vehicle Battery Pack Market Revenue (Million), by Component 2024 & 2032
- Figure 35: South America US Electric Commercial Vehicle Battery Pack Market Revenue Share (%), by Component 2024 & 2032
- Figure 36: South America US Electric Commercial Vehicle Battery Pack Market Revenue (Million), by Material Type 2024 & 2032
- Figure 37: South America US Electric Commercial Vehicle Battery Pack Market Revenue Share (%), by Material Type 2024 & 2032
- Figure 38: South America US Electric Commercial Vehicle Battery Pack Market Revenue (Million), by Country 2024 & 2032
- Figure 39: South America US Electric Commercial Vehicle Battery Pack Market Revenue Share (%), by Country 2024 & 2032
- Figure 40: Europe US Electric Commercial Vehicle Battery Pack Market Revenue (Million), by Body Type 2024 & 2032
- Figure 41: Europe US Electric Commercial Vehicle Battery Pack Market Revenue Share (%), by Body Type 2024 & 2032
- Figure 42: Europe US Electric Commercial Vehicle Battery Pack Market Revenue (Million), by Propulsion Type 2024 & 2032
- Figure 43: Europe US Electric Commercial Vehicle Battery Pack Market Revenue Share (%), by Propulsion Type 2024 & 2032
- Figure 44: Europe US Electric Commercial Vehicle Battery Pack Market Revenue (Million), by Battery Chemistry 2024 & 2032
- Figure 45: Europe US Electric Commercial Vehicle Battery Pack Market Revenue Share (%), by Battery Chemistry 2024 & 2032
- Figure 46: Europe US Electric Commercial Vehicle Battery Pack Market Revenue (Million), by Capacity 2024 & 2032
- Figure 47: Europe US Electric Commercial Vehicle Battery Pack Market Revenue Share (%), by Capacity 2024 & 2032
- Figure 48: Europe US Electric Commercial Vehicle Battery Pack Market Revenue (Million), by Battery Form 2024 & 2032
- Figure 49: Europe US Electric Commercial Vehicle Battery Pack Market Revenue Share (%), by Battery Form 2024 & 2032
- Figure 50: Europe US Electric Commercial Vehicle Battery Pack Market Revenue (Million), by Method 2024 & 2032
- Figure 51: Europe US Electric Commercial Vehicle Battery Pack Market Revenue Share (%), by Method 2024 & 2032
- Figure 52: Europe US Electric Commercial Vehicle Battery Pack Market Revenue (Million), by Component 2024 & 2032
- Figure 53: Europe US Electric Commercial Vehicle Battery Pack Market Revenue Share (%), by Component 2024 & 2032
- Figure 54: Europe US Electric Commercial Vehicle Battery Pack Market Revenue (Million), by Material Type 2024 & 2032
- Figure 55: Europe US Electric Commercial Vehicle Battery Pack Market Revenue Share (%), by Material Type 2024 & 2032
- Figure 56: Europe US Electric Commercial Vehicle Battery Pack Market Revenue (Million), by Country 2024 & 2032
- Figure 57: Europe US Electric Commercial Vehicle Battery Pack Market Revenue Share (%), by Country 2024 & 2032
- Figure 58: Middle East & Africa US Electric Commercial Vehicle Battery Pack Market Revenue (Million), by Body Type 2024 & 2032
- Figure 59: Middle East & Africa US Electric Commercial Vehicle Battery Pack Market Revenue Share (%), by Body Type 2024 & 2032
- Figure 60: Middle East & Africa US Electric Commercial Vehicle Battery Pack Market Revenue (Million), by Propulsion Type 2024 & 2032
- Figure 61: Middle East & Africa US Electric Commercial Vehicle Battery Pack Market Revenue Share (%), by Propulsion Type 2024 & 2032
- Figure 62: Middle East & Africa US Electric Commercial Vehicle Battery Pack Market Revenue (Million), by Battery Chemistry 2024 & 2032
- Figure 63: Middle East & Africa US Electric Commercial Vehicle Battery Pack Market Revenue Share (%), by Battery Chemistry 2024 & 2032
- Figure 64: Middle East & Africa US Electric Commercial Vehicle Battery Pack Market Revenue (Million), by Capacity 2024 & 2032
- Figure 65: Middle East & Africa US Electric Commercial Vehicle Battery Pack Market Revenue Share (%), by Capacity 2024 & 2032
- Figure 66: Middle East & Africa US Electric Commercial Vehicle Battery Pack Market Revenue (Million), by Battery Form 2024 & 2032
- Figure 67: Middle East & Africa US Electric Commercial Vehicle Battery Pack Market Revenue Share (%), by Battery Form 2024 & 2032
- Figure 68: Middle East & Africa US Electric Commercial Vehicle Battery Pack Market Revenue (Million), by Method 2024 & 2032
- Figure 69: Middle East & Africa US Electric Commercial Vehicle Battery Pack Market Revenue Share (%), by Method 2024 & 2032
- Figure 70: Middle East & Africa US Electric Commercial Vehicle Battery Pack Market Revenue (Million), by Component 2024 & 2032
- Figure 71: Middle East & Africa US Electric Commercial Vehicle Battery Pack Market Revenue Share (%), by Component 2024 & 2032
- Figure 72: Middle East & Africa US Electric Commercial Vehicle Battery Pack Market Revenue (Million), by Material Type 2024 & 2032
- Figure 73: Middle East & Africa US Electric Commercial Vehicle Battery Pack Market Revenue Share (%), by Material Type 2024 & 2032
- Figure 74: Middle East & Africa US Electric Commercial Vehicle Battery Pack Market Revenue (Million), by Country 2024 & 2032
- Figure 75: Middle East & Africa US Electric Commercial Vehicle Battery Pack Market Revenue Share (%), by Country 2024 & 2032
- Figure 76: Asia Pacific US Electric Commercial Vehicle Battery Pack Market Revenue (Million), by Body Type 2024 & 2032
- Figure 77: Asia Pacific US Electric Commercial Vehicle Battery Pack Market Revenue Share (%), by Body Type 2024 & 2032
- Figure 78: Asia Pacific US Electric Commercial Vehicle Battery Pack Market Revenue (Million), by Propulsion Type 2024 & 2032
- Figure 79: Asia Pacific US Electric Commercial Vehicle Battery Pack Market Revenue Share (%), by Propulsion Type 2024 & 2032
- Figure 80: Asia Pacific US Electric Commercial Vehicle Battery Pack Market Revenue (Million), by Battery Chemistry 2024 & 2032
- Figure 81: Asia Pacific US Electric Commercial Vehicle Battery Pack Market Revenue Share (%), by Battery Chemistry 2024 & 2032
- Figure 82: Asia Pacific US Electric Commercial Vehicle Battery Pack Market Revenue (Million), by Capacity 2024 & 2032
- Figure 83: Asia Pacific US Electric Commercial Vehicle Battery Pack Market Revenue Share (%), by Capacity 2024 & 2032
- Figure 84: Asia Pacific US Electric Commercial Vehicle Battery Pack Market Revenue (Million), by Battery Form 2024 & 2032
- Figure 85: Asia Pacific US Electric Commercial Vehicle Battery Pack Market Revenue Share (%), by Battery Form 2024 & 2032
- Figure 86: Asia Pacific US Electric Commercial Vehicle Battery Pack Market Revenue (Million), by Method 2024 & 2032
- Figure 87: Asia Pacific US Electric Commercial Vehicle Battery Pack Market Revenue Share (%), by Method 2024 & 2032
- Figure 88: Asia Pacific US Electric Commercial Vehicle Battery Pack Market Revenue (Million), by Component 2024 & 2032
- Figure 89: Asia Pacific US Electric Commercial Vehicle Battery Pack Market Revenue Share (%), by Component 2024 & 2032
- Figure 90: Asia Pacific US Electric Commercial Vehicle Battery Pack Market Revenue (Million), by Material Type 2024 & 2032
- Figure 91: Asia Pacific US Electric Commercial Vehicle Battery Pack Market Revenue Share (%), by Material Type 2024 & 2032
- Figure 92: Asia Pacific US Electric Commercial Vehicle Battery Pack Market Revenue (Million), by Country 2024 & 2032
- Figure 93: Asia Pacific US Electric Commercial Vehicle Battery Pack Market Revenue Share (%), by Country 2024 & 2032
List of Tables
- Table 1: Global US Electric Commercial Vehicle Battery Pack Market Revenue Million Forecast, by Region 2019 & 2032
- Table 2: Global US Electric Commercial Vehicle Battery Pack Market Revenue Million Forecast, by Body Type 2019 & 2032
- Table 3: Global US Electric Commercial Vehicle Battery Pack Market Revenue Million Forecast, by Propulsion Type 2019 & 2032
- Table 4: Global US Electric Commercial Vehicle Battery Pack Market Revenue Million Forecast, by Battery Chemistry 2019 & 2032
- Table 5: Global US Electric Commercial Vehicle Battery Pack Market Revenue Million Forecast, by Capacity 2019 & 2032
- Table 6: Global US Electric Commercial Vehicle Battery Pack Market Revenue Million Forecast, by Battery Form 2019 & 2032
- Table 7: Global US Electric Commercial Vehicle Battery Pack Market Revenue Million Forecast, by Method 2019 & 2032
- Table 8: Global US Electric Commercial Vehicle Battery Pack Market Revenue Million Forecast, by Component 2019 & 2032
- Table 9: Global US Electric Commercial Vehicle Battery Pack Market Revenue Million Forecast, by Material Type 2019 & 2032
- Table 10: Global US Electric Commercial Vehicle Battery Pack Market Revenue Million Forecast, by Region 2019 & 2032
- Table 11: Global US Electric Commercial Vehicle Battery Pack Market Revenue Million Forecast, by Country 2019 & 2032
- Table 12: Northeast US Electric Commercial Vehicle Battery Pack Market Revenue (Million) Forecast, by Application 2019 & 2032
- Table 13: Southeast US Electric Commercial Vehicle Battery Pack Market Revenue (Million) Forecast, by Application 2019 & 2032
- Table 14: Midwest US Electric Commercial Vehicle Battery Pack Market Revenue (Million) Forecast, by Application 2019 & 2032
- Table 15: Southwest US Electric Commercial Vehicle Battery Pack Market Revenue (Million) Forecast, by Application 2019 & 2032
- Table 16: West US Electric Commercial Vehicle Battery Pack Market Revenue (Million) Forecast, by Application 2019 & 2032
- Table 17: Global US Electric Commercial Vehicle Battery Pack Market Revenue Million Forecast, by Body Type 2019 & 2032
- Table 18: Global US Electric Commercial Vehicle Battery Pack Market Revenue Million Forecast, by Propulsion Type 2019 & 2032
- Table 19: Global US Electric Commercial Vehicle Battery Pack Market Revenue Million Forecast, by Battery Chemistry 2019 & 2032
- Table 20: Global US Electric Commercial Vehicle Battery Pack Market Revenue Million Forecast, by Capacity 2019 & 2032
- Table 21: Global US Electric Commercial Vehicle Battery Pack Market Revenue Million Forecast, by Battery Form 2019 & 2032
- Table 22: Global US Electric Commercial Vehicle Battery Pack Market Revenue Million Forecast, by Method 2019 & 2032
- Table 23: Global US Electric Commercial Vehicle Battery Pack Market Revenue Million Forecast, by Component 2019 & 2032
- Table 24: Global US Electric Commercial Vehicle Battery Pack Market Revenue Million Forecast, by Material Type 2019 & 2032
- Table 25: Global US Electric Commercial Vehicle Battery Pack Market Revenue Million Forecast, by Country 2019 & 2032
- Table 26: United States US Electric Commercial Vehicle Battery Pack Market Revenue (Million) Forecast, by Application 2019 & 2032
- Table 27: Canada US Electric Commercial Vehicle Battery Pack Market Revenue (Million) Forecast, by Application 2019 & 2032
- Table 28: Mexico US Electric Commercial Vehicle Battery Pack Market Revenue (Million) Forecast, by Application 2019 & 2032
- Table 29: Global US Electric Commercial Vehicle Battery Pack Market Revenue Million Forecast, by Body Type 2019 & 2032
- Table 30: Global US Electric Commercial Vehicle Battery Pack Market Revenue Million Forecast, by Propulsion Type 2019 & 2032
- Table 31: Global US Electric Commercial Vehicle Battery Pack Market Revenue Million Forecast, by Battery Chemistry 2019 & 2032
- Table 32: Global US Electric Commercial Vehicle Battery Pack Market Revenue Million Forecast, by Capacity 2019 & 2032
- Table 33: Global US Electric Commercial Vehicle Battery Pack Market Revenue Million Forecast, by Battery Form 2019 & 2032
- Table 34: Global US Electric Commercial Vehicle Battery Pack Market Revenue Million Forecast, by Method 2019 & 2032
- Table 35: Global US Electric Commercial Vehicle Battery Pack Market Revenue Million Forecast, by Component 2019 & 2032
- Table 36: Global US Electric Commercial Vehicle Battery Pack Market Revenue Million Forecast, by Material Type 2019 & 2032
- Table 37: Global US Electric Commercial Vehicle Battery Pack Market Revenue Million Forecast, by Country 2019 & 2032
- Table 38: Brazil US Electric Commercial Vehicle Battery Pack Market Revenue (Million) Forecast, by Application 2019 & 2032
- Table 39: Argentina US Electric Commercial Vehicle Battery Pack Market Revenue (Million) Forecast, by Application 2019 & 2032
- Table 40: Rest of South America US Electric Commercial Vehicle Battery Pack Market Revenue (Million) Forecast, by Application 2019 & 2032
- Table 41: Global US Electric Commercial Vehicle Battery Pack Market Revenue Million Forecast, by Body Type 2019 & 2032
- Table 42: Global US Electric Commercial Vehicle Battery Pack Market Revenue Million Forecast, by Propulsion Type 2019 & 2032
- Table 43: Global US Electric Commercial Vehicle Battery Pack Market Revenue Million Forecast, by Battery Chemistry 2019 & 2032
- Table 44: Global US Electric Commercial Vehicle Battery Pack Market Revenue Million Forecast, by Capacity 2019 & 2032
- Table 45: Global US Electric Commercial Vehicle Battery Pack Market Revenue Million Forecast, by Battery Form 2019 & 2032
- Table 46: Global US Electric Commercial Vehicle Battery Pack Market Revenue Million Forecast, by Method 2019 & 2032
- Table 47: Global US Electric Commercial Vehicle Battery Pack Market Revenue Million Forecast, by Component 2019 & 2032
- Table 48: Global US Electric Commercial Vehicle Battery Pack Market Revenue Million Forecast, by Material Type 2019 & 2032
- Table 49: Global US Electric Commercial Vehicle Battery Pack Market Revenue Million Forecast, by Country 2019 & 2032
- Table 50: United Kingdom US Electric Commercial Vehicle Battery Pack Market Revenue (Million) Forecast, by Application 2019 & 2032
- Table 51: Germany US Electric Commercial Vehicle Battery Pack Market Revenue (Million) Forecast, by Application 2019 & 2032
- Table 52: France US Electric Commercial Vehicle Battery Pack Market Revenue (Million) Forecast, by Application 2019 & 2032
- Table 53: Italy US Electric Commercial Vehicle Battery Pack Market Revenue (Million) Forecast, by Application 2019 & 2032
- Table 54: Spain US Electric Commercial Vehicle Battery Pack Market Revenue (Million) Forecast, by Application 2019 & 2032
- Table 55: Russia US Electric Commercial Vehicle Battery Pack Market Revenue (Million) Forecast, by Application 2019 & 2032
- Table 56: Benelux US Electric Commercial Vehicle Battery Pack Market Revenue (Million) Forecast, by Application 2019 & 2032
- Table 57: Nordics US Electric Commercial Vehicle Battery Pack Market Revenue (Million) Forecast, by Application 2019 & 2032
- Table 58: Rest of Europe US Electric Commercial Vehicle Battery Pack Market Revenue (Million) Forecast, by Application 2019 & 2032
- Table 59: Global US Electric Commercial Vehicle Battery Pack Market Revenue Million Forecast, by Body Type 2019 & 2032
- Table 60: Global US Electric Commercial Vehicle Battery Pack Market Revenue Million Forecast, by Propulsion Type 2019 & 2032
- Table 61: Global US Electric Commercial Vehicle Battery Pack Market Revenue Million Forecast, by Battery Chemistry 2019 & 2032
- Table 62: Global US Electric Commercial Vehicle Battery Pack Market Revenue Million Forecast, by Capacity 2019 & 2032
- Table 63: Global US Electric Commercial Vehicle Battery Pack Market Revenue Million Forecast, by Battery Form 2019 & 2032
- Table 64: Global US Electric Commercial Vehicle Battery Pack Market Revenue Million Forecast, by Method 2019 & 2032
- Table 65: Global US Electric Commercial Vehicle Battery Pack Market Revenue Million Forecast, by Component 2019 & 2032
- Table 66: Global US Electric Commercial Vehicle Battery Pack Market Revenue Million Forecast, by Material Type 2019 & 2032
- Table 67: Global US Electric Commercial Vehicle Battery Pack Market Revenue Million Forecast, by Country 2019 & 2032
- Table 68: Turkey US Electric Commercial Vehicle Battery Pack Market Revenue (Million) Forecast, by Application 2019 & 2032
- Table 69: Israel US Electric Commercial Vehicle Battery Pack Market Revenue (Million) Forecast, by Application 2019 & 2032
- Table 70: GCC US Electric Commercial Vehicle Battery Pack Market Revenue (Million) Forecast, by Application 2019 & 2032
- Table 71: North Africa US Electric Commercial Vehicle Battery Pack Market Revenue (Million) Forecast, by Application 2019 & 2032
- Table 72: South Africa US Electric Commercial Vehicle Battery Pack Market Revenue (Million) Forecast, by Application 2019 & 2032
- Table 73: Rest of Middle East & Africa US Electric Commercial Vehicle Battery Pack Market Revenue (Million) Forecast, by Application 2019 & 2032
- Table 74: Global US Electric Commercial Vehicle Battery Pack Market Revenue Million Forecast, by Body Type 2019 & 2032
- Table 75: Global US Electric Commercial Vehicle Battery Pack Market Revenue Million Forecast, by Propulsion Type 2019 & 2032
- Table 76: Global US Electric Commercial Vehicle Battery Pack Market Revenue Million Forecast, by Battery Chemistry 2019 & 2032
- Table 77: Global US Electric Commercial Vehicle Battery Pack Market Revenue Million Forecast, by Capacity 2019 & 2032
- Table 78: Global US Electric Commercial Vehicle Battery Pack Market Revenue Million Forecast, by Battery Form 2019 & 2032
- Table 79: Global US Electric Commercial Vehicle Battery Pack Market Revenue Million Forecast, by Method 2019 & 2032
- Table 80: Global US Electric Commercial Vehicle Battery Pack Market Revenue Million Forecast, by Component 2019 & 2032
- Table 81: Global US Electric Commercial Vehicle Battery Pack Market Revenue Million Forecast, by Material Type 2019 & 2032
- Table 82: Global US Electric Commercial Vehicle Battery Pack Market Revenue Million Forecast, by Country 2019 & 2032
- Table 83: China US Electric Commercial Vehicle Battery Pack Market Revenue (Million) Forecast, by Application 2019 & 2032
- Table 84: India US Electric Commercial Vehicle Battery Pack Market Revenue (Million) Forecast, by Application 2019 & 2032
- Table 85: Japan US Electric Commercial Vehicle Battery Pack Market Revenue (Million) Forecast, by Application 2019 & 2032
- Table 86: South Korea US Electric Commercial Vehicle Battery Pack Market Revenue (Million) Forecast, by Application 2019 & 2032
- Table 87: ASEAN US Electric Commercial Vehicle Battery Pack Market Revenue (Million) Forecast, by Application 2019 & 2032
- Table 88: Oceania US Electric Commercial Vehicle Battery Pack Market Revenue (Million) Forecast, by Application 2019 & 2032
- Table 89: Rest of Asia Pacific US Electric Commercial Vehicle Battery Pack Market Revenue (Million) Forecast, by Application 2019 & 2032
Frequently Asked Questions
1. What is the projected Compound Annual Growth Rate (CAGR) of the US Electric Commercial Vehicle Battery Pack Market?
The projected CAGR is approximately 10.55%.
2. Which companies are prominent players in the US Electric Commercial Vehicle Battery Pack Market?
Key companies in the market include Econtrols LLC, Samsung SDI Co Ltd, LG Energy Solution Ltd, Imperium3 New York (IM3NY), XALT Energ, Contemporary Amperex Technology Co Ltd (CATL), Tesla Inc, Robert Bosch GmbH, BYD Company Ltd, SK Innovation Co Ltd, Proterra Operating Company Inc, Panasonic Holdings Corporation, Envision AESC Japan Co Ltd.
3. What are the main segments of the US Electric Commercial Vehicle Battery Pack Market?
The market segments include Body Type, Propulsion Type, Battery Chemistry, Capacity, Battery Form, Method, Component, Material Type.
4. Can you provide details about the market size?
The market size is estimated to be USD XX Million as of 2022.
5. What are some drivers contributing to market growth?
Growing Travel and Tourism Industry is Driving the Car Rental Market.
6. What are the notable trends driving market growth?
OTHER KEY INDUSTRY TRENDS COVERED IN THE REPORT.
7. Are there any restraints impacting market growth?
Increasing Popularity of Ride-Sharing Services Pose Challenges for the Conventional Car Rental Market.
8. Can you provide examples of recent developments in the market?
February 2023: LG Energy Solution has been granted USD 237 million for the Honda battery plant project in Ohio, payable over the next 10 years, on top of approximately USD 156.3 million in tax incentives and infrastructure improvements.September 2022: LG Energy Solution has announced a partnership with three Canadian suppliers, Snow Lake Resources Ltd, Electra Battery Materials Corporation, and Avalon Advanced Materials Inc., to boost the supply chain for EV batteries in North America.August 2022: LG Energy Solutions and Honda Motor Co. announced a joint venture to produce electric vehicle batteries in the United States.
9. What pricing options are available for accessing the report?
Pricing options include single-user, multi-user, and enterprise licenses priced at USD 3800, USD 4500, and USD 5800 respectively.
10. Is the market size provided in terms of value or volume?
The market size is provided in terms of value, measured in Million.
11. Are there any specific market keywords associated with the report?
Yes, the market keyword associated with the report is "US Electric Commercial Vehicle Battery Pack Market," which aids in identifying and referencing the specific market segment covered.
12. How do I determine which pricing option suits my needs best?
The pricing options vary based on user requirements and access needs. Individual users may opt for single-user licenses, while businesses requiring broader access may choose multi-user or enterprise licenses for cost-effective access to the report.
13. Are there any additional resources or data provided in the US Electric Commercial Vehicle Battery Pack Market report?
While the report offers comprehensive insights, it's advisable to review the specific contents or supplementary materials provided to ascertain if additional resources or data are available.
14. How can I stay updated on further developments or reports in the US Electric Commercial Vehicle Battery Pack Market?
To stay informed about further developments, trends, and reports in the US Electric Commercial Vehicle Battery Pack Market, consider subscribing to industry newsletters, following relevant companies and organizations, or regularly checking reputable industry news sources and publications.
Methodology
Step 1 - Identification of Relevant Samples Size from Population Database


Step 2 - Approaches for Defining Global Market Size (Value, Volume* & Price*)

Note*: In applicable scenarios
Step 3 - Data Sources
Primary Research
- Web Analytics
- Survey Reports
- Research Institute
- Latest Research Reports
- Opinion Leaders
Secondary Research
- Annual Reports
- White Paper
- Latest Press Release
- Industry Association
- Paid Database
- Investor Presentations

Step 4 - Data Triangulation
Involves using different sources of information in order to increase the validity of a study
These sources are likely to be stakeholders in a program - participants, other researchers, program staff, other community members, and so on.
Then we put all data in single framework & apply various statistical tools to find out the dynamic on the market.
During the analysis stage, feedback from the stakeholder groups would be compared to determine areas of agreement as well as areas of divergence


