
Key Insights
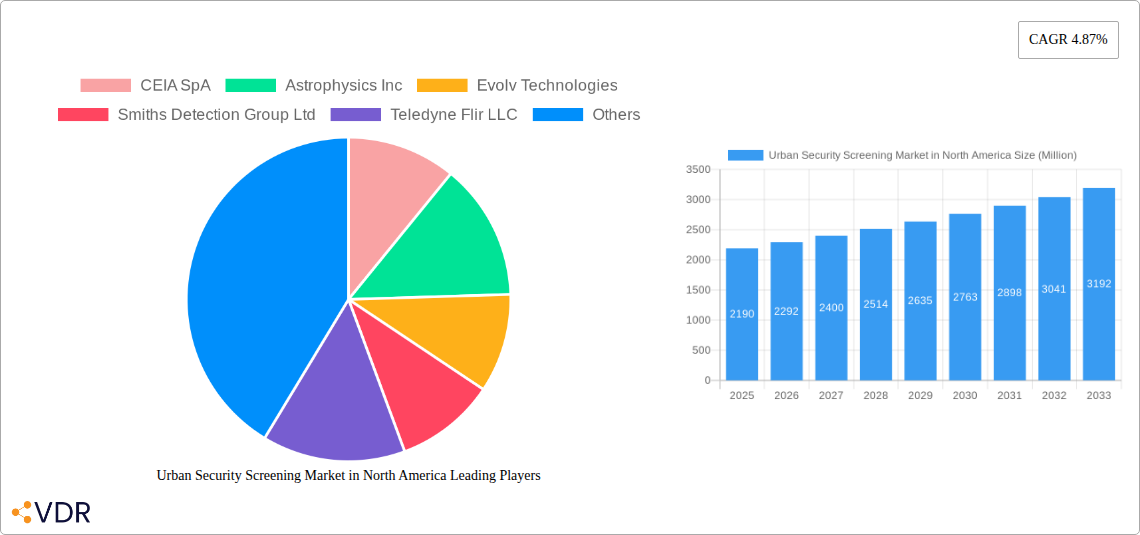
The North American urban security screening market, valued at $2.19 billion in 2025, is projected to experience robust growth, driven by increasing concerns about terrorism, crime, and mass shootings. This necessitates enhanced security measures across various sectors, including corporate buildings, transportation hubs, and government facilities. The market's expansion is fueled by technological advancements in screening technologies, such as millimeter-wave scanners offering improved accuracy and reduced passenger inconvenience compared to traditional methods. Furthermore, the rising adoption of AI and machine learning in security systems is improving threat detection capabilities and streamlining screening processes. Government initiatives promoting public safety and infrastructure modernization are also significantly contributing to market growth. While the market faces restraints like high initial investment costs associated with new technologies and potential privacy concerns, the overall outlook remains positive due to the undeniable need for robust and efficient security solutions in densely populated urban areas.
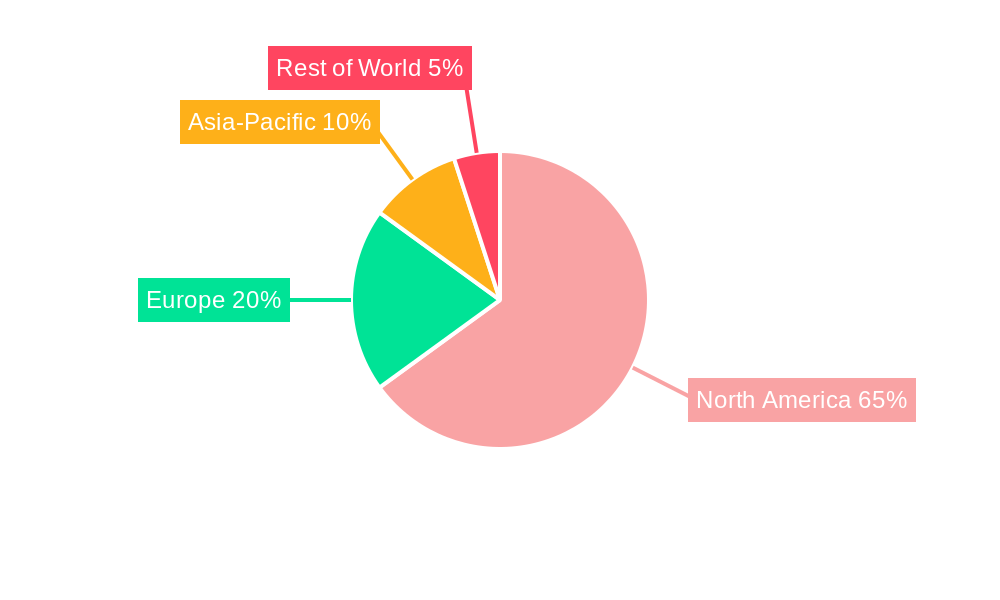
The segmental analysis reveals that X-ray products currently dominate the product type segment due to their widespread use and relatively lower cost. However, millimeter-wave products are expected to witness significant growth owing to their non-invasive nature and superior image resolution. The corporate buildings segment is a major end-user, reflecting the heightened security needs of large organizations. However, growth is expected across all end-user segments, particularly in transportation and government buildings, due to stringent security regulations and increasing terrorist threats. North America, particularly the United States and Canada, accounts for the largest market share, driven by robust security infrastructure investments and stringent regulations. The market's competitive landscape is fragmented, with several established players and emerging technology companies vying for market share. The continued evolution of technology and growing public awareness of security threats will likely propel the market's trajectory toward higher adoption and technological sophistication in the coming years.
Urban Security Screening Market in North America: A Comprehensive Market Report (2019-2033)
This in-depth report provides a comprehensive analysis of the North American urban security screening market, encompassing market dynamics, growth trends, dominant segments, and key players. The study covers the period from 2019 to 2033, with 2025 serving as the base and estimated year. The report is designed for industry professionals, investors, and strategic decision-makers seeking to understand and capitalize on the opportunities within this rapidly evolving sector. The total market size in 2025 is estimated at $XX Million.
Urban Security Screening Market in North America Market Dynamics & Structure
The North American urban security screening market is characterized by a moderately concentrated landscape with several major players and a significant number of smaller, specialized firms. Technological innovation, particularly in areas like AI-powered threat detection and advanced imaging, is a key driver. Regulatory frameworks, varying by jurisdiction, significantly impact market adoption and product specifications. Competitive product substitutes, such as improved physical security measures, also influence market growth. End-user demographics, with a focus on high-traffic areas like transportation hubs and government buildings, shape demand. M&A activity has been moderate, with consolidation driven by the desire for enhanced technological capabilities and broader market reach.
- Market Concentration: Moderately concentrated, with top 5 players holding approximately xx% market share in 2025.
- Technological Innovation: Focus on AI, advanced imaging (millimeter wave, X-ray), and improved threat detection algorithms.
- Regulatory Framework: Varied across states/provinces, influencing product standards and deployment.
- Competitive Substitutes: Physical security measures (e.g., barriers, increased personnel) offer alternative solutions.
- End-User Demographics: High concentration in transportation, government, and corporate sectors.
- M&A Activity: xx deals recorded between 2019-2024, primarily focusing on technological integration.
Urban Security Screening Market in North America Growth Trends & Insights
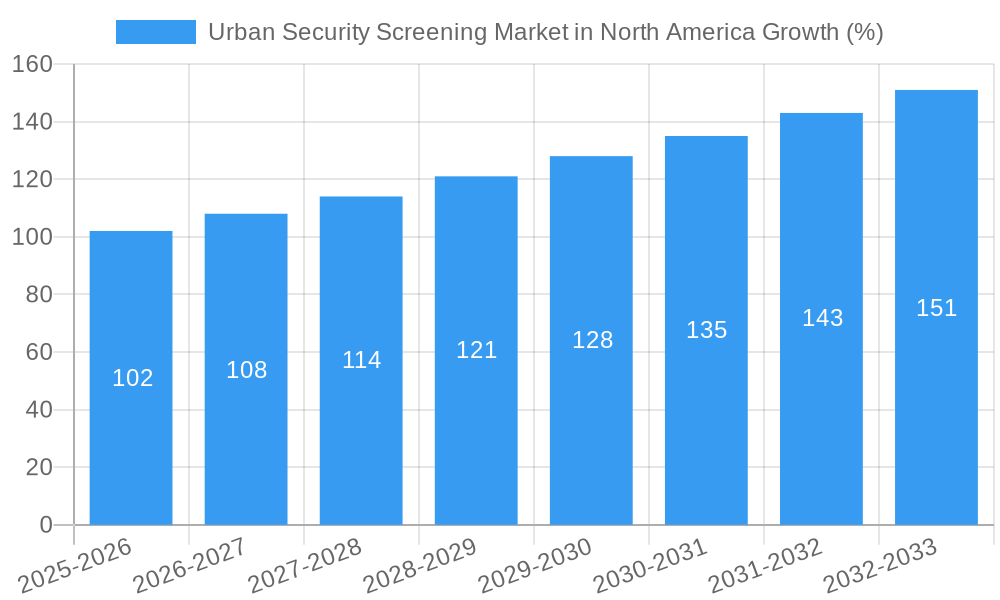
The North American urban security screening market experienced steady growth from 2019 to 2024, driven by increasing security concerns, technological advancements, and supportive government initiatives. The market is projected to maintain a healthy Compound Annual Growth Rate (CAGR) of xx% during the forecast period (2025-2033), reaching an estimated $XX Million by 2033. This growth is fueled by rising adoption rates in various end-user industries, particularly in response to evolving security threats and the need for efficient and effective screening solutions. Technological disruptions, such as the introduction of AI-powered systems and improved detection capabilities, are driving market transformation and increasing market penetration. Consumer behavior shifts, influenced by rising awareness of security risks and the demand for seamless and efficient screening processes, are also contributing factors.
Dominant Regions, Countries, or Segments in Urban Security Screening Market in North America
The United States dominates the North American urban security screening market, accounting for approximately xx% of the total market value in 2025, driven by a larger population, higher security expenditure, and extensive infrastructure. Within the product landscape, X-ray products hold the largest market share, followed by millimeter-wave products and metal detectors. Among end-user industries, transportation (airports, railway stations) and government buildings are the key drivers, followed by corporate buildings and data centers.
- United States: High security spending, larger population density, extensive infrastructure.
- Canada: Steady growth, driven by government initiatives and increasing security concerns.
- X-ray Products: Largest market share due to established technology and effectiveness.
- Transportation: Highest demand due to high passenger volume and security concerns.
- Government Buildings: Strong demand driven by government initiatives and stringent security protocols.
Urban Security Screening Market in North America Product Landscape
The market offers a diverse range of products, including X-ray systems, millimeter-wave scanners, metal detectors, and chemical/trace detection devices. These products are continually evolving, incorporating advanced technologies like AI-powered image analysis and improved threat detection algorithms. Unique selling propositions often center on speed, accuracy, ease of use, and reduced false-positive rates. Technological advancements focus on minimizing passenger inconvenience while enhancing threat detection capabilities.
Key Drivers, Barriers & Challenges in Urban Security Screening Market in North America
Key Drivers: Increased terrorism concerns, government regulations, advancements in screening technologies (AI, advanced imaging), rising adoption in private sectors (corporations, data centers).
Challenges: High initial investment costs, integration complexities, potential privacy concerns, regulatory hurdles, and intense competition among vendors. Supply chain disruptions can cause delays and increase costs, impacting market growth by approximately xx% in 2024.
Emerging Opportunities in Urban Security Screening Market in North America
Untapped potential exists in expanding into smaller municipalities and private sectors (e.g., schools, entertainment venues). Innovative applications like AI-driven predictive analytics and integrated screening solutions offer significant growth potential. The market is seeing increased demand for solutions that balance security with user experience, opening opportunities for user-friendly and efficient screening technologies.
Growth Accelerators in the Urban Security Screening Market in North America Industry
Technological breakthroughs, particularly in AI-powered threat detection and advanced imaging, are key growth accelerators. Strategic partnerships between technology providers and security integrators are also crucial. Expansion into new markets, such as smaller cities and private sector applications, and a growing focus on enhancing user experience will further drive market expansion.
Key Players Shaping the Urban Security Screening Market in North America Market
- CEIA SpA
- Astrophysics Inc
- Evolv Technologies
- Smiths Detection Group Ltd
- Teledyne Flir LLC
- Vehant Technologies
- Thermo Fisher Scientific Inc
- Leidos
- VOTI Detection Inc
- Rapiscan Systems Limited
- Rohde & Schwarz
- Linev Systems US Inc
- Tek84 Inc
- Nuctech Company Ltd
- Liberty Defense
- 3DX-Ray Ltd (Image Scan Holdings PLC)
- Bruker Corporation
Notable Milestones in Urban Security Screening Market in North America Sector
- 2021: Introduction of AI-powered threat detection systems by several key players.
- 2022: Significant increase in government funding for security upgrades in transportation hubs.
- 2023: Several mergers and acquisitions focused on technology integration and market expansion.
- 2024: Launch of several new millimeter-wave scanners with improved detection capabilities.
In-Depth Urban Security Screening Market in North America Market Outlook
The North American urban security screening market is poised for continued growth, driven by ongoing technological advancements, increased security concerns, and expanding adoption across various sectors. Strategic opportunities lie in developing innovative solutions that address emerging threats, improve user experience, and enhance integration capabilities. The market will likely witness further consolidation through M&A activity, leading to a more concentrated landscape with a few dominant players. Focus on user-friendly, efficient, and highly accurate technologies will be key to future success.
Urban Security Screening Market in North America Segmentation
-
1. Product Type
- 1.1. X-ray Products
- 1.2. Millimeter Wave Products
- 1.3. Metal Detectors
- 1.4. Radiation Detection Products
- 1.5. Chemicals and Trace Detection Products
-
2. End-user Industry
- 2.1. Corporate Buildings
- 2.2. Mailroom Screening
- 2.3. Warehouse and Logistics
- 2.4. Government Buildings
- 2.5. Transportation
- 2.6. Data Centers
- 2.7. Law Enforcement
Urban Security Screening Market in North America Segmentation By Geography
-
1. North America
- 1.1. United States
- 1.2. Canada
- 1.3. Mexico
-
2. South America
- 2.1. Brazil
- 2.2. Argentina
- 2.3. Rest of South America
-
3. Europe
- 3.1. United Kingdom
- 3.2. Germany
- 3.3. France
- 3.4. Italy
- 3.5. Spain
- 3.6. Russia
- 3.7. Benelux
- 3.8. Nordics
- 3.9. Rest of Europe
-
4. Middle East & Africa
- 4.1. Turkey
- 4.2. Israel
- 4.3. GCC
- 4.4. North Africa
- 4.5. South Africa
- 4.6. Rest of Middle East & Africa
-
5. Asia Pacific
- 5.1. China
- 5.2. India
- 5.3. Japan
- 5.4. South Korea
- 5.5. ASEAN
- 5.6. Oceania
- 5.7. Rest of Asia Pacific
Urban Security Screening Market in North America REPORT HIGHLIGHTS
| Aspects | Details |
|---|---|
| Study Period | 2019-2033 |
| Base Year | 2024 |
| Estimated Year | 2025 |
| Forecast Period | 2025-2033 |
| Historical Period | 2019-2024 |
| Growth Rate | CAGR of 4.87% from 2019-2033 |
| Segmentation |
|
Table of Contents
- 1. Introduction
- 1.1. Research Scope
- 1.2. Market Segmentation
- 1.3. Research Methodology
- 1.4. Definitions and Assumptions
- 2. Executive Summary
- 2.1. Introduction
- 3. Market Dynamics
- 3.1. Introduction
- 3.2. Market Drivers
- 3.2.1 Increasing Automation in the Security Screening Industry
- 3.2.2 Especially to Detect Advanced Threats
- 3.2.3 etc.; Upsurge in Terror Activities Across the Region; Increasing Government Initiatives on Security Inspection in Schools and Colleges; Increasing Government Initiatives for Smart Cities
- 3.3. Market Restrains
- 3.3.1 Supply Chain Issues Caused By Geopolitical Scenario and the COVID-19 Pandemic
- 3.3.2 etc.; High Installation and Maintenance Costs
- 3.4. Market Trends
- 3.4.1. Government Buildings to be the Fastest Growing End-user
- 4. Market Factor Analysis
- 4.1. Porters Five Forces
- 4.2. Supply/Value Chain
- 4.3. PESTEL analysis
- 4.4. Market Entropy
- 4.5. Patent/Trademark Analysis
- 5. Global Urban Security Screening Market in North America Analysis, Insights and Forecast, 2019-2031
- 5.1. Market Analysis, Insights and Forecast - by Product Type
- 5.1.1. X-ray Products
- 5.1.2. Millimeter Wave Products
- 5.1.3. Metal Detectors
- 5.1.4. Radiation Detection Products
- 5.1.5. Chemicals and Trace Detection Products
- 5.2. Market Analysis, Insights and Forecast - by End-user Industry
- 5.2.1. Corporate Buildings
- 5.2.2. Mailroom Screening
- 5.2.3. Warehouse and Logistics
- 5.2.4. Government Buildings
- 5.2.5. Transportation
- 5.2.6. Data Centers
- 5.2.7. Law Enforcement
- 5.3. Market Analysis, Insights and Forecast - by Region
- 5.3.1. North America
- 5.3.2. South America
- 5.3.3. Europe
- 5.3.4. Middle East & Africa
- 5.3.5. Asia Pacific
- 5.1. Market Analysis, Insights and Forecast - by Product Type
- 6. North America Urban Security Screening Market in North America Analysis, Insights and Forecast, 2019-2031
- 6.1. Market Analysis, Insights and Forecast - by Product Type
- 6.1.1. X-ray Products
- 6.1.2. Millimeter Wave Products
- 6.1.3. Metal Detectors
- 6.1.4. Radiation Detection Products
- 6.1.5. Chemicals and Trace Detection Products
- 6.2. Market Analysis, Insights and Forecast - by End-user Industry
- 6.2.1. Corporate Buildings
- 6.2.2. Mailroom Screening
- 6.2.3. Warehouse and Logistics
- 6.2.4. Government Buildings
- 6.2.5. Transportation
- 6.2.6. Data Centers
- 6.2.7. Law Enforcement
- 6.1. Market Analysis, Insights and Forecast - by Product Type
- 7. South America Urban Security Screening Market in North America Analysis, Insights and Forecast, 2019-2031
- 7.1. Market Analysis, Insights and Forecast - by Product Type
- 7.1.1. X-ray Products
- 7.1.2. Millimeter Wave Products
- 7.1.3. Metal Detectors
- 7.1.4. Radiation Detection Products
- 7.1.5. Chemicals and Trace Detection Products
- 7.2. Market Analysis, Insights and Forecast - by End-user Industry
- 7.2.1. Corporate Buildings
- 7.2.2. Mailroom Screening
- 7.2.3. Warehouse and Logistics
- 7.2.4. Government Buildings
- 7.2.5. Transportation
- 7.2.6. Data Centers
- 7.2.7. Law Enforcement
- 7.1. Market Analysis, Insights and Forecast - by Product Type
- 8. Europe Urban Security Screening Market in North America Analysis, Insights and Forecast, 2019-2031
- 8.1. Market Analysis, Insights and Forecast - by Product Type
- 8.1.1. X-ray Products
- 8.1.2. Millimeter Wave Products
- 8.1.3. Metal Detectors
- 8.1.4. Radiation Detection Products
- 8.1.5. Chemicals and Trace Detection Products
- 8.2. Market Analysis, Insights and Forecast - by End-user Industry
- 8.2.1. Corporate Buildings
- 8.2.2. Mailroom Screening
- 8.2.3. Warehouse and Logistics
- 8.2.4. Government Buildings
- 8.2.5. Transportation
- 8.2.6. Data Centers
- 8.2.7. Law Enforcement
- 8.1. Market Analysis, Insights and Forecast - by Product Type
- 9. Middle East & Africa Urban Security Screening Market in North America Analysis, Insights and Forecast, 2019-2031
- 9.1. Market Analysis, Insights and Forecast - by Product Type
- 9.1.1. X-ray Products
- 9.1.2. Millimeter Wave Products
- 9.1.3. Metal Detectors
- 9.1.4. Radiation Detection Products
- 9.1.5. Chemicals and Trace Detection Products
- 9.2. Market Analysis, Insights and Forecast - by End-user Industry
- 9.2.1. Corporate Buildings
- 9.2.2. Mailroom Screening
- 9.2.3. Warehouse and Logistics
- 9.2.4. Government Buildings
- 9.2.5. Transportation
- 9.2.6. Data Centers
- 9.2.7. Law Enforcement
- 9.1. Market Analysis, Insights and Forecast - by Product Type
- 10. Asia Pacific Urban Security Screening Market in North America Analysis, Insights and Forecast, 2019-2031
- 10.1. Market Analysis, Insights and Forecast - by Product Type
- 10.1.1. X-ray Products
- 10.1.2. Millimeter Wave Products
- 10.1.3. Metal Detectors
- 10.1.4. Radiation Detection Products
- 10.1.5. Chemicals and Trace Detection Products
- 10.2. Market Analysis, Insights and Forecast - by End-user Industry
- 10.2.1. Corporate Buildings
- 10.2.2. Mailroom Screening
- 10.2.3. Warehouse and Logistics
- 10.2.4. Government Buildings
- 10.2.5. Transportation
- 10.2.6. Data Centers
- 10.2.7. Law Enforcement
- 10.1. Market Analysis, Insights and Forecast - by Product Type
- 11. United States Urban Security Screening Market in North America Analysis, Insights and Forecast, 2019-2031
- 12. Canada Urban Security Screening Market in North America Analysis, Insights and Forecast, 2019-2031
- 13. Mexico Urban Security Screening Market in North America Analysis, Insights and Forecast, 2019-2031
- 14. Rest of North America Urban Security Screening Market in North America Analysis, Insights and Forecast, 2019-2031
- 15. Competitive Analysis
- 15.1. Global Market Share Analysis 2024
- 15.2. Company Profiles
- 15.2.1 CEIA SpA
- 15.2.1.1. Overview
- 15.2.1.2. Products
- 15.2.1.3. SWOT Analysis
- 15.2.1.4. Recent Developments
- 15.2.1.5. Financials (Based on Availability)
- 15.2.2 Astrophysics Inc
- 15.2.2.1. Overview
- 15.2.2.2. Products
- 15.2.2.3. SWOT Analysis
- 15.2.2.4. Recent Developments
- 15.2.2.5. Financials (Based on Availability)
- 15.2.3 Evolv Technologies
- 15.2.3.1. Overview
- 15.2.3.2. Products
- 15.2.3.3. SWOT Analysis
- 15.2.3.4. Recent Developments
- 15.2.3.5. Financials (Based on Availability)
- 15.2.4 Smiths Detection Group Ltd
- 15.2.4.1. Overview
- 15.2.4.2. Products
- 15.2.4.3. SWOT Analysis
- 15.2.4.4. Recent Developments
- 15.2.4.5. Financials (Based on Availability)
- 15.2.5 Teledyne Flir LLC
- 15.2.5.1. Overview
- 15.2.5.2. Products
- 15.2.5.3. SWOT Analysis
- 15.2.5.4. Recent Developments
- 15.2.5.5. Financials (Based on Availability)
- 15.2.6 Vehant Technologies
- 15.2.6.1. Overview
- 15.2.6.2. Products
- 15.2.6.3. SWOT Analysis
- 15.2.6.4. Recent Developments
- 15.2.6.5. Financials (Based on Availability)
- 15.2.7 Thermo Fisher Scientific Inc
- 15.2.7.1. Overview
- 15.2.7.2. Products
- 15.2.7.3. SWOT Analysis
- 15.2.7.4. Recent Developments
- 15.2.7.5. Financials (Based on Availability)
- 15.2.8 Leidos
- 15.2.8.1. Overview
- 15.2.8.2. Products
- 15.2.8.3. SWOT Analysis
- 15.2.8.4. Recent Developments
- 15.2.8.5. Financials (Based on Availability)
- 15.2.9 VOTI Detection Inc *List Not Exhaustive
- 15.2.9.1. Overview
- 15.2.9.2. Products
- 15.2.9.3. SWOT Analysis
- 15.2.9.4. Recent Developments
- 15.2.9.5. Financials (Based on Availability)
- 15.2.10 Rapiscan Systems Limited
- 15.2.10.1. Overview
- 15.2.10.2. Products
- 15.2.10.3. SWOT Analysis
- 15.2.10.4. Recent Developments
- 15.2.10.5. Financials (Based on Availability)
- 15.2.11 Rohde & Schwarz
- 15.2.11.1. Overview
- 15.2.11.2. Products
- 15.2.11.3. SWOT Analysis
- 15.2.11.4. Recent Developments
- 15.2.11.5. Financials (Based on Availability)
- 15.2.12 Linev Systems US Inc
- 15.2.12.1. Overview
- 15.2.12.2. Products
- 15.2.12.3. SWOT Analysis
- 15.2.12.4. Recent Developments
- 15.2.12.5. Financials (Based on Availability)
- 15.2.13 Tek84 Inc
- 15.2.13.1. Overview
- 15.2.13.2. Products
- 15.2.13.3. SWOT Analysis
- 15.2.13.4. Recent Developments
- 15.2.13.5. Financials (Based on Availability)
- 15.2.14 Nuctech Company Ltd
- 15.2.14.1. Overview
- 15.2.14.2. Products
- 15.2.14.3. SWOT Analysis
- 15.2.14.4. Recent Developments
- 15.2.14.5. Financials (Based on Availability)
- 15.2.15 Liberty Defense
- 15.2.15.1. Overview
- 15.2.15.2. Products
- 15.2.15.3. SWOT Analysis
- 15.2.15.4. Recent Developments
- 15.2.15.5. Financials (Based on Availability)
- 15.2.16 3DX-Ray Ltd (Image Scan Holdings PLC)
- 15.2.16.1. Overview
- 15.2.16.2. Products
- 15.2.16.3. SWOT Analysis
- 15.2.16.4. Recent Developments
- 15.2.16.5. Financials (Based on Availability)
- 15.2.17 Bruker Corporation
- 15.2.17.1. Overview
- 15.2.17.2. Products
- 15.2.17.3. SWOT Analysis
- 15.2.17.4. Recent Developments
- 15.2.17.5. Financials (Based on Availability)
- 15.2.1 CEIA SpA
List of Figures
- Figure 1: Global Urban Security Screening Market in North America Revenue Breakdown (Million, %) by Region 2024 & 2032
- Figure 2: North America Urban Security Screening Market in North America Revenue (Million), by Country 2024 & 2032
- Figure 3: North America Urban Security Screening Market in North America Revenue Share (%), by Country 2024 & 2032
- Figure 4: North America Urban Security Screening Market in North America Revenue (Million), by Product Type 2024 & 2032
- Figure 5: North America Urban Security Screening Market in North America Revenue Share (%), by Product Type 2024 & 2032
- Figure 6: North America Urban Security Screening Market in North America Revenue (Million), by End-user Industry 2024 & 2032
- Figure 7: North America Urban Security Screening Market in North America Revenue Share (%), by End-user Industry 2024 & 2032
- Figure 8: North America Urban Security Screening Market in North America Revenue (Million), by Country 2024 & 2032
- Figure 9: North America Urban Security Screening Market in North America Revenue Share (%), by Country 2024 & 2032
- Figure 10: South America Urban Security Screening Market in North America Revenue (Million), by Product Type 2024 & 2032
- Figure 11: South America Urban Security Screening Market in North America Revenue Share (%), by Product Type 2024 & 2032
- Figure 12: South America Urban Security Screening Market in North America Revenue (Million), by End-user Industry 2024 & 2032
- Figure 13: South America Urban Security Screening Market in North America Revenue Share (%), by End-user Industry 2024 & 2032
- Figure 14: South America Urban Security Screening Market in North America Revenue (Million), by Country 2024 & 2032
- Figure 15: South America Urban Security Screening Market in North America Revenue Share (%), by Country 2024 & 2032
- Figure 16: Europe Urban Security Screening Market in North America Revenue (Million), by Product Type 2024 & 2032
- Figure 17: Europe Urban Security Screening Market in North America Revenue Share (%), by Product Type 2024 & 2032
- Figure 18: Europe Urban Security Screening Market in North America Revenue (Million), by End-user Industry 2024 & 2032
- Figure 19: Europe Urban Security Screening Market in North America Revenue Share (%), by End-user Industry 2024 & 2032
- Figure 20: Europe Urban Security Screening Market in North America Revenue (Million), by Country 2024 & 2032
- Figure 21: Europe Urban Security Screening Market in North America Revenue Share (%), by Country 2024 & 2032
- Figure 22: Middle East & Africa Urban Security Screening Market in North America Revenue (Million), by Product Type 2024 & 2032
- Figure 23: Middle East & Africa Urban Security Screening Market in North America Revenue Share (%), by Product Type 2024 & 2032
- Figure 24: Middle East & Africa Urban Security Screening Market in North America Revenue (Million), by End-user Industry 2024 & 2032
- Figure 25: Middle East & Africa Urban Security Screening Market in North America Revenue Share (%), by End-user Industry 2024 & 2032
- Figure 26: Middle East & Africa Urban Security Screening Market in North America Revenue (Million), by Country 2024 & 2032
- Figure 27: Middle East & Africa Urban Security Screening Market in North America Revenue Share (%), by Country 2024 & 2032
- Figure 28: Asia Pacific Urban Security Screening Market in North America Revenue (Million), by Product Type 2024 & 2032
- Figure 29: Asia Pacific Urban Security Screening Market in North America Revenue Share (%), by Product Type 2024 & 2032
- Figure 30: Asia Pacific Urban Security Screening Market in North America Revenue (Million), by End-user Industry 2024 & 2032
- Figure 31: Asia Pacific Urban Security Screening Market in North America Revenue Share (%), by End-user Industry 2024 & 2032
- Figure 32: Asia Pacific Urban Security Screening Market in North America Revenue (Million), by Country 2024 & 2032
- Figure 33: Asia Pacific Urban Security Screening Market in North America Revenue Share (%), by Country 2024 & 2032
List of Tables
- Table 1: Global Urban Security Screening Market in North America Revenue Million Forecast, by Region 2019 & 2032
- Table 2: Global Urban Security Screening Market in North America Revenue Million Forecast, by Product Type 2019 & 2032
- Table 3: Global Urban Security Screening Market in North America Revenue Million Forecast, by End-user Industry 2019 & 2032
- Table 4: Global Urban Security Screening Market in North America Revenue Million Forecast, by Region 2019 & 2032
- Table 5: Global Urban Security Screening Market in North America Revenue Million Forecast, by Country 2019 & 2032
- Table 6: United States Urban Security Screening Market in North America Revenue (Million) Forecast, by Application 2019 & 2032
- Table 7: Canada Urban Security Screening Market in North America Revenue (Million) Forecast, by Application 2019 & 2032
- Table 8: Mexico Urban Security Screening Market in North America Revenue (Million) Forecast, by Application 2019 & 2032
- Table 9: Rest of North America Urban Security Screening Market in North America Revenue (Million) Forecast, by Application 2019 & 2032
- Table 10: Global Urban Security Screening Market in North America Revenue Million Forecast, by Product Type 2019 & 2032
- Table 11: Global Urban Security Screening Market in North America Revenue Million Forecast, by End-user Industry 2019 & 2032
- Table 12: Global Urban Security Screening Market in North America Revenue Million Forecast, by Country 2019 & 2032
- Table 13: United States Urban Security Screening Market in North America Revenue (Million) Forecast, by Application 2019 & 2032
- Table 14: Canada Urban Security Screening Market in North America Revenue (Million) Forecast, by Application 2019 & 2032
- Table 15: Mexico Urban Security Screening Market in North America Revenue (Million) Forecast, by Application 2019 & 2032
- Table 16: Global Urban Security Screening Market in North America Revenue Million Forecast, by Product Type 2019 & 2032
- Table 17: Global Urban Security Screening Market in North America Revenue Million Forecast, by End-user Industry 2019 & 2032
- Table 18: Global Urban Security Screening Market in North America Revenue Million Forecast, by Country 2019 & 2032
- Table 19: Brazil Urban Security Screening Market in North America Revenue (Million) Forecast, by Application 2019 & 2032
- Table 20: Argentina Urban Security Screening Market in North America Revenue (Million) Forecast, by Application 2019 & 2032
- Table 21: Rest of South America Urban Security Screening Market in North America Revenue (Million) Forecast, by Application 2019 & 2032
- Table 22: Global Urban Security Screening Market in North America Revenue Million Forecast, by Product Type 2019 & 2032
- Table 23: Global Urban Security Screening Market in North America Revenue Million Forecast, by End-user Industry 2019 & 2032
- Table 24: Global Urban Security Screening Market in North America Revenue Million Forecast, by Country 2019 & 2032
- Table 25: United Kingdom Urban Security Screening Market in North America Revenue (Million) Forecast, by Application 2019 & 2032
- Table 26: Germany Urban Security Screening Market in North America Revenue (Million) Forecast, by Application 2019 & 2032
- Table 27: France Urban Security Screening Market in North America Revenue (Million) Forecast, by Application 2019 & 2032
- Table 28: Italy Urban Security Screening Market in North America Revenue (Million) Forecast, by Application 2019 & 2032
- Table 29: Spain Urban Security Screening Market in North America Revenue (Million) Forecast, by Application 2019 & 2032
- Table 30: Russia Urban Security Screening Market in North America Revenue (Million) Forecast, by Application 2019 & 2032
- Table 31: Benelux Urban Security Screening Market in North America Revenue (Million) Forecast, by Application 2019 & 2032
- Table 32: Nordics Urban Security Screening Market in North America Revenue (Million) Forecast, by Application 2019 & 2032
- Table 33: Rest of Europe Urban Security Screening Market in North America Revenue (Million) Forecast, by Application 2019 & 2032
- Table 34: Global Urban Security Screening Market in North America Revenue Million Forecast, by Product Type 2019 & 2032
- Table 35: Global Urban Security Screening Market in North America Revenue Million Forecast, by End-user Industry 2019 & 2032
- Table 36: Global Urban Security Screening Market in North America Revenue Million Forecast, by Country 2019 & 2032
- Table 37: Turkey Urban Security Screening Market in North America Revenue (Million) Forecast, by Application 2019 & 2032
- Table 38: Israel Urban Security Screening Market in North America Revenue (Million) Forecast, by Application 2019 & 2032
- Table 39: GCC Urban Security Screening Market in North America Revenue (Million) Forecast, by Application 2019 & 2032
- Table 40: North Africa Urban Security Screening Market in North America Revenue (Million) Forecast, by Application 2019 & 2032
- Table 41: South Africa Urban Security Screening Market in North America Revenue (Million) Forecast, by Application 2019 & 2032
- Table 42: Rest of Middle East & Africa Urban Security Screening Market in North America Revenue (Million) Forecast, by Application 2019 & 2032
- Table 43: Global Urban Security Screening Market in North America Revenue Million Forecast, by Product Type 2019 & 2032
- Table 44: Global Urban Security Screening Market in North America Revenue Million Forecast, by End-user Industry 2019 & 2032
- Table 45: Global Urban Security Screening Market in North America Revenue Million Forecast, by Country 2019 & 2032
- Table 46: China Urban Security Screening Market in North America Revenue (Million) Forecast, by Application 2019 & 2032
- Table 47: India Urban Security Screening Market in North America Revenue (Million) Forecast, by Application 2019 & 2032
- Table 48: Japan Urban Security Screening Market in North America Revenue (Million) Forecast, by Application 2019 & 2032
- Table 49: South Korea Urban Security Screening Market in North America Revenue (Million) Forecast, by Application 2019 & 2032
- Table 50: ASEAN Urban Security Screening Market in North America Revenue (Million) Forecast, by Application 2019 & 2032
- Table 51: Oceania Urban Security Screening Market in North America Revenue (Million) Forecast, by Application 2019 & 2032
- Table 52: Rest of Asia Pacific Urban Security Screening Market in North America Revenue (Million) Forecast, by Application 2019 & 2032
Frequently Asked Questions
1. What is the projected Compound Annual Growth Rate (CAGR) of the Urban Security Screening Market in North America?
The projected CAGR is approximately 4.87%.
2. Which companies are prominent players in the Urban Security Screening Market in North America?
Key companies in the market include CEIA SpA, Astrophysics Inc, Evolv Technologies, Smiths Detection Group Ltd, Teledyne Flir LLC, Vehant Technologies, Thermo Fisher Scientific Inc, Leidos, VOTI Detection Inc *List Not Exhaustive, Rapiscan Systems Limited, Rohde & Schwarz, Linev Systems US Inc, Tek84 Inc, Nuctech Company Ltd, Liberty Defense, 3DX-Ray Ltd (Image Scan Holdings PLC), Bruker Corporation.
3. What are the main segments of the Urban Security Screening Market in North America?
The market segments include Product Type, End-user Industry.
4. Can you provide details about the market size?
The market size is estimated to be USD 2.19 Million as of 2022.
5. What are some drivers contributing to market growth?
Increasing Automation in the Security Screening Industry. Especially to Detect Advanced Threats. etc.; Upsurge in Terror Activities Across the Region; Increasing Government Initiatives on Security Inspection in Schools and Colleges; Increasing Government Initiatives for Smart Cities.
6. What are the notable trends driving market growth?
Government Buildings to be the Fastest Growing End-user.
7. Are there any restraints impacting market growth?
Supply Chain Issues Caused By Geopolitical Scenario and the COVID-19 Pandemic. etc.; High Installation and Maintenance Costs.
8. Can you provide examples of recent developments in the market?
N/A
9. What pricing options are available for accessing the report?
Pricing options include single-user, multi-user, and enterprise licenses priced at USD 4750, USD 4950, and USD 6800 respectively.
10. Is the market size provided in terms of value or volume?
The market size is provided in terms of value, measured in Million.
11. Are there any specific market keywords associated with the report?
Yes, the market keyword associated with the report is "Urban Security Screening Market in North America," which aids in identifying and referencing the specific market segment covered.
12. How do I determine which pricing option suits my needs best?
The pricing options vary based on user requirements and access needs. Individual users may opt for single-user licenses, while businesses requiring broader access may choose multi-user or enterprise licenses for cost-effective access to the report.
13. Are there any additional resources or data provided in the Urban Security Screening Market in North America report?
While the report offers comprehensive insights, it's advisable to review the specific contents or supplementary materials provided to ascertain if additional resources or data are available.
14. How can I stay updated on further developments or reports in the Urban Security Screening Market in North America?
To stay informed about further developments, trends, and reports in the Urban Security Screening Market in North America, consider subscribing to industry newsletters, following relevant companies and organizations, or regularly checking reputable industry news sources and publications.
Methodology
Step 1 - Identification of Relevant Samples Size from Population Database


Step 2 - Approaches for Defining Global Market Size (Value, Volume* & Price*)

Note*: In applicable scenarios
Step 3 - Data Sources
Primary Research
- Web Analytics
- Survey Reports
- Research Institute
- Latest Research Reports
- Opinion Leaders
Secondary Research
- Annual Reports
- White Paper
- Latest Press Release
- Industry Association
- Paid Database
- Investor Presentations

Step 4 - Data Triangulation
Involves using different sources of information in order to increase the validity of a study
These sources are likely to be stakeholders in a program - participants, other researchers, program staff, other community members, and so on.
Then we put all data in single framework & apply various statistical tools to find out the dynamic on the market.
During the analysis stage, feedback from the stakeholder groups would be compared to determine areas of agreement as well as areas of divergence


