
Key Insights
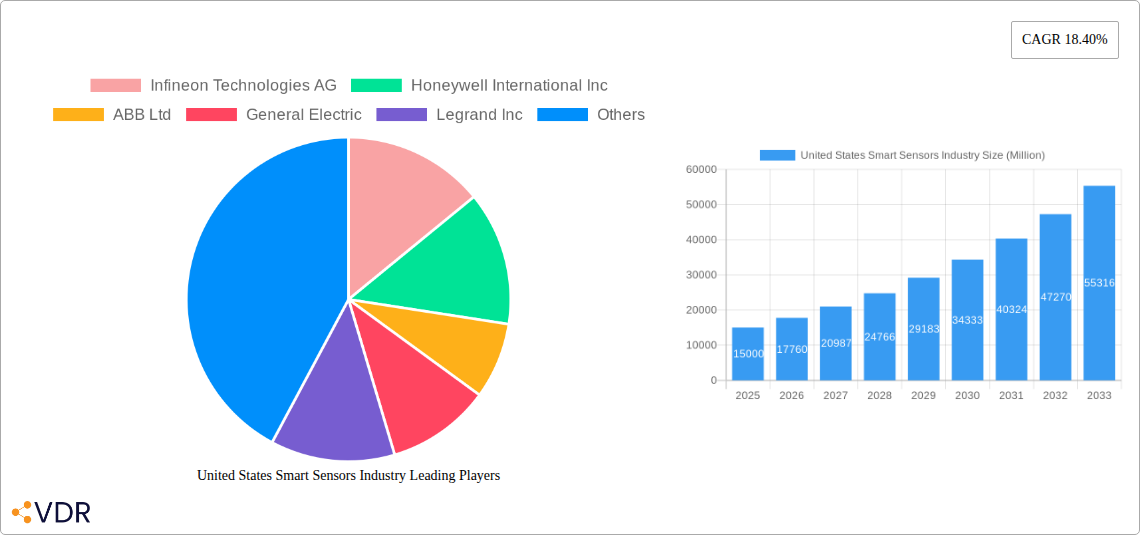
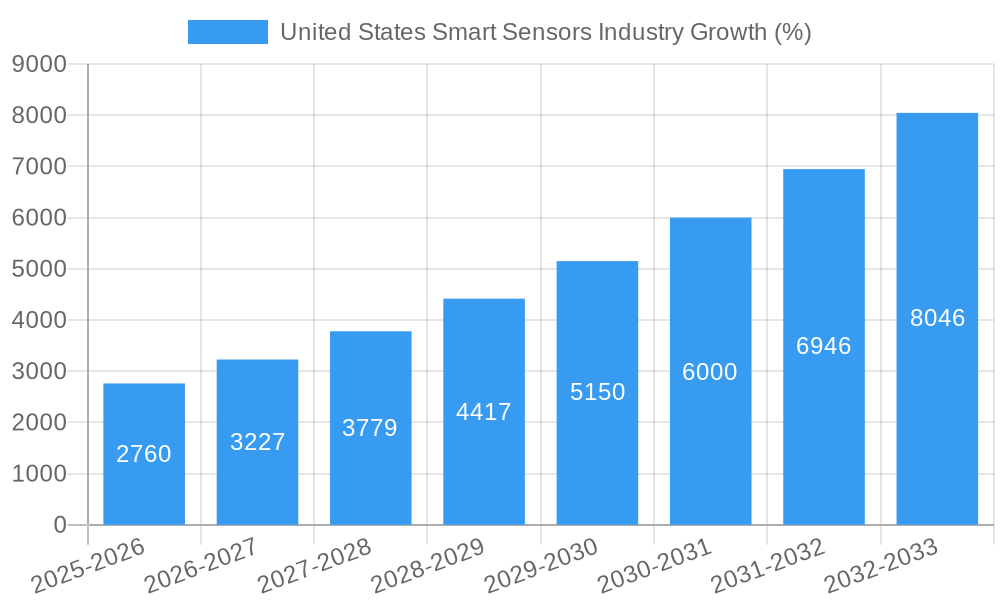
The United States smart sensors market is experiencing robust growth, driven by the increasing adoption of automation across various sectors and the proliferation of IoT devices. The market, valued at approximately $15 billion in 2025, is projected to expand at a Compound Annual Growth Rate (CAGR) of 18.40% from 2025 to 2033. This significant growth is fueled by several key factors. The automotive and transportation industries are leading adopters, integrating smart sensors for advanced driver-assistance systems (ADAS), autonomous driving, and improved vehicle diagnostics. Furthermore, the healthcare sector is witnessing a surge in demand for smart sensors in medical devices and wearables, enabling remote patient monitoring and personalized medicine. Industrial automation is another significant driver, with smart sensors enhancing efficiency, safety, and predictive maintenance in manufacturing processes. Technological advancements, such as the miniaturization of MEMS sensors and improvements in optical spectroscopy, are also contributing to market expansion. While challenges such as high initial investment costs and data security concerns exist, the overall market outlook remains positive, with a projected market value exceeding $60 billion by 2033.
Specific segment analysis reveals strong growth across multiple categories. The automotive and transportation application segment is expected to dominate, followed closely by healthcare and industrial automation. Within components, analog-to-digital converters and digital-to-analog converters are witnessing high demand due to their crucial role in data acquisition and processing. Among sensor types, pressure sensors are particularly prevalent across applications, while the demand for flow and image sensors is also rising rapidly. Key players in the US smart sensor market, including Infineon Technologies AG, Honeywell International Inc., and Analog Devices Inc., are strategically investing in research and development, fostering innovation and competition. This competitive landscape drives further market growth and encourages continuous technological advancements. The United States' strong technological infrastructure and significant investments in research and development further solidify its position as a dominant player in the global smart sensor market.
United States Smart Sensors Industry Market Report: 2019-2033
This comprehensive report provides an in-depth analysis of the United States smart sensors industry, covering market dynamics, growth trends, key players, and future outlook. The study period spans from 2019 to 2033, with 2025 serving as the base and estimated year. The report segments the market by technology (MEMS, CMOS, Optical Spectroscopy, Other Technologies), component (Analog-to-Digital Converters, Digital-to-Analog Converters, Amplifiers, Other Components), application (Aerospace & Defense, Automotive & Transportation, Healthcare, Industrial Automation, Building Automation, Consumer Electronics, Other Applications), and sensor type (Flow Sensors, Image Sensors, Position Sensors, Pressure Sensors, Temperature Sensors, Other Types). The total market value is projected to reach xx Million units by 2033.
United States Smart Sensors Industry Market Dynamics & Structure
The US smart sensors market is characterized by moderate concentration, with key players like Infineon Technologies AG, Honeywell International Inc, and ABB Ltd holding significant market share. Technological innovation, driven by advancements in MEMS and CMOS technologies, is a major growth driver. Stringent regulatory frameworks, particularly in sectors like automotive and healthcare, influence product development and adoption. Competitive substitutes, such as traditional sensing methods, pose a challenge, but the advantages of smart sensors in terms of accuracy, efficiency, and data analytics are fueling market expansion. The market exhibits strong end-user demand across diverse sectors, and M&A activity is contributing to market consolidation and technological integration.
- Market Concentration: Moderately concentrated, with top 5 players holding approximately xx% market share in 2024.
- Technological Innovation: Rapid advancements in MEMS, CMOS, and Optical Spectroscopy driving miniaturization, improved accuracy, and enhanced functionalities.
- Regulatory Landscape: Stringent regulations in sectors like automotive and healthcare impacting product development and certification.
- Competitive Landscape: Traditional sensing technologies pose competition, but smart sensors offer superior performance and data capabilities.
- M&A Activity: A moderate number of mergers and acquisitions (xx deals in the past 5 years) are consolidating the market and driving innovation.
- End-User Demographics: Growth driven by increasing adoption across various sectors, including automotive, industrial automation, and healthcare.
United States Smart Sensors Industry Growth Trends & Insights
The US smart sensors market experienced robust growth during the historical period (2019-2024), with a CAGR of xx%. This growth is attributed to increasing demand from various end-use sectors, particularly automotive and industrial automation. Technological disruptions, such as the rise of IoT and AI, are accelerating the adoption of smart sensors. Consumer behavior shifts towards smart and connected devices further fuel market expansion. The market is projected to maintain a healthy growth trajectory during the forecast period (2025-2033), with a projected CAGR of xx%, driven by continued technological advancements, increasing automation needs, and growing investments in infrastructure development. Market penetration is expected to reach xx% by 2033, up from xx% in 2024. The automotive and industrial automation segments are expected to be the key drivers of growth.
Dominant Regions, Countries, or Segments in United States Smart Sensors Industry
The automotive and industrial automation application segments are currently the dominant drivers of growth in the US smart sensor market. California and Texas lead in terms of regional market share, benefiting from strong manufacturing hubs and a robust technology ecosystem. The MEMS technology segment holds the largest market share due to its cost-effectiveness and suitability for various applications.
- Dominant Application Segments: Automotive & Transportation, Industrial Automation
- Leading Regions: California and Texas
- Dominant Technology: MEMS
- Key Growth Drivers: Increased automation in manufacturing, rising demand for connected vehicles, and government initiatives promoting smart infrastructure development.
- Market Share: The automotive segment holds approximately xx% market share, while industrial automation accounts for approximately xx%.
United States Smart Sensors Industry Product Landscape
The US smart sensor market is characterized by continuous product innovation, focusing on improved accuracy, miniaturization, and enhanced functionalities. New products incorporate advanced technologies like AI and machine learning, enabling real-time data analysis and predictive maintenance capabilities. The unique selling propositions include improved energy efficiency, increased sensitivity, and extended operating lifespan. Technological advancements are driven by the integration of advanced materials, improved manufacturing processes, and sophisticated algorithms.
Key Drivers, Barriers & Challenges in United States Smart Sensors Industry
Key Drivers:
- Growing demand for automation and IoT across various sectors.
- Advancements in sensor technology, particularly in MEMS and CMOS.
- Government initiatives promoting smart infrastructure development.
Key Challenges & Restraints:
- High initial investment costs for smart sensor implementation.
- Concerns regarding data security and privacy.
- Supply chain disruptions impacting sensor availability and costs. The impact of these disruptions is estimated at xx% reduction in production in 2022.
Emerging Opportunities in United States Smart Sensors Industry
- Untapped Markets: Expansion into niche applications, such as smart agriculture and environmental monitoring.
- Innovative Applications: Development of new sensor types for emerging technologies like 5G and augmented reality.
- Evolving Consumer Preferences: Growing demand for smart home and wearables incorporating advanced sensor technology.
Growth Accelerators in the United States Smart Sensors Industry
Technological breakthroughs, particularly in AI and machine learning, are driving the development of highly sophisticated and intelligent smart sensors. Strategic partnerships between sensor manufacturers and technology companies are accelerating innovation and market penetration. Expansion into new application areas, such as smart healthcare and environmental monitoring, is creating significant growth opportunities.
Key Players Shaping the United States Smart Sensors Industry Market
- Infineon Technologies AG
- Honeywell International Inc
- ABB Ltd
- General Electric
- Legrand Inc
- NXP Semiconductors NV
- Siemens AG
- TE Connectivity Ltd
- STMicroelectronics
- Analog Devices Inc
- Vishay Technology Inc
- Eaton Corporation
Notable Milestones in United States Smart Sensors Industry Sector
- December 2021: Eaton contracts with the US Department of Defense to manufacture inductive proximity sensors for the Navy, leveraging patented technology from BH Sensors. This highlights the increasing demand for robust and reliable smart sensors in critical applications.
- March 2021: Siemens and Senseware partnership expands the reach of Senseware's indoor air quality solutions, accelerating the adoption of smart sensors in commercial and industrial buildings. This emphasizes the growing role of smart sensors in addressing real-world challenges.
In-Depth United States Smart Sensors Industry Market Outlook
The US smart sensor market is poised for significant growth, driven by technological advancements, increasing automation across various sectors, and growing adoption of IoT devices. Strategic partnerships, expansion into new application areas, and continuous product innovation are key factors that will shape the market's future trajectory. The market presents lucrative opportunities for companies focused on developing innovative and highly specialized sensors. The long-term outlook remains optimistic, with considerable potential for market expansion and continued innovation.
United States Smart Sensors Industry Segmentation
-
1. Type
- 1.1. Flow Sensors
- 1.2. Image Sensors
- 1.3. Position Sensors
- 1.4. Pressure Sensors
- 1.5. Temperature Sensors
- 1.6. Other Types
-
2. Technology
- 2.1. MEMS
- 2.2. CMOS
- 2.3. Optical Spectroscopy
- 2.4. Other Technologies
-
3. Component
- 3.1. Analog-to-Digital Converters
- 3.2. Digital-to-Analog Converters
- 3.3. Amplifiers
- 3.4. Other Components
-
4. Application
- 4.1. Aerospace and Defense
- 4.2. Automotive and Transportation
- 4.3. Healthcare
- 4.4. Industrial Automation
- 4.5. Building Automation
- 4.6. Consumer Electronics
- 4.7. Other Applications
United States Smart Sensors Industry Segmentation By Geography
- 1. United States
United States Smart Sensors Industry REPORT HIGHLIGHTS
| Aspects | Details |
|---|---|
| Study Period | 2019-2033 |
| Base Year | 2024 |
| Estimated Year | 2025 |
| Forecast Period | 2025-2033 |
| Historical Period | 2019-2024 |
| Growth Rate | CAGR of 18.40% from 2019-2033 |
| Segmentation |
|
Table of Contents
- 1. Introduction
- 1.1. Research Scope
- 1.2. Market Segmentation
- 1.3. Research Methodology
- 1.4. Definitions and Assumptions
- 2. Executive Summary
- 2.1. Introduction
- 3. Market Dynamics
- 3.1. Introduction
- 3.2. Market Drivers
- 3.2.1. Growing Demand for Energy Efficiency and Saving; Technology Advancements in Miniaturization and Wireless Capabilities
- 3.3. Market Restrains
- 3.3.1. Complex Design Compared to Traditional Sensors; Relatively High Deployment Costs
- 3.4. Market Trends
- 3.4.1. Temperature Sensors are Expected to Drive the Market's Growth
- 4. Market Factor Analysis
- 4.1. Porters Five Forces
- 4.2. Supply/Value Chain
- 4.3. PESTEL analysis
- 4.4. Market Entropy
- 4.5. Patent/Trademark Analysis
- 5. United States Smart Sensors Industry Analysis, Insights and Forecast, 2019-2031
- 5.1. Market Analysis, Insights and Forecast - by Type
- 5.1.1. Flow Sensors
- 5.1.2. Image Sensors
- 5.1.3. Position Sensors
- 5.1.4. Pressure Sensors
- 5.1.5. Temperature Sensors
- 5.1.6. Other Types
- 5.2. Market Analysis, Insights and Forecast - by Technology
- 5.2.1. MEMS
- 5.2.2. CMOS
- 5.2.3. Optical Spectroscopy
- 5.2.4. Other Technologies
- 5.3. Market Analysis, Insights and Forecast - by Component
- 5.3.1. Analog-to-Digital Converters
- 5.3.2. Digital-to-Analog Converters
- 5.3.3. Amplifiers
- 5.3.4. Other Components
- 5.4. Market Analysis, Insights and Forecast - by Application
- 5.4.1. Aerospace and Defense
- 5.4.2. Automotive and Transportation
- 5.4.3. Healthcare
- 5.4.4. Industrial Automation
- 5.4.5. Building Automation
- 5.4.6. Consumer Electronics
- 5.4.7. Other Applications
- 5.5. Market Analysis, Insights and Forecast - by Region
- 5.5.1. United States
- 5.1. Market Analysis, Insights and Forecast - by Type
- 6. Competitive Analysis
- 6.1. Market Share Analysis 2024
- 6.2. Company Profiles
- 6.2.1 Infineon Technologies AG
- 6.2.1.1. Overview
- 6.2.1.2. Products
- 6.2.1.3. SWOT Analysis
- 6.2.1.4. Recent Developments
- 6.2.1.5. Financials (Based on Availability)
- 6.2.2 Honeywell International Inc
- 6.2.2.1. Overview
- 6.2.2.2. Products
- 6.2.2.3. SWOT Analysis
- 6.2.2.4. Recent Developments
- 6.2.2.5. Financials (Based on Availability)
- 6.2.3 ABB Ltd
- 6.2.3.1. Overview
- 6.2.3.2. Products
- 6.2.3.3. SWOT Analysis
- 6.2.3.4. Recent Developments
- 6.2.3.5. Financials (Based on Availability)
- 6.2.4 General Electric
- 6.2.4.1. Overview
- 6.2.4.2. Products
- 6.2.4.3. SWOT Analysis
- 6.2.4.4. Recent Developments
- 6.2.4.5. Financials (Based on Availability)
- 6.2.5 Legrand Inc
- 6.2.5.1. Overview
- 6.2.5.2. Products
- 6.2.5.3. SWOT Analysis
- 6.2.5.4. Recent Developments
- 6.2.5.5. Financials (Based on Availability)
- 6.2.6 NXP Semiconductors NV
- 6.2.6.1. Overview
- 6.2.6.2. Products
- 6.2.6.3. SWOT Analysis
- 6.2.6.4. Recent Developments
- 6.2.6.5. Financials (Based on Availability)
- 6.2.7 Siemens AG
- 6.2.7.1. Overview
- 6.2.7.2. Products
- 6.2.7.3. SWOT Analysis
- 6.2.7.4. Recent Developments
- 6.2.7.5. Financials (Based on Availability)
- 6.2.8 TE Connectivity Ltd
- 6.2.8.1. Overview
- 6.2.8.2. Products
- 6.2.8.3. SWOT Analysis
- 6.2.8.4. Recent Developments
- 6.2.8.5. Financials (Based on Availability)
- 6.2.9 ST Microelectronics
- 6.2.9.1. Overview
- 6.2.9.2. Products
- 6.2.9.3. SWOT Analysis
- 6.2.9.4. Recent Developments
- 6.2.9.5. Financials (Based on Availability)
- 6.2.10 Analog Devices Inc
- 6.2.10.1. Overview
- 6.2.10.2. Products
- 6.2.10.3. SWOT Analysis
- 6.2.10.4. Recent Developments
- 6.2.10.5. Financials (Based on Availability)
- 6.2.11 Vishay Technology Inc
- 6.2.11.1. Overview
- 6.2.11.2. Products
- 6.2.11.3. SWOT Analysis
- 6.2.11.4. Recent Developments
- 6.2.11.5. Financials (Based on Availability)
- 6.2.12 Eaton Corporation
- 6.2.12.1. Overview
- 6.2.12.2. Products
- 6.2.12.3. SWOT Analysis
- 6.2.12.4. Recent Developments
- 6.2.12.5. Financials (Based on Availability)
- 6.2.1 Infineon Technologies AG
List of Figures
- Figure 1: United States Smart Sensors Industry Revenue Breakdown (Million, %) by Product 2024 & 2032
- Figure 2: United States Smart Sensors Industry Share (%) by Company 2024
List of Tables
- Table 1: United States Smart Sensors Industry Revenue Million Forecast, by Region 2019 & 2032
- Table 2: United States Smart Sensors Industry Revenue Million Forecast, by Type 2019 & 2032
- Table 3: United States Smart Sensors Industry Revenue Million Forecast, by Technology 2019 & 2032
- Table 4: United States Smart Sensors Industry Revenue Million Forecast, by Component 2019 & 2032
- Table 5: United States Smart Sensors Industry Revenue Million Forecast, by Application 2019 & 2032
- Table 6: United States Smart Sensors Industry Revenue Million Forecast, by Region 2019 & 2032
- Table 7: United States Smart Sensors Industry Revenue Million Forecast, by Country 2019 & 2032
- Table 8: United States Smart Sensors Industry Revenue Million Forecast, by Type 2019 & 2032
- Table 9: United States Smart Sensors Industry Revenue Million Forecast, by Technology 2019 & 2032
- Table 10: United States Smart Sensors Industry Revenue Million Forecast, by Component 2019 & 2032
- Table 11: United States Smart Sensors Industry Revenue Million Forecast, by Application 2019 & 2032
- Table 12: United States Smart Sensors Industry Revenue Million Forecast, by Country 2019 & 2032
Frequently Asked Questions
1. What is the projected Compound Annual Growth Rate (CAGR) of the United States Smart Sensors Industry?
The projected CAGR is approximately 18.40%.
2. Which companies are prominent players in the United States Smart Sensors Industry?
Key companies in the market include Infineon Technologies AG, Honeywell International Inc, ABB Ltd, General Electric, Legrand Inc, NXP Semiconductors NV, Siemens AG, TE Connectivity Ltd, ST Microelectronics, Analog Devices Inc, Vishay Technology Inc, Eaton Corporation.
3. What are the main segments of the United States Smart Sensors Industry?
The market segments include Type, Technology, Component, Application.
4. Can you provide details about the market size?
The market size is estimated to be USD XX Million as of 2022.
5. What are some drivers contributing to market growth?
Growing Demand for Energy Efficiency and Saving; Technology Advancements in Miniaturization and Wireless Capabilities.
6. What are the notable trends driving market growth?
Temperature Sensors are Expected to Drive the Market's Growth.
7. Are there any restraints impacting market growth?
Complex Design Compared to Traditional Sensors; Relatively High Deployment Costs.
8. Can you provide examples of recent developments in the market?
December 2021 - Power management company Eaton contracted with the US Department of Defense to manufacture inductive proximity sensors for the Navy to use in aircraft shipboard applications and for evaluation in additional platforms. The sensors incorporate patented technology developed by BH Sensors of Pomona, New York, through the DoD Small Business Innovation Research program.
9. What pricing options are available for accessing the report?
Pricing options include single-user, multi-user, and enterprise licenses priced at USD 3800, USD 4500, and USD 5800 respectively.
10. Is the market size provided in terms of value or volume?
The market size is provided in terms of value, measured in Million.
11. Are there any specific market keywords associated with the report?
Yes, the market keyword associated with the report is "United States Smart Sensors Industry," which aids in identifying and referencing the specific market segment covered.
12. How do I determine which pricing option suits my needs best?
The pricing options vary based on user requirements and access needs. Individual users may opt for single-user licenses, while businesses requiring broader access may choose multi-user or enterprise licenses for cost-effective access to the report.
13. Are there any additional resources or data provided in the United States Smart Sensors Industry report?
While the report offers comprehensive insights, it's advisable to review the specific contents or supplementary materials provided to ascertain if additional resources or data are available.
14. How can I stay updated on further developments or reports in the United States Smart Sensors Industry?
To stay informed about further developments, trends, and reports in the United States Smart Sensors Industry, consider subscribing to industry newsletters, following relevant companies and organizations, or regularly checking reputable industry news sources and publications.
Methodology
Step 1 - Identification of Relevant Samples Size from Population Database


Step 2 - Approaches for Defining Global Market Size (Value, Volume* & Price*)

Note*: In applicable scenarios
Step 3 - Data Sources
Primary Research
- Web Analytics
- Survey Reports
- Research Institute
- Latest Research Reports
- Opinion Leaders
Secondary Research
- Annual Reports
- White Paper
- Latest Press Release
- Industry Association
- Paid Database
- Investor Presentations

Step 4 - Data Triangulation
Involves using different sources of information in order to increase the validity of a study
These sources are likely to be stakeholders in a program - participants, other researchers, program staff, other community members, and so on.
Then we put all data in single framework & apply various statistical tools to find out the dynamic on the market.
During the analysis stage, feedback from the stakeholder groups would be compared to determine areas of agreement as well as areas of divergence


