
Key Insights
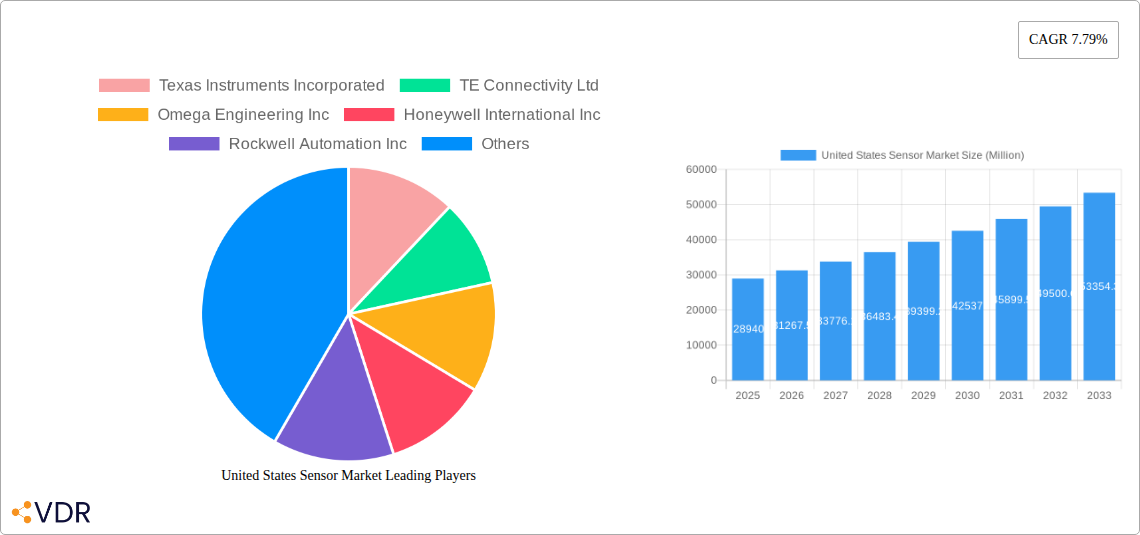
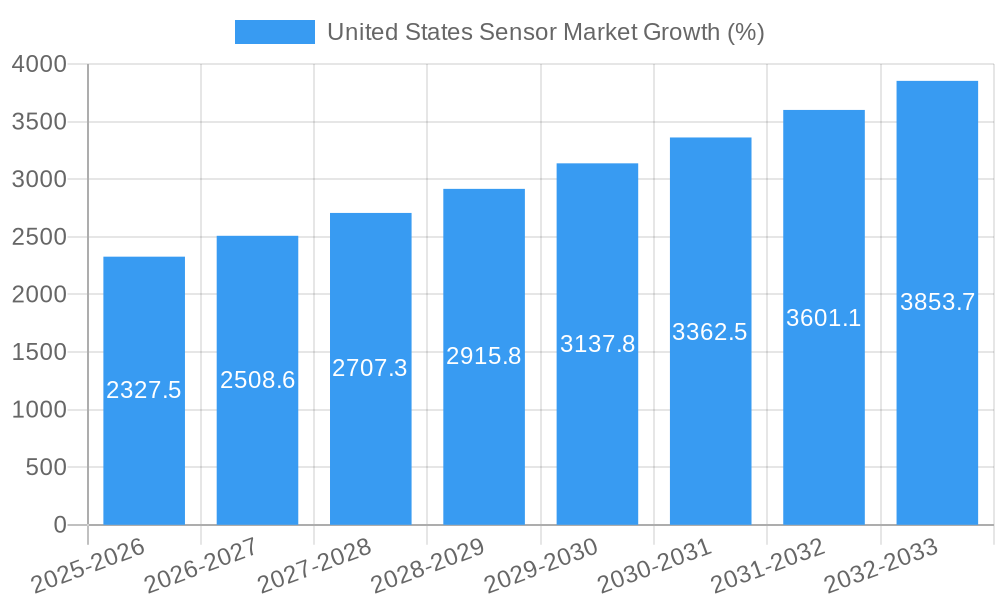
The United States sensor market, valued at $28.94 billion in 2025, is poised for robust growth, exhibiting a Compound Annual Growth Rate (CAGR) of 7.79% from 2025 to 2033. This expansion is driven by several key factors. The increasing adoption of automation and Industry 4.0 across various sectors, including manufacturing, automotive, and healthcare, fuels significant demand for advanced sensing technologies. Furthermore, the proliferation of IoT (Internet of Things) devices and the growing need for real-time data monitoring and analysis in smart cities and infrastructure projects are creating lucrative opportunities. Technological advancements, such as the development of miniaturized, low-power, and high-accuracy sensors, are further enhancing market potential. While data privacy concerns and the cost of implementing and maintaining sensor networks could present challenges, the overall market outlook remains optimistic, particularly given the substantial government investment in infrastructure modernization and digital transformation initiatives within the United States.
The market's segmentation is likely diverse, encompassing various sensor types (e.g., temperature, pressure, proximity, image, gas) and applications. Major players such as Texas Instruments, TE Connectivity, Honeywell, and others are driving innovation and competition. Regional variations in market growth may exist, with regions like California and Texas likely leading due to their strong technological hubs and manufacturing activities. The historical period (2019-2024) provides a solid foundation for projecting future growth, suggesting that the market has consistently demonstrated expansion over the past few years. Continued investment in R&D and strategic partnerships are expected to solidify market dominance for leading companies and attract new players in the coming years. The forecast period (2025-2033) promises continued expansion, fueled by technological innovation and increasing demand across multiple applications.
United States Sensor Market: A Comprehensive Report (2019-2033)
This in-depth report provides a comprehensive analysis of the United States sensor market, encompassing market dynamics, growth trends, regional analysis, product landscape, key players, and future outlook. The study covers the period from 2019 to 2033, with 2025 as the base year and a forecast period of 2025-2033. The report is essential for industry professionals, investors, and strategic decision-makers seeking a clear understanding of this dynamic market. Key segments analyzed include [insert specific sensor segments here, e.g., pressure sensors, temperature sensors, image sensors, etc.], providing a granular view of the parent market and its various child markets. The market size is projected to reach xx Million units by 2033.
United States Sensor Market Dynamics & Structure
The United States sensor market is characterized by a moderately concentrated landscape with several key players holding significant market share. Technological innovation is a primary driver, with advancements in miniaturization, improved accuracy, and enhanced connectivity constantly shaping the market. Stringent regulatory frameworks, particularly concerning data privacy and safety standards, significantly influence product development and deployment. The market also experiences competition from substitute technologies, including alternative measurement methods and data acquisition techniques. End-user demographics span a wide range of industries, including automotive, healthcare, industrial automation, and consumer electronics. The market has witnessed a moderate number of M&A activities in recent years (xx deals in the last 5 years, representing xx% of market share consolidation).
- Market Concentration: Moderately concentrated, with top 5 players holding approximately xx% market share.
- Technological Innovation: Significant investments in miniaturization, IoT integration, and AI-powered analytics.
- Regulatory Landscape: Compliance with safety and data privacy regulations (e.g., GDPR, CCPA) influences market dynamics.
- Substitute Technologies: Competition from alternative measurement and data acquisition techniques.
- End-User Demographics: Diverse range of industries, including automotive, healthcare, industrial automation, and consumer electronics.
- M&A Activity: xx deals in the past five years, leading to xx% market share consolidation.
United States Sensor Market Growth Trends & Insights
The United States sensor market has experienced robust growth over the historical period (2019-2024), with a CAGR of xx%. This growth is primarily attributed to increasing adoption across diverse sectors, driven by factors such as automation, technological advancements, and the rising demand for data-driven decision-making. Technological disruptions, particularly the proliferation of IoT devices and the integration of AI, have significantly accelerated market expansion. Consumer behavior shifts toward smart devices and connected technologies have further propelled demand. The market is expected to maintain a healthy growth trajectory during the forecast period (2025-2033), with a projected CAGR of xx%, driven by the continued adoption of advanced sensor technologies in emerging applications such as autonomous vehicles and smart infrastructure. Market penetration is expected to increase from xx% in 2025 to xx% by 2033.
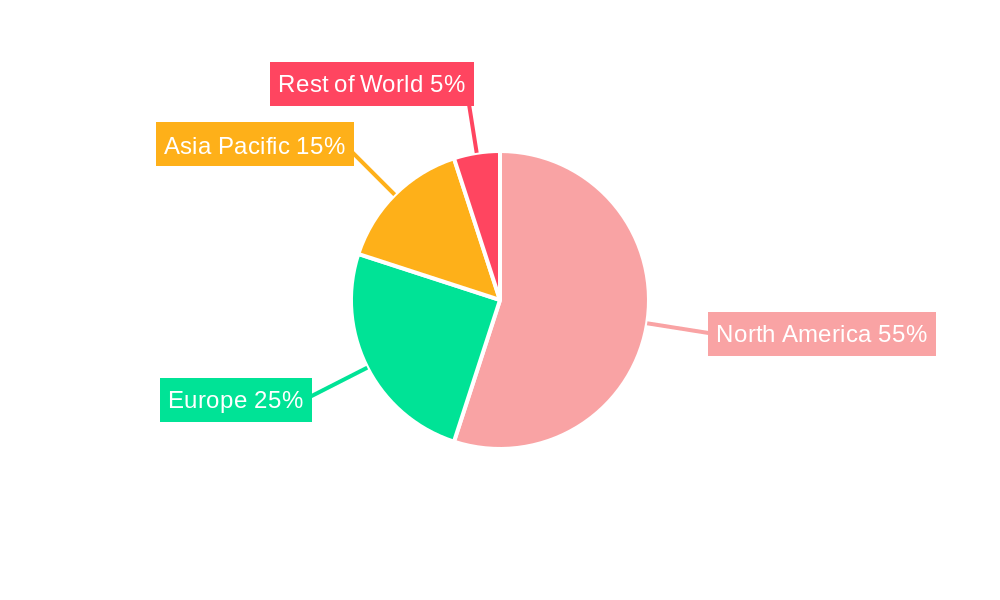
Dominant Regions, Countries, or Segments in United States Sensor Market
The [insert leading region, e.g., Northeast] region currently dominates the United States sensor market, accounting for approximately xx% of the total market share in 2025. This dominance is attributed to a combination of factors, including:
- Strong Presence of Key Players: High concentration of major sensor manufacturers and their extensive distribution networks.
- Advanced Infrastructure: Well-developed infrastructure supporting technological adoption and deployment.
- Robust Research and Development: Significant investments in R&D activities leading to innovation and technological advancements.
- Favorable Government Policies: Government support for technology development and adoption.
California and Texas are key states within this region, benefiting from substantial technology investments and a skilled workforce. Other regions, such as the South and Midwest, are also expected to demonstrate considerable growth potential in the coming years, fueled by industrial expansion and infrastructure development.
United States Sensor Market Product Landscape
The United States sensor market showcases a diverse product landscape, featuring a wide array of sensors with varying functionalities and performance metrics. Recent innovations include improvements in sensor sensitivity, miniaturization, power efficiency, and wireless connectivity. The integration of AI and machine learning is enhancing sensor capabilities, enabling advanced data analysis and decision-making. Key applications span diverse sectors, including automotive safety systems, industrial automation, healthcare monitoring, and consumer electronics. Unique selling propositions often center around high accuracy, reliability, durability, and ease of integration.
Key Drivers, Barriers & Challenges in United States Sensor Market
Key Drivers:
- Increasing adoption of IoT and Industry 4.0 technologies.
- Growing demand for automation in various sectors.
- Advancements in sensor technology, such as miniaturization, improved accuracy, and enhanced connectivity.
- Government initiatives promoting technological advancements.
Key Challenges:
- Supply chain disruptions affecting component availability and costs.
- Regulatory hurdles and compliance requirements.
- Intense competition among established players and emerging startups.
- High initial investment costs associated with sensor integration.
Emerging Opportunities in United States Sensor Market
Emerging opportunities exist in several areas:
- Expanding application in the Internet of Medical Things (IoMT).
- Growing demand for high-precision sensors in autonomous vehicles.
- Development of advanced sensor fusion technologies.
- Integration of sensors with AI and machine learning for enhanced data analytics.
Growth Accelerators in the United States Sensor Market Industry
Long-term growth will be driven by technological breakthroughs in sensor materials and manufacturing processes, leading to improved performance and reduced costs. Strategic partnerships and collaborations between sensor manufacturers and technology companies will accelerate innovation and market penetration. The expansion of sensor applications into new markets, such as smart agriculture and environmental monitoring, presents significant growth opportunities.
Key Players Shaping the United States Sensor Market Market
- Texas Instruments Incorporated
- TE Connectivity Ltd
- Omega Engineering Inc
- Honeywell International Inc
- Rockwell Automation Inc
- Siemens AG
- STMicroelectronics Inc
- AMS Osram AG
- NXP Semiconductors NV
- Infineon Technologies AG
- Bosch Sensortec GmbH
- Sick AG
- ABB Limited
- Omron Corporation
- Allegro MicroSystems In
Notable Milestones in United States Sensor Market Sector
- April 2024: TE Connectivity launched two new wireless pressure sensors (65xxN and 69xxN) for periodic condition monitoring, leveraging BLE 5.3 technology.
- January 2024: Texas Instruments unveiled the AWR2544, a 77GHz millimeter-wave radar sensor chip for enhanced autonomy in ADAS.
In-Depth United States Sensor Market Market Outlook
The future of the United States sensor market is bright, with continued growth fueled by technological advancements, expanding applications, and increasing demand across various sectors. Strategic investments in R&D, coupled with strategic partnerships and acquisitions, will further enhance market competitiveness. The focus on developing cost-effective, high-performance sensors, along with enhanced data analytics capabilities, will unlock new opportunities and drive long-term growth. The market's potential extends to untapped sectors, presenting significant opportunities for market expansion and innovation.
United States Sensor Market Segmentation
-
1. Product Type
- 1.1. Pressure
- 1.2. Level
- 1.3. Flow
- 1.4. Proximity
- 1.5. Environmental
- 1.6. Chemical
- 1.7. Inertial
-
1.8. Magnetic
- 1.8.1. Hall Effect Sensors
- 1.8.2. Other Magnetic Sensors
- 1.9. Position Sensors
- 1.10. Current Sensors
- 1.11. Other Types
-
2. Mode of Operation
- 2.1. Optical
- 2.2. Electrical Resistance
- 2.3. Biosensor
- 2.4. Piezoresistive
- 2.5. Image
- 2.6. Capacitive
- 2.7. Piezoelectric
- 2.8. Lidar
- 2.9. Radar
- 2.10. Other Modes of Operation
-
3. End-user Industry
- 3.1. Automotive
- 3.2. Consumer Electronics
- 3.3. Energy
- 3.4. Industrial and Other
- 3.5. Medical and Wellness
- 3.6. Construction, Agriculture and Mining
- 3.7. Aerospace
- 3.8. Robotics
United States Sensor Market Segmentation By Geography
- 1. United States
United States Sensor Market REPORT HIGHLIGHTS
| Aspects | Details |
|---|---|
| Study Period | 2019-2033 |
| Base Year | 2024 |
| Estimated Year | 2025 |
| Forecast Period | 2025-2033 |
| Historical Period | 2019-2024 |
| Growth Rate | CAGR of 7.79% from 2019-2033 |
| Segmentation |
|
Table of Contents
- 1. Introduction
- 1.1. Research Scope
- 1.2. Market Segmentation
- 1.3. Research Methodology
- 1.4. Definitions and Assumptions
- 2. Executive Summary
- 2.1. Introduction
- 3. Market Dynamics
- 3.1. Introduction
- 3.2. Market Drivers
- 3.2.1. Rising Demand for IoT and Connected Devices; Increasing Adoption of Advanced Sensor Technologies in Automotive Industry
- 3.3. Market Restrains
- 3.3.1. Rising Demand for IoT and Connected Devices; Increasing Adoption of Advanced Sensor Technologies in Automotive Industry
- 3.4. Market Trends
- 3.4.1. Retractable Safety Syringes Segment Expected to Witness Significant Growth During the Forecast Period
- 4. Market Factor Analysis
- 4.1. Porters Five Forces
- 4.2. Supply/Value Chain
- 4.3. PESTEL analysis
- 4.4. Market Entropy
- 4.5. Patent/Trademark Analysis
- 5. United States Sensor Market Analysis, Insights and Forecast, 2019-2031
- 5.1. Market Analysis, Insights and Forecast - by Product Type
- 5.1.1. Pressure
- 5.1.2. Level
- 5.1.3. Flow
- 5.1.4. Proximity
- 5.1.5. Environmental
- 5.1.6. Chemical
- 5.1.7. Inertial
- 5.1.8. Magnetic
- 5.1.8.1. Hall Effect Sensors
- 5.1.8.2. Other Magnetic Sensors
- 5.1.9. Position Sensors
- 5.1.10. Current Sensors
- 5.1.11. Other Types
- 5.2. Market Analysis, Insights and Forecast - by Mode of Operation
- 5.2.1. Optical
- 5.2.2. Electrical Resistance
- 5.2.3. Biosensor
- 5.2.4. Piezoresistive
- 5.2.5. Image
- 5.2.6. Capacitive
- 5.2.7. Piezoelectric
- 5.2.8. Lidar
- 5.2.9. Radar
- 5.2.10. Other Modes of Operation
- 5.3. Market Analysis, Insights and Forecast - by End-user Industry
- 5.3.1. Automotive
- 5.3.2. Consumer Electronics
- 5.3.3. Energy
- 5.3.4. Industrial and Other
- 5.3.5. Medical and Wellness
- 5.3.6. Construction, Agriculture and Mining
- 5.3.7. Aerospace
- 5.3.8. Robotics
- 5.4. Market Analysis, Insights and Forecast - by Region
- 5.4.1. United States
- 5.1. Market Analysis, Insights and Forecast - by Product Type
- 6. Competitive Analysis
- 6.1. Market Share Analysis 2024
- 6.2. Company Profiles
- 6.2.1 Texas Instruments Incorporated
- 6.2.1.1. Overview
- 6.2.1.2. Products
- 6.2.1.3. SWOT Analysis
- 6.2.1.4. Recent Developments
- 6.2.1.5. Financials (Based on Availability)
- 6.2.2 TE Connectivity Ltd
- 6.2.2.1. Overview
- 6.2.2.2. Products
- 6.2.2.3. SWOT Analysis
- 6.2.2.4. Recent Developments
- 6.2.2.5. Financials (Based on Availability)
- 6.2.3 Omega Engineering Inc
- 6.2.3.1. Overview
- 6.2.3.2. Products
- 6.2.3.3. SWOT Analysis
- 6.2.3.4. Recent Developments
- 6.2.3.5. Financials (Based on Availability)
- 6.2.4 Honeywell International Inc
- 6.2.4.1. Overview
- 6.2.4.2. Products
- 6.2.4.3. SWOT Analysis
- 6.2.4.4. Recent Developments
- 6.2.4.5. Financials (Based on Availability)
- 6.2.5 Rockwell Automation Inc
- 6.2.5.1. Overview
- 6.2.5.2. Products
- 6.2.5.3. SWOT Analysis
- 6.2.5.4. Recent Developments
- 6.2.5.5. Financials (Based on Availability)
- 6.2.6 Siemens AG
- 6.2.6.1. Overview
- 6.2.6.2. Products
- 6.2.6.3. SWOT Analysis
- 6.2.6.4. Recent Developments
- 6.2.6.5. Financials (Based on Availability)
- 6.2.7 STMicroelectronics Inc
- 6.2.7.1. Overview
- 6.2.7.2. Products
- 6.2.7.3. SWOT Analysis
- 6.2.7.4. Recent Developments
- 6.2.7.5. Financials (Based on Availability)
- 6.2.8 AMS Osram AG
- 6.2.8.1. Overview
- 6.2.8.2. Products
- 6.2.8.3. SWOT Analysis
- 6.2.8.4. Recent Developments
- 6.2.8.5. Financials (Based on Availability)
- 6.2.9 NXP Semiconductors NV
- 6.2.9.1. Overview
- 6.2.9.2. Products
- 6.2.9.3. SWOT Analysis
- 6.2.9.4. Recent Developments
- 6.2.9.5. Financials (Based on Availability)
- 6.2.10 Infineon Technologies AG
- 6.2.10.1. Overview
- 6.2.10.2. Products
- 6.2.10.3. SWOT Analysis
- 6.2.10.4. Recent Developments
- 6.2.10.5. Financials (Based on Availability)
- 6.2.11 Bosch Sensortec GmbH
- 6.2.11.1. Overview
- 6.2.11.2. Products
- 6.2.11.3. SWOT Analysis
- 6.2.11.4. Recent Developments
- 6.2.11.5. Financials (Based on Availability)
- 6.2.12 Sick AG
- 6.2.12.1. Overview
- 6.2.12.2. Products
- 6.2.12.3. SWOT Analysis
- 6.2.12.4. Recent Developments
- 6.2.12.5. Financials (Based on Availability)
- 6.2.13 ABB Limited
- 6.2.13.1. Overview
- 6.2.13.2. Products
- 6.2.13.3. SWOT Analysis
- 6.2.13.4. Recent Developments
- 6.2.13.5. Financials (Based on Availability)
- 6.2.14 Omron Corporation
- 6.2.14.1. Overview
- 6.2.14.2. Products
- 6.2.14.3. SWOT Analysis
- 6.2.14.4. Recent Developments
- 6.2.14.5. Financials (Based on Availability)
- 6.2.15 Allegro MicroSystems In
- 6.2.15.1. Overview
- 6.2.15.2. Products
- 6.2.15.3. SWOT Analysis
- 6.2.15.4. Recent Developments
- 6.2.15.5. Financials (Based on Availability)
- 6.2.1 Texas Instruments Incorporated
List of Figures
- Figure 1: United States Sensor Market Revenue Breakdown (Million, %) by Product 2024 & 2032
- Figure 2: United States Sensor Market Share (%) by Company 2024
List of Tables
- Table 1: United States Sensor Market Revenue Million Forecast, by Region 2019 & 2032
- Table 2: United States Sensor Market Volume Billion Forecast, by Region 2019 & 2032
- Table 3: United States Sensor Market Revenue Million Forecast, by Product Type 2019 & 2032
- Table 4: United States Sensor Market Volume Billion Forecast, by Product Type 2019 & 2032
- Table 5: United States Sensor Market Revenue Million Forecast, by Mode of Operation 2019 & 2032
- Table 6: United States Sensor Market Volume Billion Forecast, by Mode of Operation 2019 & 2032
- Table 7: United States Sensor Market Revenue Million Forecast, by End-user Industry 2019 & 2032
- Table 8: United States Sensor Market Volume Billion Forecast, by End-user Industry 2019 & 2032
- Table 9: United States Sensor Market Revenue Million Forecast, by Region 2019 & 2032
- Table 10: United States Sensor Market Volume Billion Forecast, by Region 2019 & 2032
- Table 11: United States Sensor Market Revenue Million Forecast, by Product Type 2019 & 2032
- Table 12: United States Sensor Market Volume Billion Forecast, by Product Type 2019 & 2032
- Table 13: United States Sensor Market Revenue Million Forecast, by Mode of Operation 2019 & 2032
- Table 14: United States Sensor Market Volume Billion Forecast, by Mode of Operation 2019 & 2032
- Table 15: United States Sensor Market Revenue Million Forecast, by End-user Industry 2019 & 2032
- Table 16: United States Sensor Market Volume Billion Forecast, by End-user Industry 2019 & 2032
- Table 17: United States Sensor Market Revenue Million Forecast, by Country 2019 & 2032
- Table 18: United States Sensor Market Volume Billion Forecast, by Country 2019 & 2032
Frequently Asked Questions
1. What is the projected Compound Annual Growth Rate (CAGR) of the United States Sensor Market?
The projected CAGR is approximately 7.79%.
2. Which companies are prominent players in the United States Sensor Market?
Key companies in the market include Texas Instruments Incorporated, TE Connectivity Ltd, Omega Engineering Inc, Honeywell International Inc, Rockwell Automation Inc, Siemens AG, STMicroelectronics Inc, AMS Osram AG, NXP Semiconductors NV, Infineon Technologies AG, Bosch Sensortec GmbH, Sick AG, ABB Limited, Omron Corporation, Allegro MicroSystems In.
3. What are the main segments of the United States Sensor Market?
The market segments include Product Type, Mode of Operation, End-user Industry.
4. Can you provide details about the market size?
The market size is estimated to be USD 28.94 Million as of 2022.
5. What are some drivers contributing to market growth?
Rising Demand for IoT and Connected Devices; Increasing Adoption of Advanced Sensor Technologies in Automotive Industry.
6. What are the notable trends driving market growth?
Retractable Safety Syringes Segment Expected to Witness Significant Growth During the Forecast Period.
7. Are there any restraints impacting market growth?
Rising Demand for IoT and Connected Devices; Increasing Adoption of Advanced Sensor Technologies in Automotive Industry.
8. Can you provide examples of recent developments in the market?
April 2024 - TE Connectivity (TE) expanded its product line by introducing two cutting-edge wireless pressure sensors. The first, the 65xxN sensor, is tailored for short-range applications, while the second, the 69xxN sensor, is optimized for long-range coverage. Both sensors are specifically crafted for periodic condition monitoring. Notably, the 65xxN sensor utilizes BLE (Bluetooth Low Energy) 5.3 technology, enabling seamless localized data collection and transmission.
9. What pricing options are available for accessing the report?
Pricing options include single-user, multi-user, and enterprise licenses priced at USD 3800, USD 4500, and USD 5800 respectively.
10. Is the market size provided in terms of value or volume?
The market size is provided in terms of value, measured in Million and volume, measured in Billion.
11. Are there any specific market keywords associated with the report?
Yes, the market keyword associated with the report is "United States Sensor Market," which aids in identifying and referencing the specific market segment covered.
12. How do I determine which pricing option suits my needs best?
The pricing options vary based on user requirements and access needs. Individual users may opt for single-user licenses, while businesses requiring broader access may choose multi-user or enterprise licenses for cost-effective access to the report.
13. Are there any additional resources or data provided in the United States Sensor Market report?
While the report offers comprehensive insights, it's advisable to review the specific contents or supplementary materials provided to ascertain if additional resources or data are available.
14. How can I stay updated on further developments or reports in the United States Sensor Market?
To stay informed about further developments, trends, and reports in the United States Sensor Market, consider subscribing to industry newsletters, following relevant companies and organizations, or regularly checking reputable industry news sources and publications.
Methodology
Step 1 - Identification of Relevant Samples Size from Population Database


Step 2 - Approaches for Defining Global Market Size (Value, Volume* & Price*)

Note*: In applicable scenarios
Step 3 - Data Sources
Primary Research
- Web Analytics
- Survey Reports
- Research Institute
- Latest Research Reports
- Opinion Leaders
Secondary Research
- Annual Reports
- White Paper
- Latest Press Release
- Industry Association
- Paid Database
- Investor Presentations

Step 4 - Data Triangulation
Involves using different sources of information in order to increase the validity of a study
These sources are likely to be stakeholders in a program - participants, other researchers, program staff, other community members, and so on.
Then we put all data in single framework & apply various statistical tools to find out the dynamic on the market.
During the analysis stage, feedback from the stakeholder groups would be compared to determine areas of agreement as well as areas of divergence


