
Key Insights
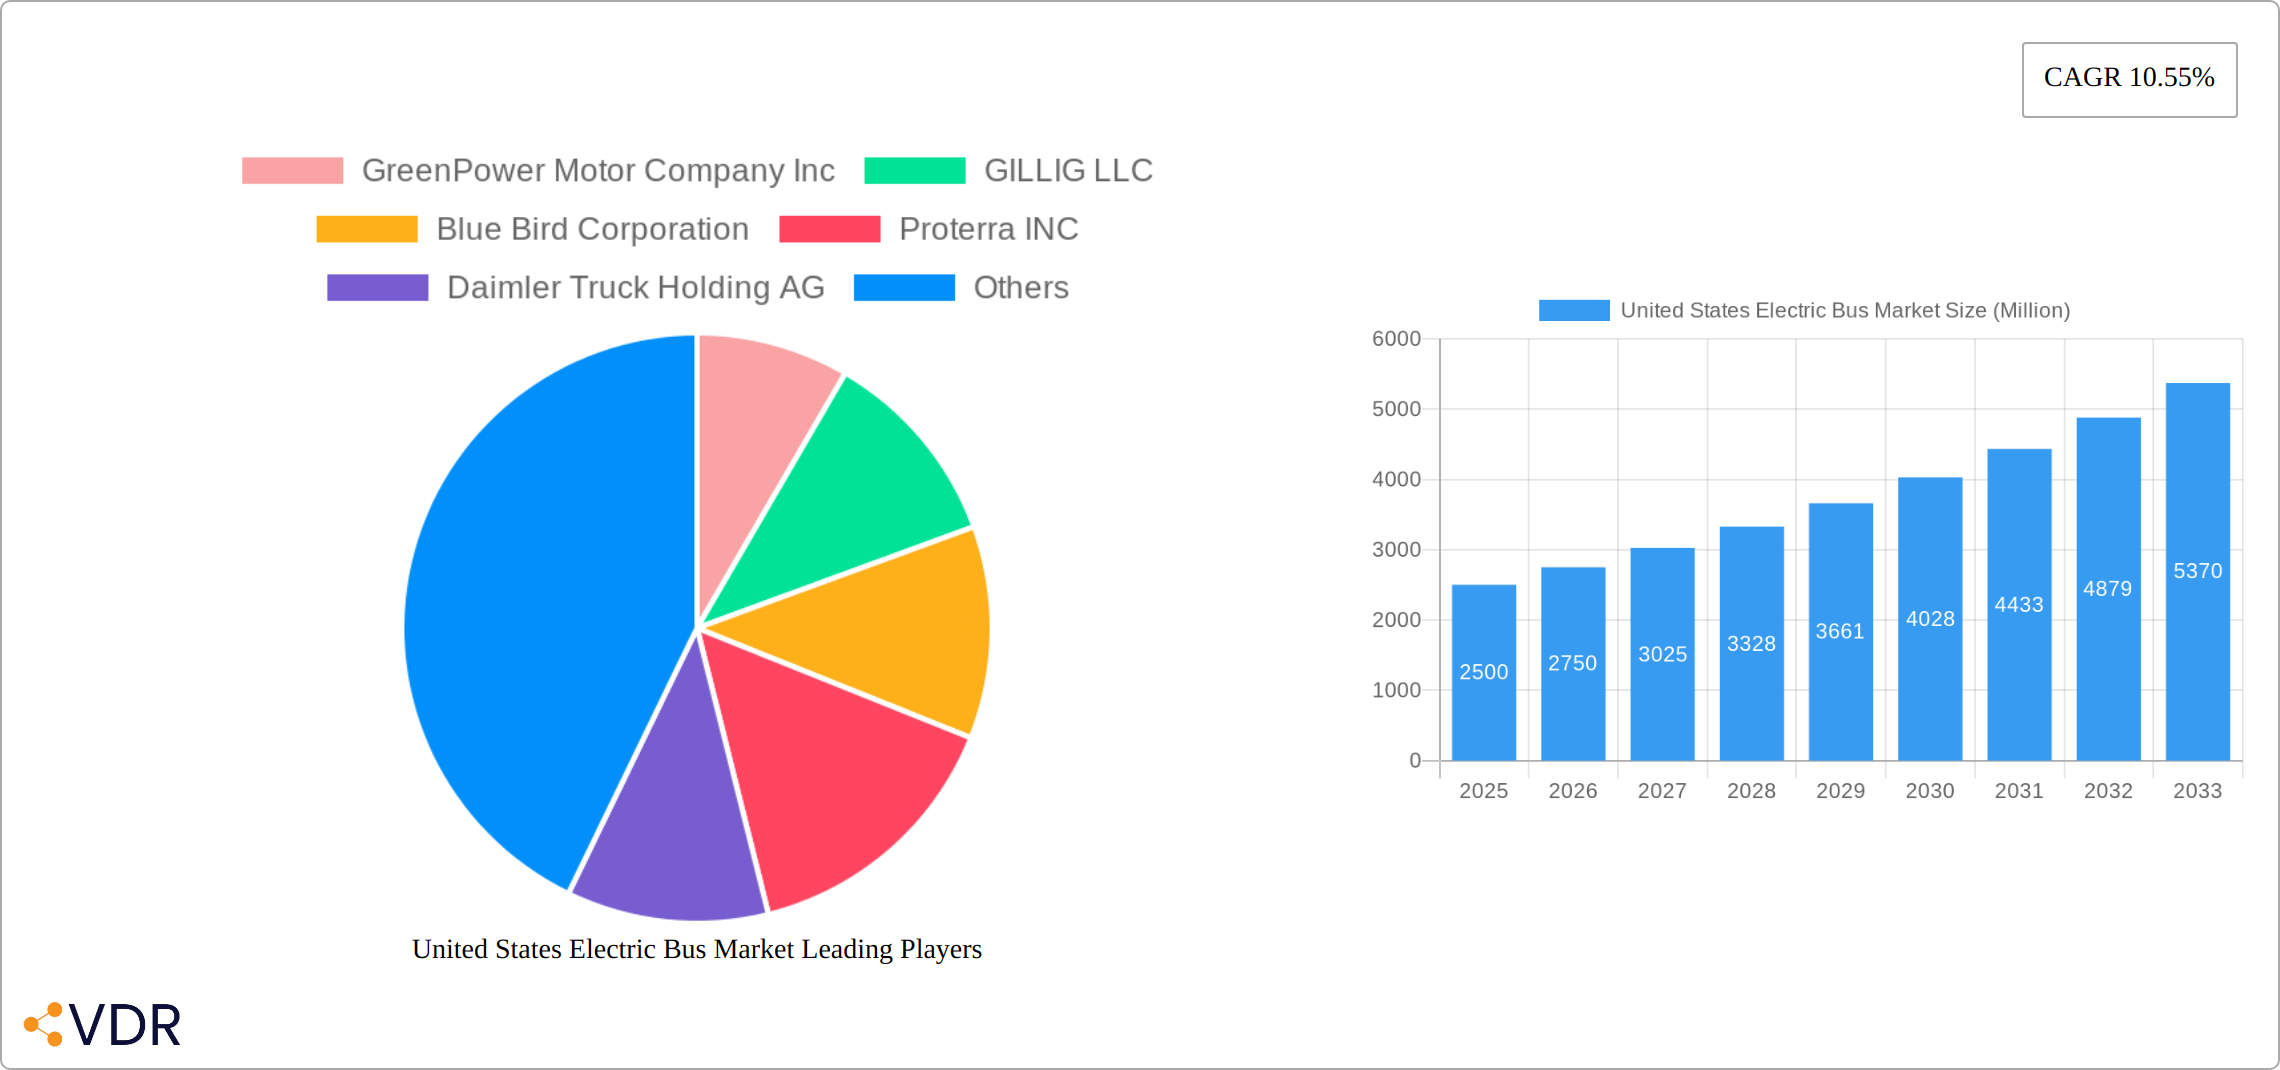
The United States electric bus market is experiencing robust growth, driven by stringent emission regulations, increasing environmental concerns, and government incentives promoting sustainable transportation. The market's compound annual growth rate (CAGR) of 10.55% from 2019 to 2024 suggests a significant upward trajectory, projected to continue through 2033. While precise market size figures for 2019-2024 are unavailable, we can infer substantial expansion based on the provided CAGR and the increasing adoption of electric vehicles across various sectors. Key market segments include Battery Electric Vehicles (BEVs), Fuel Cell Electric Vehicles (FCEVs), and Hybrid Electric Vehicles (HEVs), with BEVs likely dominating due to technological advancements and decreasing battery costs. Leading players such as GreenPower Motor Company, GILLIG, Blue Bird, Proterra, Daimler, NFI Group, Volvo Group, BYD Auto, REV Group, and Lion Electric are actively shaping the market landscape through innovation and strategic partnerships. The market's growth is further fueled by the increasing demand for efficient public transportation solutions in urban areas, and federal and state investments into electric vehicle infrastructure.
Challenges remain, however. High initial investment costs for electric buses, coupled with limited charging infrastructure in some regions, can hinder widespread adoption. Furthermore, concerns about battery life, charging times, and the overall lifecycle costs compared to traditional diesel buses require ongoing technological advancements and supportive policies to overcome. Despite these restraints, the long-term outlook for the US electric bus market remains positive, spurred by continuous technological improvements, supportive government policies, and rising consumer and environmental awareness. The market is poised for significant expansion in the coming decade, transforming the public transportation sector and contributing to a greener future.
United States Electric Bus Market: A Comprehensive Report (2019-2033)
This in-depth report provides a comprehensive analysis of the burgeoning United States electric bus market, encompassing market dynamics, growth trends, regional segmentation, product landscape, and key players. With a study period spanning 2019-2033, a base year of 2025, and a forecast period of 2025-2033, this report offers invaluable insights for industry professionals, investors, and strategic decision-makers. The report analyzes the parent market of commercial vehicles and the child market of electric buses, providing a granular understanding of market segmentation by fuel category (BEV, FCEV, HEV). The projected market size is expected to reach xx million units by 2033.
United States Electric Bus Market Dynamics & Structure
The US electric bus market is characterized by increasing market concentration, driven by significant investments and acquisitions in the sector. Technological innovation, particularly in battery technology and charging infrastructure, is a key driver, while stringent emission regulations are pushing adoption. Competition from traditional diesel and compressed natural gas (CNG) buses remains, although electric buses are gaining a competitive edge due to decreasing costs and government incentives. The market is witnessing a rise in mergers and acquisitions (M&A) activity, with larger players consolidating their positions and expanding their market share. End-user demographics are evolving, with municipalities and school districts increasingly prioritizing sustainable transportation solutions.
- Market Concentration: The market is moderately concentrated, with a few major players holding significant market share, while smaller niche players focus on specific segments. The top 5 players are estimated to hold xx% of the market share in 2025.
- Technological Innovation: Advancements in battery technology, including increased range and faster charging times, are major drivers. Innovation in charging infrastructure, such as fast charging and wireless charging, is crucial for widespread adoption.
- Regulatory Framework: Stringent emission regulations at the federal and state levels are creating a favorable environment for electric bus adoption. Incentive programs and subsidies further accelerate market growth.
- Competitive Substitutes: Diesel and CNG buses are the main competitors. However, the increasing cost competitiveness and environmental benefits of electric buses are favoring their adoption.
- M&A Trends: Consolidation is evident, with larger companies acquiring smaller players to expand their product portfolio and market reach. The number of M&A deals is estimated to reach xx in 2025.
- End-User Demographics: Key end-users include public transit agencies, school districts, and private shuttle operators. The demand is growing across all segments.
United States Electric Bus Market Growth Trends & Insights
The US electric bus market is experiencing robust growth, fueled by a confluence of factors including stringent government mandates aimed at reducing carbon emissions, escalating environmental concerns among citizens, and rapid technological advancements in battery technology and charging infrastructure. The period from 2019 to 2024 witnessed a substantial surge in electric bus adoption across various states and municipalities. Looking ahead, the forecast period (2025-2033) projects continued, strong growth, with a projected compound annual growth rate (CAGR) estimated at [Insert CAGR Percentage]%. This growth trajectory reflects a steadily increasing market penetration rate, as electric buses progressively gain market share from their traditional, fossil-fuel-powered counterparts. Technological innovations, such as the development of more energy-dense solid-state batteries and the expansion of convenient and reliable charging infrastructure, are key catalysts accelerating this market expansion. Furthermore, a shift in consumer behavior towards eco-friendly transportation solutions is significantly contributing to the heightened demand for electric buses. The market size is projected to expand from [Insert 2025 Market Size in Million Units] million units in 2025 to [Insert 2033 Market Size in Million Units] million units by 2033.
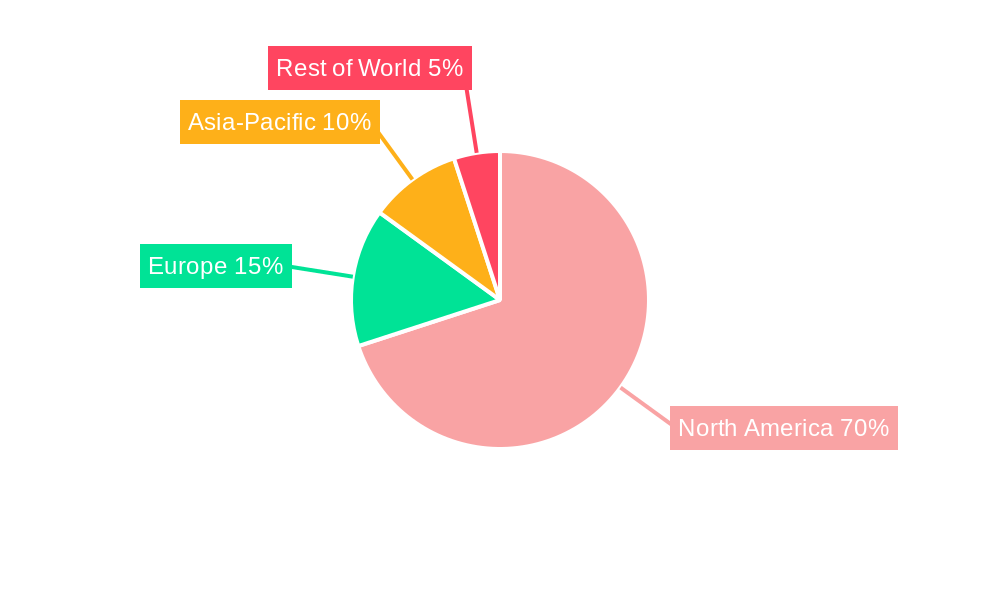
Dominant Regions, Countries, or Segments in United States Electric Bus Market
California, alongside other states with proactive emission reduction regulations and supportive government policies, are spearheading the adoption of electric buses within the United States. The Battery Electric Vehicle (BEV) segment currently holds a dominant position in the market, primarily due to its technological maturity, relatively lower initial costs compared to Fuel Cell Electric Vehicles (FCEVs), and wider availability. Key drivers propelling this market segment include:
- Economic Policies: A combination of federal and state-level financial incentives, encompassing tax credits and grants, substantially reduces the upfront cost of acquiring and deploying electric buses, making them a more economically viable option for transit agencies.
- Infrastructure Development: Significant investments in the development of robust and reliable charging infrastructure are paramount to the widespread and successful adoption of electric buses. This includes the installation of fast-charging stations and the integration of smart grid technologies.
- Environmental Regulations: Stringent emission standards enforced at both the state and federal levels are compelling municipalities and transit agencies to transition towards cleaner, more sustainable transportation options, driving demand for electric buses.
California's leading role is attributed to its ambitious climate goals, a robust and supportive regulatory framework, and substantial investments in electric vehicle infrastructure. Other regions across the nation are rapidly catching up, driven by similar policy initiatives, increasing awareness of environmental sustainability, and a growing commitment to reducing greenhouse gas emissions. The continued dominance of the BEV segment is underpinned by its advanced technological maturity, lower initial capital expenditures, and wider market availability compared to the comparatively less mature FCEV technology.
United States Electric Bus Market Product Landscape
The electric bus market showcases a range of vehicle sizes, capacities, and technological advancements. Manufacturers are focusing on improving battery range, charging speed, and overall vehicle performance to enhance operational efficiency. Unique selling propositions include advanced safety features, improved passenger comfort, and reduced operating costs compared to traditional buses. Technological advancements such as advanced driver-assistance systems (ADAS) and telematics are also being incorporated.
Key Drivers, Barriers & Challenges in United States Electric Bus Market
Key Drivers:
- Government regulations: Stringent emission standards and supportive policies are accelerating adoption.
- Environmental concerns: The need to reduce greenhouse gas emissions is a major driver.
- Technological advancements: Improved battery technology and charging infrastructure are crucial factors.
- Cost reductions: Falling battery prices and economies of scale are making electric buses more cost-competitive.
Challenges:
- High initial investment costs: The upfront cost of electric buses remains a significant barrier for many operators.
- Charging infrastructure limitations: The lack of widespread charging infrastructure can limit operational range and convenience.
- Limited range and charging time: While improving, these aspects still need further enhancement.
- Supply chain disruptions: Challenges in sourcing raw materials and components can impact production.
Emerging Opportunities in United States Electric Bus Market
- Growth in rural areas: The expansion of electric bus adoption into currently underserved rural markets presents a substantial and largely untapped opportunity for growth and increased market penetration.
- Innovative applications: Exploring novel applications beyond traditional public transit, such as last-mile delivery solutions, specialized transportation services (e.g., airport shuttles), and campus transit systems, offers significant potential for market expansion.
- Integration of smart technologies: The incorporation of advanced technologies like autonomous driving capabilities and connected vehicle systems can enhance efficiency, safety, and operational optimization, further driving market demand.
Growth Accelerators in the United States Electric Bus Market Industry
Significant technological breakthroughs in battery technology, particularly the ongoing development and refinement of solid-state batteries, are poised to dramatically enhance the range and reduce the charging times of electric buses, thereby accelerating market growth. Strategic partnerships and collaborations among electric bus manufacturers, charging infrastructure providers, and government agencies are essential for creating a comprehensive and supportive ecosystem that facilitates the widespread adoption of electric buses. Expanding market penetration into untapped geographic regions and diverse applications, coupled with continuous technological advancements, will be key drivers of sustained long-term growth in the US electric bus market.
Key Players Shaping the United States Electric Bus Market Market
- GreenPower Motor Company Inc
- GILLIG LLC
- Blue Bird Corporation
- Proterra INC
- Daimler Truck Holding AG
- NFI Group Inc
- Volvo Group
- BYD Auto Co Ltd
- REV group Inc
- Lion Electric Company
Notable Milestones in United States Electric Bus Market Sector
- December 2023: Proterra announced its new EV battery factory in South Carolina, signaling increased demand for commercial electric vehicles.
- October 2023: BYD partnered with the Los Olivos Elementary School District, creating the first 100% zero-emission school bus fleet in the US.
- October 2023: Solaris launched two new electric bus models (Urbino 12 Electric and Urbino 18.75 Electric) – while the launch was in Poland, this highlights the global nature of EV bus development and potential for future US market entry.
In-Depth United States Electric Bus Market Market Outlook
The future of the US electric bus market is bright, driven by continued technological advancements, supportive government policies, and growing environmental awareness. Strategic opportunities exist for companies to expand their market share by focusing on innovation, strategic partnerships, and expansion into underserved markets. The market is poised for significant growth, with a strong potential for further consolidation and increased adoption across diverse sectors.
United States Electric Bus Market Segmentation
-
1. Fuel Category
- 1.1. BEV
- 1.2. FCEV
- 1.3. HEV
United States Electric Bus Market Segmentation By Geography
- 1. United States
United States Electric Bus Market REPORT HIGHLIGHTS
| Aspects | Details |
|---|---|
| Study Period | 2019-2033 |
| Base Year | 2024 |
| Estimated Year | 2025 |
| Forecast Period | 2025-2033 |
| Historical Period | 2019-2024 |
| Growth Rate | CAGR of 10.55% from 2019-2033 |
| Segmentation |
|
Table of Contents
- 1. Introduction
- 1.1. Research Scope
- 1.2. Market Segmentation
- 1.3. Research Methodology
- 1.4. Definitions and Assumptions
- 2. Executive Summary
- 2.1. Introduction
- 3. Market Dynamics
- 3.1. Introduction
- 3.2. Market Drivers
- 3.2.1. Growing Travel and Tourism Industry is Driving the Car Rental Market
- 3.3. Market Restrains
- 3.3.1. Increasing Popularity of Ride-Sharing Services Pose Challenges for the Conventional Car Rental Market
- 3.4. Market Trends
- 3.4.1. OTHER KEY INDUSTRY TRENDS COVERED IN THE REPORT
- 4. Market Factor Analysis
- 4.1. Porters Five Forces
- 4.2. Supply/Value Chain
- 4.3. PESTEL analysis
- 4.4. Market Entropy
- 4.5. Patent/Trademark Analysis
- 5. United States Electric Bus Market Analysis, Insights and Forecast, 2019-2031
- 5.1. Market Analysis, Insights and Forecast - by Fuel Category
- 5.1.1. BEV
- 5.1.2. FCEV
- 5.1.3. HEV
- 5.2. Market Analysis, Insights and Forecast - by Region
- 5.2.1. United States
- 5.1. Market Analysis, Insights and Forecast - by Fuel Category
- 6. Competitive Analysis
- 6.1. Market Share Analysis 2024
- 6.2. Company Profiles
- 6.2.1 GreenPower Motor Company Inc
- 6.2.1.1. Overview
- 6.2.1.2. Products
- 6.2.1.3. SWOT Analysis
- 6.2.1.4. Recent Developments
- 6.2.1.5. Financials (Based on Availability)
- 6.2.2 GILLIG LLC
- 6.2.2.1. Overview
- 6.2.2.2. Products
- 6.2.2.3. SWOT Analysis
- 6.2.2.4. Recent Developments
- 6.2.2.5. Financials (Based on Availability)
- 6.2.3 Blue Bird Corporation
- 6.2.3.1. Overview
- 6.2.3.2. Products
- 6.2.3.3. SWOT Analysis
- 6.2.3.4. Recent Developments
- 6.2.3.5. Financials (Based on Availability)
- 6.2.4 Proterra INC
- 6.2.4.1. Overview
- 6.2.4.2. Products
- 6.2.4.3. SWOT Analysis
- 6.2.4.4. Recent Developments
- 6.2.4.5. Financials (Based on Availability)
- 6.2.5 Daimler Truck Holding AG
- 6.2.5.1. Overview
- 6.2.5.2. Products
- 6.2.5.3. SWOT Analysis
- 6.2.5.4. Recent Developments
- 6.2.5.5. Financials (Based on Availability)
- 6.2.6 NFI Group Inc
- 6.2.6.1. Overview
- 6.2.6.2. Products
- 6.2.6.3. SWOT Analysis
- 6.2.6.4. Recent Developments
- 6.2.6.5. Financials (Based on Availability)
- 6.2.7 Volvo Grou
- 6.2.7.1. Overview
- 6.2.7.2. Products
- 6.2.7.3. SWOT Analysis
- 6.2.7.4. Recent Developments
- 6.2.7.5. Financials (Based on Availability)
- 6.2.8 BYD Auto Co Ltd
- 6.2.8.1. Overview
- 6.2.8.2. Products
- 6.2.8.3. SWOT Analysis
- 6.2.8.4. Recent Developments
- 6.2.8.5. Financials (Based on Availability)
- 6.2.9 REV group Inc
- 6.2.9.1. Overview
- 6.2.9.2. Products
- 6.2.9.3. SWOT Analysis
- 6.2.9.4. Recent Developments
- 6.2.9.5. Financials (Based on Availability)
- 6.2.10 Lion Electric Company
- 6.2.10.1. Overview
- 6.2.10.2. Products
- 6.2.10.3. SWOT Analysis
- 6.2.10.4. Recent Developments
- 6.2.10.5. Financials (Based on Availability)
- 6.2.1 GreenPower Motor Company Inc
List of Figures
- Figure 1: United States Electric Bus Market Revenue Breakdown (Million, %) by Product 2024 & 2032
- Figure 2: United States Electric Bus Market Share (%) by Company 2024
List of Tables
- Table 1: United States Electric Bus Market Revenue Million Forecast, by Region 2019 & 2032
- Table 2: United States Electric Bus Market Revenue Million Forecast, by Fuel Category 2019 & 2032
- Table 3: United States Electric Bus Market Revenue Million Forecast, by Region 2019 & 2032
- Table 4: United States Electric Bus Market Revenue Million Forecast, by Fuel Category 2019 & 2032
- Table 5: United States Electric Bus Market Revenue Million Forecast, by Country 2019 & 2032
Frequently Asked Questions
1. What is the projected Compound Annual Growth Rate (CAGR) of the United States Electric Bus Market?
The projected CAGR is approximately 10.55%.
2. Which companies are prominent players in the United States Electric Bus Market?
Key companies in the market include GreenPower Motor Company Inc, GILLIG LLC, Blue Bird Corporation, Proterra INC, Daimler Truck Holding AG, NFI Group Inc, Volvo Grou, BYD Auto Co Ltd, REV group Inc, Lion Electric Company.
3. What are the main segments of the United States Electric Bus Market?
The market segments include Fuel Category.
4. Can you provide details about the market size?
The market size is estimated to be USD XX Million as of 2022.
5. What are some drivers contributing to market growth?
Growing Travel and Tourism Industry is Driving the Car Rental Market.
6. What are the notable trends driving market growth?
OTHER KEY INDUSTRY TRENDS COVERED IN THE REPORT.
7. Are there any restraints impacting market growth?
Increasing Popularity of Ride-Sharing Services Pose Challenges for the Conventional Car Rental Market.
8. Can you provide examples of recent developments in the market?
December 2023: Proterra announced its new EV battery factory in South Carolina as demand for commercial electric vehicles increased.October 2023: In October 2022, Solaris launched two new electric buses, Urbino 12 Electric and Urbino 18.75 Electric, at the 6th International Fair of Public Transport – Transexpo in Kielce, Poland.October 2023: BYD (Build Your Dreams) announced that a partnership with the Los Olivos Elementary School District would bring a BYD Type A electric school bus to Santa Barbara County students, making the Los Olivos Elementary School District the first in the United States to have 100% zero-emission fleet of school buses.
9. What pricing options are available for accessing the report?
Pricing options include single-user, multi-user, and enterprise licenses priced at USD 3800, USD 4500, and USD 5800 respectively.
10. Is the market size provided in terms of value or volume?
The market size is provided in terms of value, measured in Million.
11. Are there any specific market keywords associated with the report?
Yes, the market keyword associated with the report is "United States Electric Bus Market," which aids in identifying and referencing the specific market segment covered.
12. How do I determine which pricing option suits my needs best?
The pricing options vary based on user requirements and access needs. Individual users may opt for single-user licenses, while businesses requiring broader access may choose multi-user or enterprise licenses for cost-effective access to the report.
13. Are there any additional resources or data provided in the United States Electric Bus Market report?
While the report offers comprehensive insights, it's advisable to review the specific contents or supplementary materials provided to ascertain if additional resources or data are available.
14. How can I stay updated on further developments or reports in the United States Electric Bus Market?
To stay informed about further developments, trends, and reports in the United States Electric Bus Market, consider subscribing to industry newsletters, following relevant companies and organizations, or regularly checking reputable industry news sources and publications.
Methodology
Step 1 - Identification of Relevant Samples Size from Population Database


Step 2 - Approaches for Defining Global Market Size (Value, Volume* & Price*)

Note*: In applicable scenarios
Step 3 - Data Sources
Primary Research
- Web Analytics
- Survey Reports
- Research Institute
- Latest Research Reports
- Opinion Leaders
Secondary Research
- Annual Reports
- White Paper
- Latest Press Release
- Industry Association
- Paid Database
- Investor Presentations

Step 4 - Data Triangulation
Involves using different sources of information in order to increase the validity of a study
These sources are likely to be stakeholders in a program - participants, other researchers, program staff, other community members, and so on.
Then we put all data in single framework & apply various statistical tools to find out the dynamic on the market.
During the analysis stage, feedback from the stakeholder groups would be compared to determine areas of agreement as well as areas of divergence


