
Key Insights
The United States commercial vehicle market is experiencing robust growth, driven by a burgeoning e-commerce sector demanding efficient logistics and a gradual but steady shift towards sustainable transportation solutions. The market's expansion is fueled by increasing infrastructure investments, particularly in areas supporting long-haul trucking and last-mile delivery. The rising adoption of hybrid and electric commercial vehicles, though still a smaller segment, is significantly impacting the market's trajectory, propelled by government incentives and corporate sustainability initiatives. While fuel price fluctuations and the overall economic climate present challenges, the consistent demand for goods transportation ensures a relatively stable market outlook. The increasing focus on fuel efficiency and reducing carbon emissions is further driving technological advancements within the sector, leading to innovations in vehicle design and alternative fuel options such as LPG. Major players like PACCAR, Daimler, and Volvo are strategically investing in research and development, aiming to capitalize on this growth and cater to the evolving needs of diverse industries, including construction, logistics, and retail.
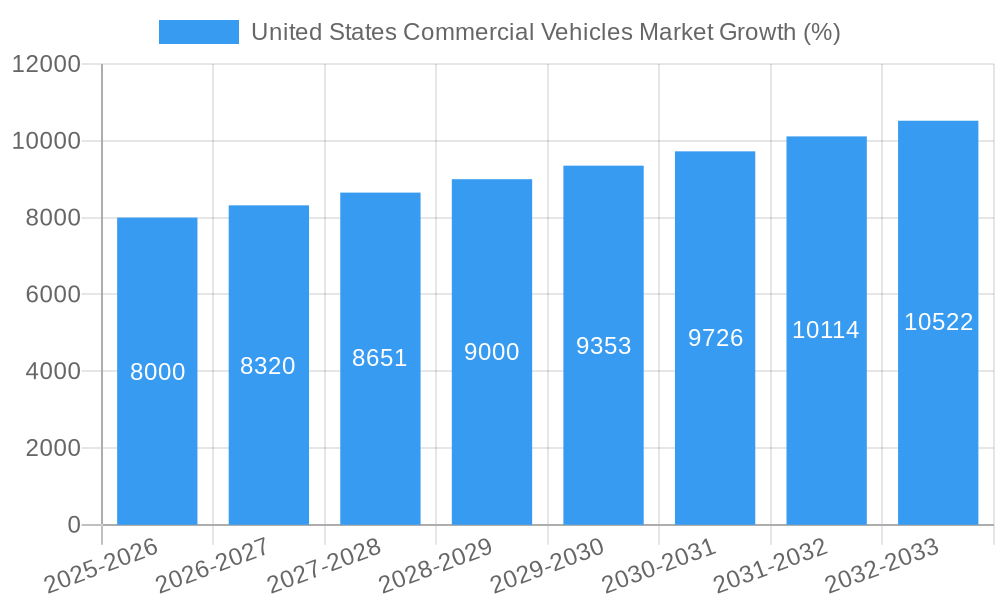
The forecast period of 2025-2033 projects continued expansion for the US commercial vehicle market, with the CAGR exceeding 4%. Segment-wise, the hybrid and electric vehicle segment is poised for accelerated growth, potentially outpacing the LPG segment in the coming years due to growing environmental concerns and supportive government policies. Commercial vehicle types such as heavy-duty trucks and delivery vans will continue to dominate the market, reflecting the sustained demand for freight transportation. Regional variations within the US might exist, reflecting differences in economic activity and infrastructure development across states. However, overall, the national market demonstrates a positive and expansive outlook, characterized by technological innovation, regulatory shifts, and a sustained demand for reliable and efficient commercial transportation solutions.
United States Commercial Vehicles Market: A Comprehensive Market Report (2019-2033)
This comprehensive report provides an in-depth analysis of the United States Commercial Vehicles Market, encompassing market dynamics, growth trends, competitive landscape, and future outlook. The report covers the historical period (2019-2024), base year (2025), and forecast period (2025-2033), offering valuable insights for industry professionals, investors, and strategists. The market is segmented by Propulsion Type (Hybrid and Electric Vehicles, LPG) and Vehicle Type (Commercial Vehicles), providing a granular view of market performance across various segments. The total market size is projected to reach xx Million units by 2033.
United States Commercial Vehicles Market Dynamics & Structure
The US commercial vehicle market is characterized by a moderately concentrated structure, with key players like PACCAR Inc, Daimler Truck Holding AG, Ford Motor Company, General Motors Company, and Volvo Group holding significant market shares. Technological innovation, particularly in alternative fuel vehicles (AFVs) and advanced driver-assistance systems (ADAS), is a major driver. Stringent emission regulations and increasing fuel efficiency standards are shaping the market landscape. The rise of e-commerce and last-mile delivery services fuels demand for lighter commercial vehicles. Significant M&A activity has also been observed, with xx deals valued at xx million USD recorded in the past five years.
- Market Concentration: Moderately concentrated, with top 5 players holding xx% market share.
- Technological Innovation: Focus on hybrid and electric vehicles, ADAS, and connected vehicle technologies.
- Regulatory Framework: Stringent emission standards and fuel economy regulations driving adoption of cleaner technologies.
- Competitive Substitutes: Alternative transportation modes (rail, air) pose some level of competition.
- End-User Demographics: Dominated by logistics companies, freight carriers, and delivery services.
- M&A Trends: Consolidation among players to gain market share and technological advantage.
United States Commercial Vehicles Market Growth Trends & Insights
The US commercial vehicle market experienced a CAGR of xx% during 2019-2024. Market growth is projected to be driven by a robust economy, expansion of e-commerce, and infrastructure development. The adoption rate of hybrid and electric commercial vehicles is expected to increase significantly over the forecast period, driven by government incentives and technological advancements. Consumer behavior is shifting towards fuel-efficient and environmentally friendly vehicles. However, the high upfront cost of electric vehicles remains a barrier.
- Market Size Evolution: Market size grew from xx Million units in 2019 to xx Million units in 2024.
- Adoption Rates: Adoption of electric and hybrid vehicles is accelerating, with a projected xx% penetration by 2033.
- Technological Disruptions: Autonomous driving technology and connected vehicle solutions are expected to transform the industry.
- Consumer Behavior Shifts: Increased preference for fuel-efficient and sustainable transportation solutions.
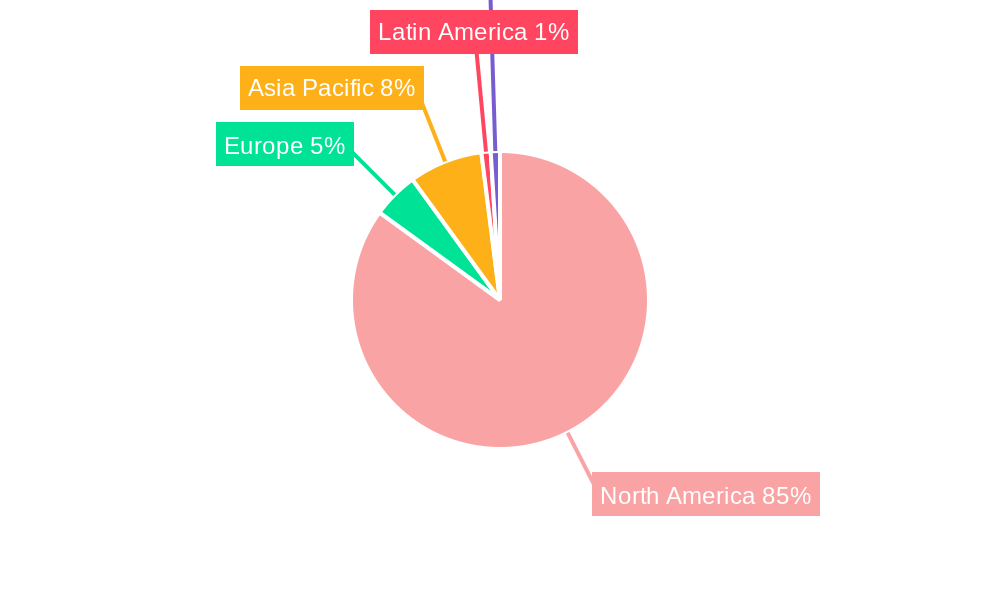
Dominant Regions, Countries, or Segments in United States Commercial Vehicles Market
The Californian region holds the largest market share within the United States Commercial Vehicle Market, followed by Texas and Florida. This dominance is primarily attributed to robust economic activity, strong logistics networks, and a high concentration of major businesses within these regions. The growth of the Hybrid and Electric Vehicles segment is particularly noteworthy, fueled by government incentives, increasing environmental awareness, and technological advancements making these vehicles increasingly cost-competitive. The LPG segment continues to hold a significant share, due to its lower cost compared to gasoline and diesel.
- Key Drivers (California): Strong economy, developed logistics infrastructure, high concentration of businesses.
- Key Drivers (Hybrid & Electric Vehicles): Government incentives, environmental concerns, technological advancements reducing cost and improving performance.
- Key Drivers (LPG): Lower fuel cost compared to gasoline and diesel.
- Market Share: California holds approximately xx% of the US market share, while the Hybrid and Electric Vehicles segment projects xx% market share by 2033.
United States Commercial Vehicles Market Product Landscape
The market offers a diverse range of commercial vehicles, including heavy-duty trucks, light-duty trucks, vans, and buses. Product innovation focuses on improving fuel efficiency, safety features, and driver comfort. Advancements in telematics and connected vehicle technologies are enhancing fleet management and operational efficiency. Unique selling propositions include improved payload capacity, enhanced safety features, and reduced emissions.
Key Drivers, Barriers & Challenges in United States Commercial Vehicles Market
Key Drivers:
- Increasing demand from e-commerce and logistics sectors.
- Government regulations promoting the adoption of cleaner vehicles.
- Technological advancements in fuel efficiency and safety features.
Key Challenges:
- High initial cost of electric and hybrid vehicles.
- Supply chain disruptions impacting production and delivery timelines.
- Competition from established and emerging players. This includes a significant impact on pricing with a projected xx% price decrease in the next 5 years due to increased competition and technology advancements.
Emerging Opportunities in United States Commercial Vehicles Market
- Growth in the last-mile delivery segment.
- Increased demand for autonomous and connected commercial vehicles.
- Expansion of charging infrastructure supporting the adoption of electric vehicles.
Growth Accelerators in the United States Commercial Vehicles Market Industry
Technological breakthroughs in battery technology and charging infrastructure are accelerating the adoption of electric vehicles. Strategic partnerships between vehicle manufacturers and charging infrastructure providers are also crucial for market growth. Expansion into underserved markets and the development of innovative financing options will further fuel market expansion.
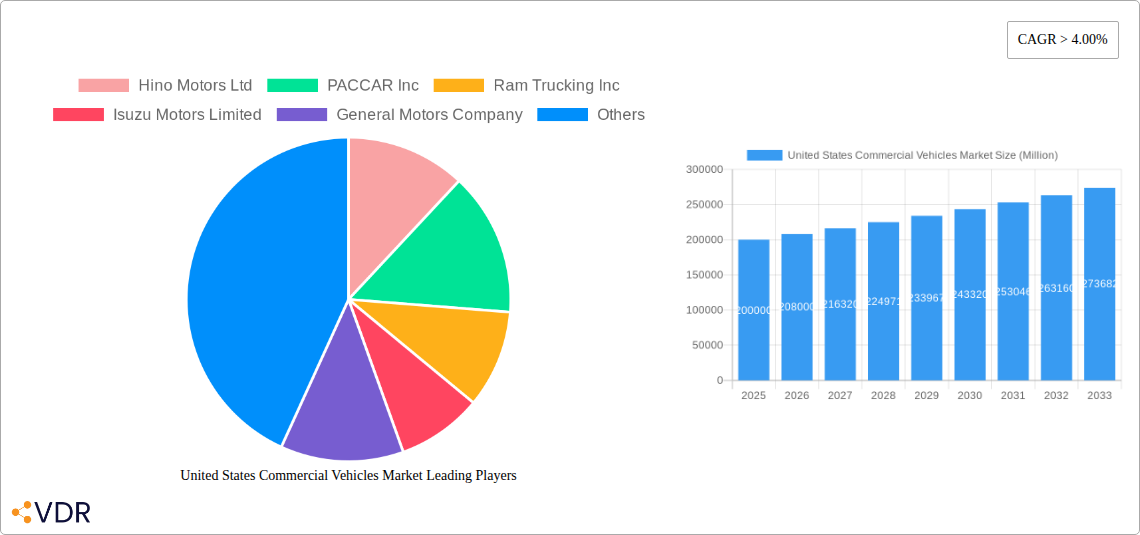
Key Players Shaping the United States Commercial Vehicles Market Market
- Hino Motors Ltd
- PACCAR Inc
- Ram Trucking Inc
- Isuzu Motors Limited
- General Motors Company
- Daimler AG (Mercedes-Benz AG)
- Daimler Truck Holding AG
- Volvo Group
- Toyota Motor Corporation
- Ford Motor Company
Notable Milestones in United States Commercial Vehicles Market Sector
- August 2023: General Motors announces the launch of an all-electric Cadillac Escalade in late 2024. This signals a major commitment to the electric vehicle market.
- August 2023: General Motors reinforces its commitment to electric vehicles in the Middle East. This signifies expansion into new markets.
- August 2023: Toyota Kirloskar Motor launches the all-new MPV Vellfire strong hybrid electric vehicle (SHEV). This demonstrates ongoing innovation in hybrid technology.
In-Depth United States Commercial Vehicles Market Market Outlook
The US commercial vehicle market is poised for significant growth over the next decade. Technological advancements, supportive government policies, and increasing demand from various sectors will drive market expansion. Strategic investments in research and development, innovative business models, and partnerships will be critical for success in this dynamic market. The future potential is significant, particularly in the electric and autonomous vehicle segments.
United States Commercial Vehicles Market Segmentation
-
1. Vehicle Type
-
1.1. Commercial Vehicles
- 1.1.1. Buses
- 1.1.2. Heavy-duty Commercial Trucks
- 1.1.3. Light Commercial Pick-up Trucks
- 1.1.4. Light Commercial Vans
- 1.1.5. Medium-duty Commercial Trucks
-
1.1. Commercial Vehicles
-
2. Propulsion Type
-
2.1. Hybrid and Electric Vehicles
-
2.1.1. By Fuel Category
- 2.1.1.1. BEV
- 2.1.1.2. FCEV
- 2.1.1.3. HEV
- 2.1.1.4. PHEV
-
2.1.1. By Fuel Category
-
2.2. ICE
- 2.2.1. CNG
- 2.2.2. Diesel
- 2.2.3. Gasoline
- 2.2.4. LPG
-
2.1. Hybrid and Electric Vehicles
United States Commercial Vehicles Market Segmentation By Geography
- 1. United States
United States Commercial Vehicles Market REPORT HIGHLIGHTS
| Aspects | Details |
|---|---|
| Study Period | 2019-2033 |
| Base Year | 2024 |
| Estimated Year | 2025 |
| Forecast Period | 2025-2033 |
| Historical Period | 2019-2024 |
| Growth Rate | CAGR of > 4.00% from 2019-2033 |
| Segmentation |
|
Table of Contents
- 1. Introduction
- 1.1. Research Scope
- 1.2. Market Segmentation
- 1.3. Research Methodology
- 1.4. Definitions and Assumptions
- 2. Executive Summary
- 2.1. Introduction
- 3. Market Dynamics
- 3.1. Introduction
- 3.2. Market Drivers
- 3.2.1. Rapid Urbanization and Demand for Convinient Transportation
- 3.3. Market Restrains
- 3.3.1. Traffic Congestion in Major Cities
- 3.4. Market Trends
- 3.4.1. OTHER KEY INDUSTRY TRENDS COVERED IN THE REPORT
- 4. Market Factor Analysis
- 4.1. Porters Five Forces
- 4.2. Supply/Value Chain
- 4.3. PESTEL analysis
- 4.4. Market Entropy
- 4.5. Patent/Trademark Analysis
- 5. United States Commercial Vehicles Market Analysis, Insights and Forecast, 2019-2031
- 5.1. Market Analysis, Insights and Forecast - by Vehicle Type
- 5.1.1. Commercial Vehicles
- 5.1.1.1. Buses
- 5.1.1.2. Heavy-duty Commercial Trucks
- 5.1.1.3. Light Commercial Pick-up Trucks
- 5.1.1.4. Light Commercial Vans
- 5.1.1.5. Medium-duty Commercial Trucks
- 5.1.1. Commercial Vehicles
- 5.2. Market Analysis, Insights and Forecast - by Propulsion Type
- 5.2.1. Hybrid and Electric Vehicles
- 5.2.1.1. By Fuel Category
- 5.2.1.1.1. BEV
- 5.2.1.1.2. FCEV
- 5.2.1.1.3. HEV
- 5.2.1.1.4. PHEV
- 5.2.1.1. By Fuel Category
- 5.2.2. ICE
- 5.2.2.1. CNG
- 5.2.2.2. Diesel
- 5.2.2.3. Gasoline
- 5.2.2.4. LPG
- 5.2.1. Hybrid and Electric Vehicles
- 5.3. Market Analysis, Insights and Forecast - by Region
- 5.3.1. United States
- 5.1. Market Analysis, Insights and Forecast - by Vehicle Type
- 6. North America United States Commercial Vehicles Market Analysis, Insights and Forecast, 2019-2031
- 6.1. Market Analysis, Insights and Forecast - By Country/Sub-region
- 6.1.1 United States
- 6.1.2 Canada
- 6.1.3 Rest of North America
- 7. Europe United States Commercial Vehicles Market Analysis, Insights and Forecast, 2019-2031
- 7.1. Market Analysis, Insights and Forecast - By Country/Sub-region
- 7.1.1 Germany
- 7.1.2 United Kingdom
- 7.1.3 France
- 7.1.4 Russia
- 7.1.5 Spain
- 7.1.6 Rest of Europe
- 8. Asia Pacific United States Commercial Vehicles Market Analysis, Insights and Forecast, 2019-2031
- 8.1. Market Analysis, Insights and Forecast - By Country/Sub-region
- 8.1.1 India
- 8.1.2 China
- 8.1.3 Japan
- 8.1.4 South Korea
- 8.1.5 Australia
- 8.1.6 Rest of Asia Pacific
- 9. Latin America United States Commercial Vehicles Market Analysis, Insights and Forecast, 2019-2031
- 9.1. Market Analysis, Insights and Forecast - By Country/Sub-region
- 9.1.1 Mexico
- 9.1.2 Brazil
- 9.1.3 Argentina
- 9.1.4 Rest Of Latin America
- 10. Middle East and Africa United States Commercial Vehicles Market Analysis, Insights and Forecast, 2019-2031
- 10.1. Market Analysis, Insights and Forecast - By Country/Sub-region
- 10.1.1 United Arab Emirates
- 10.1.2 Saudi Arabia
- 10.1.3 Rest of Middle East and Africa
- 11. Competitive Analysis
- 11.1. Market Share Analysis 2024
- 11.2. Company Profiles
- 11.2.1 Hino Motors Ltd
- 11.2.1.1. Overview
- 11.2.1.2. Products
- 11.2.1.3. SWOT Analysis
- 11.2.1.4. Recent Developments
- 11.2.1.5. Financials (Based on Availability)
- 11.2.2 PACCAR Inc
- 11.2.2.1. Overview
- 11.2.2.2. Products
- 11.2.2.3. SWOT Analysis
- 11.2.2.4. Recent Developments
- 11.2.2.5. Financials (Based on Availability)
- 11.2.3 Ram Trucking Inc
- 11.2.3.1. Overview
- 11.2.3.2. Products
- 11.2.3.3. SWOT Analysis
- 11.2.3.4. Recent Developments
- 11.2.3.5. Financials (Based on Availability)
- 11.2.4 Isuzu Motors Limited
- 11.2.4.1. Overview
- 11.2.4.2. Products
- 11.2.4.3. SWOT Analysis
- 11.2.4.4. Recent Developments
- 11.2.4.5. Financials (Based on Availability)
- 11.2.5 General Motors Company
- 11.2.5.1. Overview
- 11.2.5.2. Products
- 11.2.5.3. SWOT Analysis
- 11.2.5.4. Recent Developments
- 11.2.5.5. Financials (Based on Availability)
- 11.2.6 Daimler AG (Mercedes-Benz AG)
- 11.2.6.1. Overview
- 11.2.6.2. Products
- 11.2.6.3. SWOT Analysis
- 11.2.6.4. Recent Developments
- 11.2.6.5. Financials (Based on Availability)
- 11.2.7 Daimler Truck Holding AG
- 11.2.7.1. Overview
- 11.2.7.2. Products
- 11.2.7.3. SWOT Analysis
- 11.2.7.4. Recent Developments
- 11.2.7.5. Financials (Based on Availability)
- 11.2.8 Volvo Grou
- 11.2.8.1. Overview
- 11.2.8.2. Products
- 11.2.8.3. SWOT Analysis
- 11.2.8.4. Recent Developments
- 11.2.8.5. Financials (Based on Availability)
- 11.2.9 Toyota Motor Corporation
- 11.2.9.1. Overview
- 11.2.9.2. Products
- 11.2.9.3. SWOT Analysis
- 11.2.9.4. Recent Developments
- 11.2.9.5. Financials (Based on Availability)
- 11.2.10 Ford Motor Company
- 11.2.10.1. Overview
- 11.2.10.2. Products
- 11.2.10.3. SWOT Analysis
- 11.2.10.4. Recent Developments
- 11.2.10.5. Financials (Based on Availability)
- 11.2.1 Hino Motors Ltd
List of Figures
- Figure 1: United States Commercial Vehicles Market Revenue Breakdown (Million, %) by Product 2024 & 2032
- Figure 2: United States Commercial Vehicles Market Share (%) by Company 2024
List of Tables
- Table 1: United States Commercial Vehicles Market Revenue Million Forecast, by Region 2019 & 2032
- Table 2: United States Commercial Vehicles Market Revenue Million Forecast, by Vehicle Type 2019 & 2032
- Table 3: United States Commercial Vehicles Market Revenue Million Forecast, by Propulsion Type 2019 & 2032
- Table 4: United States Commercial Vehicles Market Revenue Million Forecast, by Region 2019 & 2032
- Table 5: United States Commercial Vehicles Market Revenue Million Forecast, by Country 2019 & 2032
- Table 6: United States United States Commercial Vehicles Market Revenue (Million) Forecast, by Application 2019 & 2032
- Table 7: Canada United States Commercial Vehicles Market Revenue (Million) Forecast, by Application 2019 & 2032
- Table 8: Rest of North America United States Commercial Vehicles Market Revenue (Million) Forecast, by Application 2019 & 2032
- Table 9: United States Commercial Vehicles Market Revenue Million Forecast, by Country 2019 & 2032
- Table 10: Germany United States Commercial Vehicles Market Revenue (Million) Forecast, by Application 2019 & 2032
- Table 11: United Kingdom United States Commercial Vehicles Market Revenue (Million) Forecast, by Application 2019 & 2032
- Table 12: France United States Commercial Vehicles Market Revenue (Million) Forecast, by Application 2019 & 2032
- Table 13: Russia United States Commercial Vehicles Market Revenue (Million) Forecast, by Application 2019 & 2032
- Table 14: Spain United States Commercial Vehicles Market Revenue (Million) Forecast, by Application 2019 & 2032
- Table 15: Rest of Europe United States Commercial Vehicles Market Revenue (Million) Forecast, by Application 2019 & 2032
- Table 16: United States Commercial Vehicles Market Revenue Million Forecast, by Country 2019 & 2032
- Table 17: India United States Commercial Vehicles Market Revenue (Million) Forecast, by Application 2019 & 2032
- Table 18: China United States Commercial Vehicles Market Revenue (Million) Forecast, by Application 2019 & 2032
- Table 19: Japan United States Commercial Vehicles Market Revenue (Million) Forecast, by Application 2019 & 2032
- Table 20: South Korea United States Commercial Vehicles Market Revenue (Million) Forecast, by Application 2019 & 2032
- Table 21: Australia United States Commercial Vehicles Market Revenue (Million) Forecast, by Application 2019 & 2032
- Table 22: Rest of Asia Pacific United States Commercial Vehicles Market Revenue (Million) Forecast, by Application 2019 & 2032
- Table 23: United States Commercial Vehicles Market Revenue Million Forecast, by Country 2019 & 2032
- Table 24: Mexico United States Commercial Vehicles Market Revenue (Million) Forecast, by Application 2019 & 2032
- Table 25: Brazil United States Commercial Vehicles Market Revenue (Million) Forecast, by Application 2019 & 2032
- Table 26: Argentina United States Commercial Vehicles Market Revenue (Million) Forecast, by Application 2019 & 2032
- Table 27: Rest Of Latin America United States Commercial Vehicles Market Revenue (Million) Forecast, by Application 2019 & 2032
- Table 28: United States Commercial Vehicles Market Revenue Million Forecast, by Country 2019 & 2032
- Table 29: United Arab Emirates United States Commercial Vehicles Market Revenue (Million) Forecast, by Application 2019 & 2032
- Table 30: Saudi Arabia United States Commercial Vehicles Market Revenue (Million) Forecast, by Application 2019 & 2032
- Table 31: Rest of Middle East and Africa United States Commercial Vehicles Market Revenue (Million) Forecast, by Application 2019 & 2032
- Table 32: United States Commercial Vehicles Market Revenue Million Forecast, by Vehicle Type 2019 & 2032
- Table 33: United States Commercial Vehicles Market Revenue Million Forecast, by Propulsion Type 2019 & 2032
- Table 34: United States Commercial Vehicles Market Revenue Million Forecast, by Country 2019 & 2032
Frequently Asked Questions
1. What is the projected Compound Annual Growth Rate (CAGR) of the United States Commercial Vehicles Market?
The projected CAGR is approximately > 4.00%.
2. Which companies are prominent players in the United States Commercial Vehicles Market?
Key companies in the market include Hino Motors Ltd, PACCAR Inc, Ram Trucking Inc, Isuzu Motors Limited, General Motors Company, Daimler AG (Mercedes-Benz AG), Daimler Truck Holding AG, Volvo Grou, Toyota Motor Corporation, Ford Motor Company.
3. What are the main segments of the United States Commercial Vehicles Market?
The market segments include Vehicle Type, Propulsion Type.
4. Can you provide details about the market size?
The market size is estimated to be USD XX Million as of 2022.
5. What are some drivers contributing to market growth?
Rapid Urbanization and Demand for Convinient Transportation.
6. What are the notable trends driving market growth?
OTHER KEY INDUSTRY TRENDS COVERED IN THE REPORT.
7. Are there any restraints impacting market growth?
Traffic Congestion in Major Cities.
8. Can you provide examples of recent developments in the market?
August 2023: General Motors will launch an all-electric Cadillac Escalade in late 2024August 2023: General Motors doubles down on plans for an electric future in the Middle East.August 2023: Toyota Kirloskar Motor launched the all-new MPV Vellfire strong hybrid electric vehicle (SHEV) for a starting price of INR 11.99 million and going to INR 12.99 million.
9. What pricing options are available for accessing the report?
Pricing options include single-user, multi-user, and enterprise licenses priced at USD 3800, USD 4500, and USD 5800 respectively.
10. Is the market size provided in terms of value or volume?
The market size is provided in terms of value, measured in Million.
11. Are there any specific market keywords associated with the report?
Yes, the market keyword associated with the report is "United States Commercial Vehicles Market," which aids in identifying and referencing the specific market segment covered.
12. How do I determine which pricing option suits my needs best?
The pricing options vary based on user requirements and access needs. Individual users may opt for single-user licenses, while businesses requiring broader access may choose multi-user or enterprise licenses for cost-effective access to the report.
13. Are there any additional resources or data provided in the United States Commercial Vehicles Market report?
While the report offers comprehensive insights, it's advisable to review the specific contents or supplementary materials provided to ascertain if additional resources or data are available.
14. How can I stay updated on further developments or reports in the United States Commercial Vehicles Market?
To stay informed about further developments, trends, and reports in the United States Commercial Vehicles Market, consider subscribing to industry newsletters, following relevant companies and organizations, or regularly checking reputable industry news sources and publications.
Methodology
Step 1 - Identification of Relevant Samples Size from Population Database


Step 2 - Approaches for Defining Global Market Size (Value, Volume* & Price*)

Note*: In applicable scenarios
Step 3 - Data Sources
Primary Research
- Web Analytics
- Survey Reports
- Research Institute
- Latest Research Reports
- Opinion Leaders
Secondary Research
- Annual Reports
- White Paper
- Latest Press Release
- Industry Association
- Paid Database
- Investor Presentations

Step 4 - Data Triangulation
Involves using different sources of information in order to increase the validity of a study
These sources are likely to be stakeholders in a program - participants, other researchers, program staff, other community members, and so on.
Then we put all data in single framework & apply various statistical tools to find out the dynamic on the market.
During the analysis stage, feedback from the stakeholder groups would be compared to determine areas of agreement as well as areas of divergence


