
Key Insights
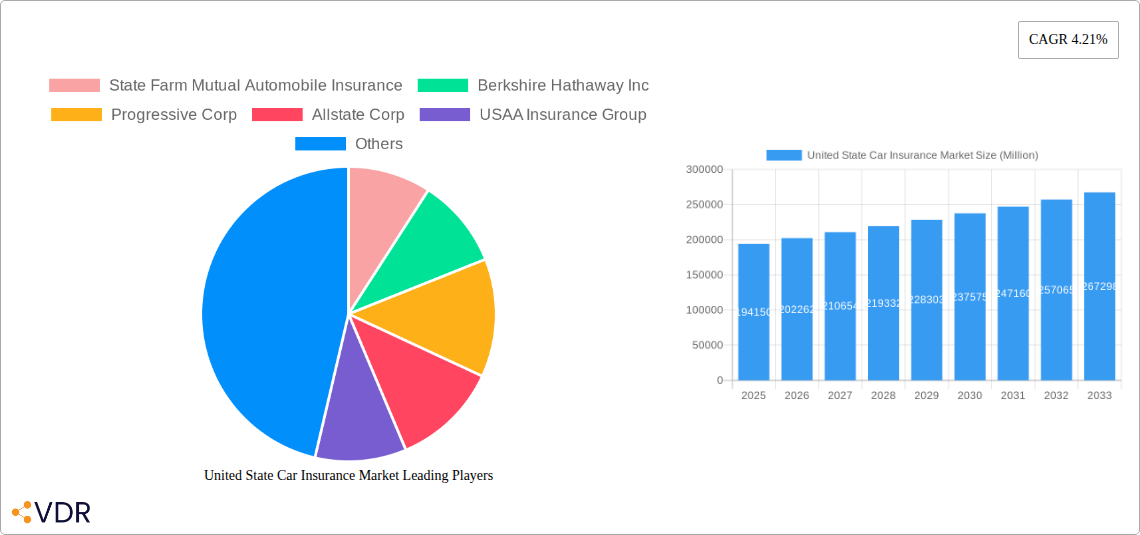
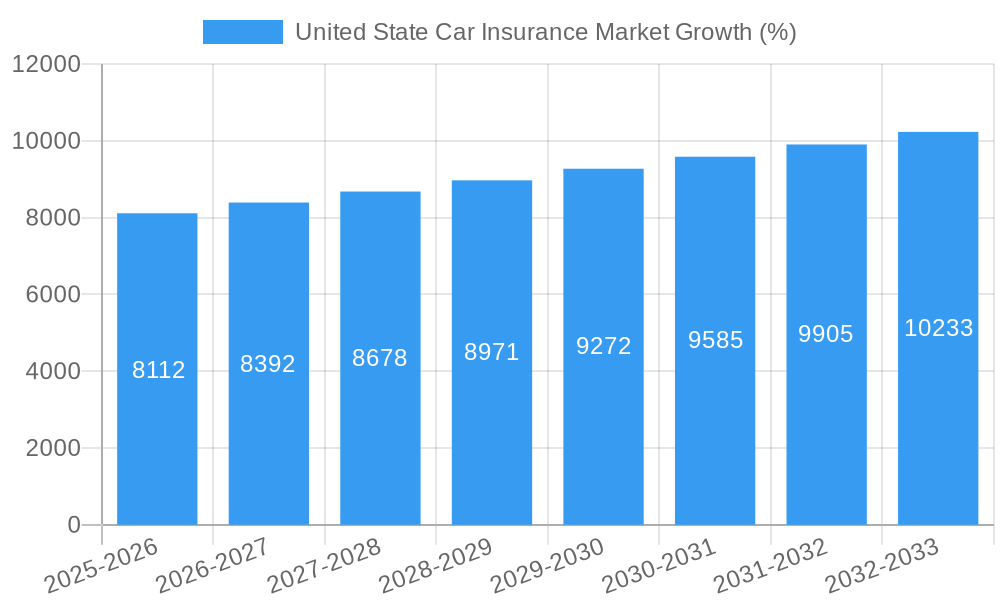
The United States car insurance market, valued at $194.15 billion in 2025, is projected to experience steady growth, driven by factors such as increasing vehicle ownership, a rising population, and stricter regulations mandating higher insurance coverage. The market's Compound Annual Growth Rate (CAGR) of 4.21% from 2019 to 2025 indicates consistent expansion, and this growth is expected to continue throughout the forecast period (2025-2033). Key growth drivers include the increasing adoption of telematics and usage-based insurance, offering personalized premiums and safety features. Technological advancements are streamlining claims processing and improving customer service, further bolstering market expansion. However, factors like economic downturns potentially impacting consumer spending on insurance and increasing competition among established players could act as restraints. The market is segmented by various factors, including coverage type (liability, collision, comprehensive), vehicle type, and customer demographics (age, location). Major players like State Farm, Berkshire Hathaway, Progressive, Allstate, and USAA dominate the market landscape, leveraging their extensive distribution networks and brand recognition.
The competitive landscape is characterized by a mix of large, established insurers and smaller, niche players. These companies continuously strive to innovate and offer competitive pricing strategies, loyalty programs, and bundled services to attract and retain customers. Regional variations in insurance rates and regulatory environments contribute to the market's complexity. Future growth will be influenced by evolving consumer preferences, technological innovation, and changes in the regulatory landscape, creating opportunities for agile insurers capable of adapting to changing market dynamics. The market is expected to see a further increase in digitalization, with more customers opting for online quotes and policy management. Increased awareness of the importance of adequate insurance coverage also plays a crucial role in driving market growth.
United States Car Insurance Market: A Comprehensive Report (2019-2033)
This comprehensive report provides an in-depth analysis of the United States car insurance market, encompassing market dynamics, growth trends, regional segmentation, product landscape, key players, and future outlook. With a study period spanning 2019-2033, a base year of 2025, and a forecast period of 2025-2033, this report is an indispensable resource for industry professionals, investors, and strategic decision-makers. The report covers the parent market of the insurance sector and the child market of car insurance within the US. Market values are presented in million units.
United States Car Insurance Market Dynamics & Structure
The US car insurance market is a highly competitive landscape characterized by a concentrated structure with a few dominant players. State Farm Mutual Automobile Insurance, Berkshire Hathaway Inc. (through Geico), Progressive Corp, Allstate Corp, USAA Insurance Group, Liberty Mutual, Farmers Insurance Group of Companies, Nationwide Mutual Group, American Family Insurance Group, and Travelers Companies Inc. are key players; however, this list is not exhaustive. The market's dynamics are shaped by several factors, including technological innovation, increasingly stringent regulatory frameworks, the availability of competitive product substitutes, evolving end-user demographics, and a moderate level of M&A activity.
- Market Concentration: The top 10 insurers hold approximately xx% of the market share in 2025, indicating a moderately concentrated market.
- Technological Innovation: The increasing adoption of telematics, AI-powered claims processing, and digital distribution channels is driving significant change. However, data privacy concerns and the cost of implementation pose barriers to innovation.
- Regulatory Framework: State-level regulations significantly impact pricing, product offerings, and operational procedures, creating a complex regulatory environment.
- Competitive Substitutes: The market faces competition from alternative risk transfer mechanisms, such as self-insurance for high-net-worth individuals.
- End-User Demographics: Changing demographics, such as the increasing number of young drivers and older drivers, influence risk profiles and insurance needs.
- M&A Trends: The number of M&A deals in the sector has been relatively moderate in recent years, with approximately xx deals completed between 2019 and 2024, averaging a value of xx million USD per deal.
United States Car Insurance Market Growth Trends & Insights
The US car insurance market exhibited a CAGR of xx% during the historical period (2019-2024), reaching a market size of xx million in 2024. This growth is attributable to several factors, including rising vehicle ownership, increasing urbanization, and a growing middle class. However, factors such as economic downturns and fluctuations in fuel prices can impact market growth. Technological disruptions, such as the increasing adoption of autonomous vehicles, present both opportunities and challenges. Consumer behavior is shifting towards digital channels for purchasing and managing insurance policies, necessitating adaptation by insurers. Market penetration for comprehensive car insurance is estimated to be approximately xx% in 2025, with expected growth driven by increased awareness of the benefits of comprehensive coverage. The forecast period (2025-2033) projects continued growth, with a projected CAGR of xx% and a market size of xx million by 2033.
Dominant Regions, Countries, or Segments in United States Car Insurance Market
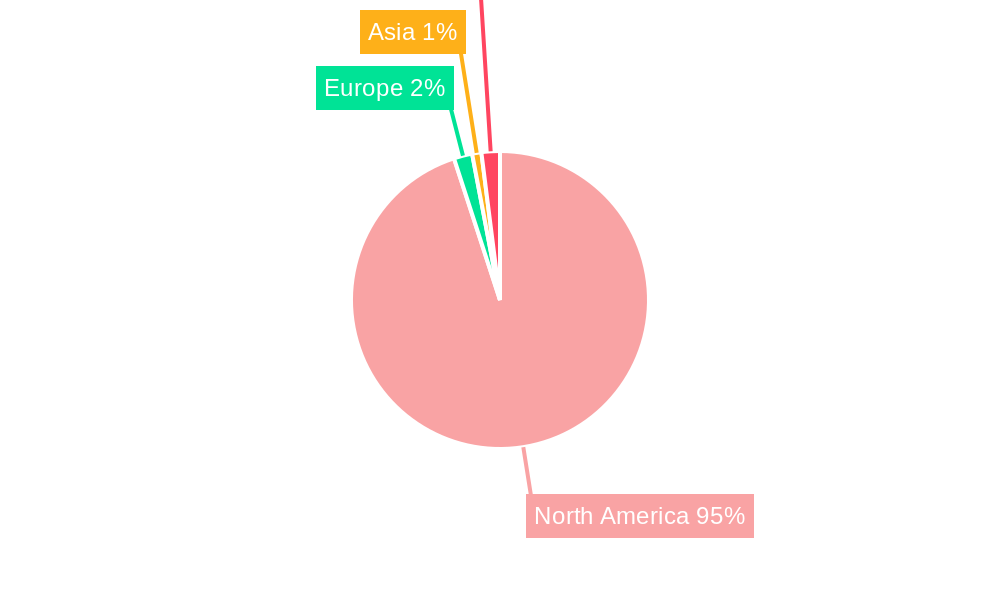
The US car insurance market is largely dominated by the states with the largest populations and highest vehicle ownership rates, such as California, Texas, Florida, and New York. These states exhibit higher demand due to factors such as larger populations, greater numbers of vehicles, and higher accident rates.
- California: Dominant due to its high population density and robust economy.
- Texas: High vehicle ownership and relatively favorable regulatory environment contribute to market dominance.
- Florida: Large population and a high number of tourists generate significant demand.
- New York: Dense population and strict regulatory environment.
These regions are experiencing strong growth driven by factors like economic development, infrastructure improvement, and an expanding middle class increasing vehicle ownership. Growth potential in these regions is still significant, although competition is intense. Other states show similar trends, with variations in growth rates driven by local regulatory frameworks and economic conditions.
United States Car Insurance Market Product Landscape
The US car insurance market offers a range of products, including liability, collision, comprehensive, and uninsured/underinsured motorist coverage. Innovations include telematics-based usage-based insurance (UBI) programs that offer personalized premiums based on driving behavior, and AI-powered claims processing that speeds up settlement times. These innovations offer unique selling propositions such as lower premiums for safe drivers (UBI) and faster claims resolution (AI). Technological advancements focus on improving customer experience, reducing processing times, and mitigating risk through data analytics.
Key Drivers, Barriers & Challenges in United States Car Insurance Market
Key Drivers:
- Increasing vehicle ownership and urbanization.
- Growing awareness of the importance of car insurance.
- Technological advancements, such as telematics and AI.
- Favorable regulatory frameworks in certain states.
Key Challenges & Restraints:
- Intense competition among established players.
- Rising claims costs due to increased repair expenses and litigation.
- Economic downturns impacting consumer spending on insurance.
- Regulatory changes and complexities at the state level.
- Data security and privacy concerns associated with telematics.
Emerging Opportunities in United States Car Insurance Market
- Expansion into underserved markets, such as rural areas.
- Development of innovative insurance products, such as those tailored to autonomous vehicles.
- Increased adoption of digital channels for distribution and customer service.
- Leveraging big data analytics for risk assessment and fraud detection.
Growth Accelerators in the United States Car Insurance Market Industry
Long-term growth in the US car insurance market will be fueled by technological breakthroughs in areas like autonomous driving and predictive analytics, allowing for more accurate risk assessment and personalized pricing. Strategic partnerships between insurers and technology companies will also play a key role in driving innovation and market expansion. Aggressive marketing and expansion into niche markets will further contribute to long-term growth.
Key Players Shaping the United States Car Insurance Market Market
- State Farm Mutual Automobile Insurance
- Berkshire Hathaway Inc.
- Progressive Corp
- Allstate Corp
- USAA Insurance Group
- Liberty Mutual
- Farmers Insurance Group of Companies
- Nationwide Mutual Group
- American Family Insurance Group
- Travelers Companies Inc
- (List Not Exhaustive)
Notable Milestones in United States Car Insurance Market Sector
- August 2023: AXA S.A. launched STeP, a new digital claims solution, streamlining the car insurance process and potentially increasing customer satisfaction.
- May 2022: GEICO partnered with Tractable, integrating AI for faster and more efficient car damage assessment in claims processing, leading to quicker settlements and potentially reduced operational costs.
In-Depth United States Car Insurance Market Market Outlook
The US car insurance market is poised for continued growth in the coming years, driven by factors such as technological advancements, changing consumer preferences, and strategic partnerships. Opportunities exist for insurers to leverage data analytics, personalize offerings, and expand into new markets. Insurers who can adapt to the evolving technological landscape and meet the needs of a digitally-savvy customer base will be best positioned for success. The market's long-term potential is substantial, presenting significant opportunities for both established players and new entrants.
United State Car Insurance Market Segmentation
-
1. Coverage
- 1.1. Third-Party Liability Coverage
- 1.2. Collision/Comprehensive/Other Optional Coverage
-
2. Application
- 2.1. Personal Vehicles
- 2.2. Commercial Vehicles
-
3. Distribution Channel
- 3.1. Agents
- 3.2. Banks
- 3.3. Brokers
- 3.4. Other Distribution Channel
United State Car Insurance Market Segmentation By Geography
-
1. North America
- 1.1. United States
- 1.2. Canada
- 1.3. Mexico
-
2. South America
- 2.1. Brazil
- 2.2. Argentina
- 2.3. Rest of South America
-
3. Europe
- 3.1. United Kingdom
- 3.2. Germany
- 3.3. France
- 3.4. Italy
- 3.5. Spain
- 3.6. Russia
- 3.7. Benelux
- 3.8. Nordics
- 3.9. Rest of Europe
-
4. Middle East & Africa
- 4.1. Turkey
- 4.2. Israel
- 4.3. GCC
- 4.4. North Africa
- 4.5. South Africa
- 4.6. Rest of Middle East & Africa
-
5. Asia Pacific
- 5.1. China
- 5.2. India
- 5.3. Japan
- 5.4. South Korea
- 5.5. ASEAN
- 5.6. Oceania
- 5.7. Rest of Asia Pacific
United State Car Insurance Market REPORT HIGHLIGHTS
| Aspects | Details |
|---|---|
| Study Period | 2019-2033 |
| Base Year | 2024 |
| Estimated Year | 2025 |
| Forecast Period | 2025-2033 |
| Historical Period | 2019-2024 |
| Growth Rate | CAGR of 4.21% from 2019-2033 |
| Segmentation |
|
Table of Contents
- 1. Introduction
- 1.1. Research Scope
- 1.2. Market Segmentation
- 1.3. Research Methodology
- 1.4. Definitions and Assumptions
- 2. Executive Summary
- 2.1. Introduction
- 3. Market Dynamics
- 3.1. Introduction
- 3.2. Market Drivers
- 3.2.1. Rising Number of Accidents Drives The Market; An increase in Road Traffic Accidents Drives The Market
- 3.3. Market Restrains
- 3.3.1. Rising Number of Accidents Drives The Market; An increase in Road Traffic Accidents Drives The Market
- 3.4. Market Trends
- 3.4.1. Rise In Number Of Traffic Accidents
- 4. Market Factor Analysis
- 4.1. Porters Five Forces
- 4.2. Supply/Value Chain
- 4.3. PESTEL analysis
- 4.4. Market Entropy
- 4.5. Patent/Trademark Analysis
- 5. Global United State Car Insurance Market Analysis, Insights and Forecast, 2019-2031
- 5.1. Market Analysis, Insights and Forecast - by Coverage
- 5.1.1. Third-Party Liability Coverage
- 5.1.2. Collision/Comprehensive/Other Optional Coverage
- 5.2. Market Analysis, Insights and Forecast - by Application
- 5.2.1. Personal Vehicles
- 5.2.2. Commercial Vehicles
- 5.3. Market Analysis, Insights and Forecast - by Distribution Channel
- 5.3.1. Agents
- 5.3.2. Banks
- 5.3.3. Brokers
- 5.3.4. Other Distribution Channel
- 5.4. Market Analysis, Insights and Forecast - by Region
- 5.4.1. North America
- 5.4.2. South America
- 5.4.3. Europe
- 5.4.4. Middle East & Africa
- 5.4.5. Asia Pacific
- 5.1. Market Analysis, Insights and Forecast - by Coverage
- 6. North America United State Car Insurance Market Analysis, Insights and Forecast, 2019-2031
- 6.1. Market Analysis, Insights and Forecast - by Coverage
- 6.1.1. Third-Party Liability Coverage
- 6.1.2. Collision/Comprehensive/Other Optional Coverage
- 6.2. Market Analysis, Insights and Forecast - by Application
- 6.2.1. Personal Vehicles
- 6.2.2. Commercial Vehicles
- 6.3. Market Analysis, Insights and Forecast - by Distribution Channel
- 6.3.1. Agents
- 6.3.2. Banks
- 6.3.3. Brokers
- 6.3.4. Other Distribution Channel
- 6.1. Market Analysis, Insights and Forecast - by Coverage
- 7. South America United State Car Insurance Market Analysis, Insights and Forecast, 2019-2031
- 7.1. Market Analysis, Insights and Forecast - by Coverage
- 7.1.1. Third-Party Liability Coverage
- 7.1.2. Collision/Comprehensive/Other Optional Coverage
- 7.2. Market Analysis, Insights and Forecast - by Application
- 7.2.1. Personal Vehicles
- 7.2.2. Commercial Vehicles
- 7.3. Market Analysis, Insights and Forecast - by Distribution Channel
- 7.3.1. Agents
- 7.3.2. Banks
- 7.3.3. Brokers
- 7.3.4. Other Distribution Channel
- 7.1. Market Analysis, Insights and Forecast - by Coverage
- 8. Europe United State Car Insurance Market Analysis, Insights and Forecast, 2019-2031
- 8.1. Market Analysis, Insights and Forecast - by Coverage
- 8.1.1. Third-Party Liability Coverage
- 8.1.2. Collision/Comprehensive/Other Optional Coverage
- 8.2. Market Analysis, Insights and Forecast - by Application
- 8.2.1. Personal Vehicles
- 8.2.2. Commercial Vehicles
- 8.3. Market Analysis, Insights and Forecast - by Distribution Channel
- 8.3.1. Agents
- 8.3.2. Banks
- 8.3.3. Brokers
- 8.3.4. Other Distribution Channel
- 8.1. Market Analysis, Insights and Forecast - by Coverage
- 9. Middle East & Africa United State Car Insurance Market Analysis, Insights and Forecast, 2019-2031
- 9.1. Market Analysis, Insights and Forecast - by Coverage
- 9.1.1. Third-Party Liability Coverage
- 9.1.2. Collision/Comprehensive/Other Optional Coverage
- 9.2. Market Analysis, Insights and Forecast - by Application
- 9.2.1. Personal Vehicles
- 9.2.2. Commercial Vehicles
- 9.3. Market Analysis, Insights and Forecast - by Distribution Channel
- 9.3.1. Agents
- 9.3.2. Banks
- 9.3.3. Brokers
- 9.3.4. Other Distribution Channel
- 9.1. Market Analysis, Insights and Forecast - by Coverage
- 10. Asia Pacific United State Car Insurance Market Analysis, Insights and Forecast, 2019-2031
- 10.1. Market Analysis, Insights and Forecast - by Coverage
- 10.1.1. Third-Party Liability Coverage
- 10.1.2. Collision/Comprehensive/Other Optional Coverage
- 10.2. Market Analysis, Insights and Forecast - by Application
- 10.2.1. Personal Vehicles
- 10.2.2. Commercial Vehicles
- 10.3. Market Analysis, Insights and Forecast - by Distribution Channel
- 10.3.1. Agents
- 10.3.2. Banks
- 10.3.3. Brokers
- 10.3.4. Other Distribution Channel
- 10.1. Market Analysis, Insights and Forecast - by Coverage
- 11. Competitive Analysis
- 11.1. Global Market Share Analysis 2024
- 11.2. Company Profiles
- 11.2.1 State Farm Mutual Automobile Insurance
- 11.2.1.1. Overview
- 11.2.1.2. Products
- 11.2.1.3. SWOT Analysis
- 11.2.1.4. Recent Developments
- 11.2.1.5. Financials (Based on Availability)
- 11.2.2 Berkshire Hathaway Inc
- 11.2.2.1. Overview
- 11.2.2.2. Products
- 11.2.2.3. SWOT Analysis
- 11.2.2.4. Recent Developments
- 11.2.2.5. Financials (Based on Availability)
- 11.2.3 Progressive Corp
- 11.2.3.1. Overview
- 11.2.3.2. Products
- 11.2.3.3. SWOT Analysis
- 11.2.3.4. Recent Developments
- 11.2.3.5. Financials (Based on Availability)
- 11.2.4 Allstate Corp
- 11.2.4.1. Overview
- 11.2.4.2. Products
- 11.2.4.3. SWOT Analysis
- 11.2.4.4. Recent Developments
- 11.2.4.5. Financials (Based on Availability)
- 11.2.5 USAA Insurance Group
- 11.2.5.1. Overview
- 11.2.5.2. Products
- 11.2.5.3. SWOT Analysis
- 11.2.5.4. Recent Developments
- 11.2.5.5. Financials (Based on Availability)
- 11.2.6 Liberty Mutual
- 11.2.6.1. Overview
- 11.2.6.2. Products
- 11.2.6.3. SWOT Analysis
- 11.2.6.4. Recent Developments
- 11.2.6.5. Financials (Based on Availability)
- 11.2.7 Farmers Insurance Group of Companies
- 11.2.7.1. Overview
- 11.2.7.2. Products
- 11.2.7.3. SWOT Analysis
- 11.2.7.4. Recent Developments
- 11.2.7.5. Financials (Based on Availability)
- 11.2.8 Nationwide Mutual Group
- 11.2.8.1. Overview
- 11.2.8.2. Products
- 11.2.8.3. SWOT Analysis
- 11.2.8.4. Recent Developments
- 11.2.8.5. Financials (Based on Availability)
- 11.2.9 American Family Insurance Group
- 11.2.9.1. Overview
- 11.2.9.2. Products
- 11.2.9.3. SWOT Analysis
- 11.2.9.4. Recent Developments
- 11.2.9.5. Financials (Based on Availability)
- 11.2.10 Travelers Companies Inc **List Not Exhaustive
- 11.2.10.1. Overview
- 11.2.10.2. Products
- 11.2.10.3. SWOT Analysis
- 11.2.10.4. Recent Developments
- 11.2.10.5. Financials (Based on Availability)
- 11.2.1 State Farm Mutual Automobile Insurance
List of Figures
- Figure 1: Global United State Car Insurance Market Revenue Breakdown (Million, %) by Region 2024 & 2032
- Figure 2: Global United State Car Insurance Market Volume Breakdown (Billion, %) by Region 2024 & 2032
- Figure 3: North America United State Car Insurance Market Revenue (Million), by Coverage 2024 & 2032
- Figure 4: North America United State Car Insurance Market Volume (Billion), by Coverage 2024 & 2032
- Figure 5: North America United State Car Insurance Market Revenue Share (%), by Coverage 2024 & 2032
- Figure 6: North America United State Car Insurance Market Volume Share (%), by Coverage 2024 & 2032
- Figure 7: North America United State Car Insurance Market Revenue (Million), by Application 2024 & 2032
- Figure 8: North America United State Car Insurance Market Volume (Billion), by Application 2024 & 2032
- Figure 9: North America United State Car Insurance Market Revenue Share (%), by Application 2024 & 2032
- Figure 10: North America United State Car Insurance Market Volume Share (%), by Application 2024 & 2032
- Figure 11: North America United State Car Insurance Market Revenue (Million), by Distribution Channel 2024 & 2032
- Figure 12: North America United State Car Insurance Market Volume (Billion), by Distribution Channel 2024 & 2032
- Figure 13: North America United State Car Insurance Market Revenue Share (%), by Distribution Channel 2024 & 2032
- Figure 14: North America United State Car Insurance Market Volume Share (%), by Distribution Channel 2024 & 2032
- Figure 15: North America United State Car Insurance Market Revenue (Million), by Country 2024 & 2032
- Figure 16: North America United State Car Insurance Market Volume (Billion), by Country 2024 & 2032
- Figure 17: North America United State Car Insurance Market Revenue Share (%), by Country 2024 & 2032
- Figure 18: North America United State Car Insurance Market Volume Share (%), by Country 2024 & 2032
- Figure 19: South America United State Car Insurance Market Revenue (Million), by Coverage 2024 & 2032
- Figure 20: South America United State Car Insurance Market Volume (Billion), by Coverage 2024 & 2032
- Figure 21: South America United State Car Insurance Market Revenue Share (%), by Coverage 2024 & 2032
- Figure 22: South America United State Car Insurance Market Volume Share (%), by Coverage 2024 & 2032
- Figure 23: South America United State Car Insurance Market Revenue (Million), by Application 2024 & 2032
- Figure 24: South America United State Car Insurance Market Volume (Billion), by Application 2024 & 2032
- Figure 25: South America United State Car Insurance Market Revenue Share (%), by Application 2024 & 2032
- Figure 26: South America United State Car Insurance Market Volume Share (%), by Application 2024 & 2032
- Figure 27: South America United State Car Insurance Market Revenue (Million), by Distribution Channel 2024 & 2032
- Figure 28: South America United State Car Insurance Market Volume (Billion), by Distribution Channel 2024 & 2032
- Figure 29: South America United State Car Insurance Market Revenue Share (%), by Distribution Channel 2024 & 2032
- Figure 30: South America United State Car Insurance Market Volume Share (%), by Distribution Channel 2024 & 2032
- Figure 31: South America United State Car Insurance Market Revenue (Million), by Country 2024 & 2032
- Figure 32: South America United State Car Insurance Market Volume (Billion), by Country 2024 & 2032
- Figure 33: South America United State Car Insurance Market Revenue Share (%), by Country 2024 & 2032
- Figure 34: South America United State Car Insurance Market Volume Share (%), by Country 2024 & 2032
- Figure 35: Europe United State Car Insurance Market Revenue (Million), by Coverage 2024 & 2032
- Figure 36: Europe United State Car Insurance Market Volume (Billion), by Coverage 2024 & 2032
- Figure 37: Europe United State Car Insurance Market Revenue Share (%), by Coverage 2024 & 2032
- Figure 38: Europe United State Car Insurance Market Volume Share (%), by Coverage 2024 & 2032
- Figure 39: Europe United State Car Insurance Market Revenue (Million), by Application 2024 & 2032
- Figure 40: Europe United State Car Insurance Market Volume (Billion), by Application 2024 & 2032
- Figure 41: Europe United State Car Insurance Market Revenue Share (%), by Application 2024 & 2032
- Figure 42: Europe United State Car Insurance Market Volume Share (%), by Application 2024 & 2032
- Figure 43: Europe United State Car Insurance Market Revenue (Million), by Distribution Channel 2024 & 2032
- Figure 44: Europe United State Car Insurance Market Volume (Billion), by Distribution Channel 2024 & 2032
- Figure 45: Europe United State Car Insurance Market Revenue Share (%), by Distribution Channel 2024 & 2032
- Figure 46: Europe United State Car Insurance Market Volume Share (%), by Distribution Channel 2024 & 2032
- Figure 47: Europe United State Car Insurance Market Revenue (Million), by Country 2024 & 2032
- Figure 48: Europe United State Car Insurance Market Volume (Billion), by Country 2024 & 2032
- Figure 49: Europe United State Car Insurance Market Revenue Share (%), by Country 2024 & 2032
- Figure 50: Europe United State Car Insurance Market Volume Share (%), by Country 2024 & 2032
- Figure 51: Middle East & Africa United State Car Insurance Market Revenue (Million), by Coverage 2024 & 2032
- Figure 52: Middle East & Africa United State Car Insurance Market Volume (Billion), by Coverage 2024 & 2032
- Figure 53: Middle East & Africa United State Car Insurance Market Revenue Share (%), by Coverage 2024 & 2032
- Figure 54: Middle East & Africa United State Car Insurance Market Volume Share (%), by Coverage 2024 & 2032
- Figure 55: Middle East & Africa United State Car Insurance Market Revenue (Million), by Application 2024 & 2032
- Figure 56: Middle East & Africa United State Car Insurance Market Volume (Billion), by Application 2024 & 2032
- Figure 57: Middle East & Africa United State Car Insurance Market Revenue Share (%), by Application 2024 & 2032
- Figure 58: Middle East & Africa United State Car Insurance Market Volume Share (%), by Application 2024 & 2032
- Figure 59: Middle East & Africa United State Car Insurance Market Revenue (Million), by Distribution Channel 2024 & 2032
- Figure 60: Middle East & Africa United State Car Insurance Market Volume (Billion), by Distribution Channel 2024 & 2032
- Figure 61: Middle East & Africa United State Car Insurance Market Revenue Share (%), by Distribution Channel 2024 & 2032
- Figure 62: Middle East & Africa United State Car Insurance Market Volume Share (%), by Distribution Channel 2024 & 2032
- Figure 63: Middle East & Africa United State Car Insurance Market Revenue (Million), by Country 2024 & 2032
- Figure 64: Middle East & Africa United State Car Insurance Market Volume (Billion), by Country 2024 & 2032
- Figure 65: Middle East & Africa United State Car Insurance Market Revenue Share (%), by Country 2024 & 2032
- Figure 66: Middle East & Africa United State Car Insurance Market Volume Share (%), by Country 2024 & 2032
- Figure 67: Asia Pacific United State Car Insurance Market Revenue (Million), by Coverage 2024 & 2032
- Figure 68: Asia Pacific United State Car Insurance Market Volume (Billion), by Coverage 2024 & 2032
- Figure 69: Asia Pacific United State Car Insurance Market Revenue Share (%), by Coverage 2024 & 2032
- Figure 70: Asia Pacific United State Car Insurance Market Volume Share (%), by Coverage 2024 & 2032
- Figure 71: Asia Pacific United State Car Insurance Market Revenue (Million), by Application 2024 & 2032
- Figure 72: Asia Pacific United State Car Insurance Market Volume (Billion), by Application 2024 & 2032
- Figure 73: Asia Pacific United State Car Insurance Market Revenue Share (%), by Application 2024 & 2032
- Figure 74: Asia Pacific United State Car Insurance Market Volume Share (%), by Application 2024 & 2032
- Figure 75: Asia Pacific United State Car Insurance Market Revenue (Million), by Distribution Channel 2024 & 2032
- Figure 76: Asia Pacific United State Car Insurance Market Volume (Billion), by Distribution Channel 2024 & 2032
- Figure 77: Asia Pacific United State Car Insurance Market Revenue Share (%), by Distribution Channel 2024 & 2032
- Figure 78: Asia Pacific United State Car Insurance Market Volume Share (%), by Distribution Channel 2024 & 2032
- Figure 79: Asia Pacific United State Car Insurance Market Revenue (Million), by Country 2024 & 2032
- Figure 80: Asia Pacific United State Car Insurance Market Volume (Billion), by Country 2024 & 2032
- Figure 81: Asia Pacific United State Car Insurance Market Revenue Share (%), by Country 2024 & 2032
- Figure 82: Asia Pacific United State Car Insurance Market Volume Share (%), by Country 2024 & 2032
List of Tables
- Table 1: Global United State Car Insurance Market Revenue Million Forecast, by Region 2019 & 2032
- Table 2: Global United State Car Insurance Market Volume Billion Forecast, by Region 2019 & 2032
- Table 3: Global United State Car Insurance Market Revenue Million Forecast, by Coverage 2019 & 2032
- Table 4: Global United State Car Insurance Market Volume Billion Forecast, by Coverage 2019 & 2032
- Table 5: Global United State Car Insurance Market Revenue Million Forecast, by Application 2019 & 2032
- Table 6: Global United State Car Insurance Market Volume Billion Forecast, by Application 2019 & 2032
- Table 7: Global United State Car Insurance Market Revenue Million Forecast, by Distribution Channel 2019 & 2032
- Table 8: Global United State Car Insurance Market Volume Billion Forecast, by Distribution Channel 2019 & 2032
- Table 9: Global United State Car Insurance Market Revenue Million Forecast, by Region 2019 & 2032
- Table 10: Global United State Car Insurance Market Volume Billion Forecast, by Region 2019 & 2032
- Table 11: Global United State Car Insurance Market Revenue Million Forecast, by Coverage 2019 & 2032
- Table 12: Global United State Car Insurance Market Volume Billion Forecast, by Coverage 2019 & 2032
- Table 13: Global United State Car Insurance Market Revenue Million Forecast, by Application 2019 & 2032
- Table 14: Global United State Car Insurance Market Volume Billion Forecast, by Application 2019 & 2032
- Table 15: Global United State Car Insurance Market Revenue Million Forecast, by Distribution Channel 2019 & 2032
- Table 16: Global United State Car Insurance Market Volume Billion Forecast, by Distribution Channel 2019 & 2032
- Table 17: Global United State Car Insurance Market Revenue Million Forecast, by Country 2019 & 2032
- Table 18: Global United State Car Insurance Market Volume Billion Forecast, by Country 2019 & 2032
- Table 19: United States United State Car Insurance Market Revenue (Million) Forecast, by Application 2019 & 2032
- Table 20: United States United State Car Insurance Market Volume (Billion) Forecast, by Application 2019 & 2032
- Table 21: Canada United State Car Insurance Market Revenue (Million) Forecast, by Application 2019 & 2032
- Table 22: Canada United State Car Insurance Market Volume (Billion) Forecast, by Application 2019 & 2032
- Table 23: Mexico United State Car Insurance Market Revenue (Million) Forecast, by Application 2019 & 2032
- Table 24: Mexico United State Car Insurance Market Volume (Billion) Forecast, by Application 2019 & 2032
- Table 25: Global United State Car Insurance Market Revenue Million Forecast, by Coverage 2019 & 2032
- Table 26: Global United State Car Insurance Market Volume Billion Forecast, by Coverage 2019 & 2032
- Table 27: Global United State Car Insurance Market Revenue Million Forecast, by Application 2019 & 2032
- Table 28: Global United State Car Insurance Market Volume Billion Forecast, by Application 2019 & 2032
- Table 29: Global United State Car Insurance Market Revenue Million Forecast, by Distribution Channel 2019 & 2032
- Table 30: Global United State Car Insurance Market Volume Billion Forecast, by Distribution Channel 2019 & 2032
- Table 31: Global United State Car Insurance Market Revenue Million Forecast, by Country 2019 & 2032
- Table 32: Global United State Car Insurance Market Volume Billion Forecast, by Country 2019 & 2032
- Table 33: Brazil United State Car Insurance Market Revenue (Million) Forecast, by Application 2019 & 2032
- Table 34: Brazil United State Car Insurance Market Volume (Billion) Forecast, by Application 2019 & 2032
- Table 35: Argentina United State Car Insurance Market Revenue (Million) Forecast, by Application 2019 & 2032
- Table 36: Argentina United State Car Insurance Market Volume (Billion) Forecast, by Application 2019 & 2032
- Table 37: Rest of South America United State Car Insurance Market Revenue (Million) Forecast, by Application 2019 & 2032
- Table 38: Rest of South America United State Car Insurance Market Volume (Billion) Forecast, by Application 2019 & 2032
- Table 39: Global United State Car Insurance Market Revenue Million Forecast, by Coverage 2019 & 2032
- Table 40: Global United State Car Insurance Market Volume Billion Forecast, by Coverage 2019 & 2032
- Table 41: Global United State Car Insurance Market Revenue Million Forecast, by Application 2019 & 2032
- Table 42: Global United State Car Insurance Market Volume Billion Forecast, by Application 2019 & 2032
- Table 43: Global United State Car Insurance Market Revenue Million Forecast, by Distribution Channel 2019 & 2032
- Table 44: Global United State Car Insurance Market Volume Billion Forecast, by Distribution Channel 2019 & 2032
- Table 45: Global United State Car Insurance Market Revenue Million Forecast, by Country 2019 & 2032
- Table 46: Global United State Car Insurance Market Volume Billion Forecast, by Country 2019 & 2032
- Table 47: United Kingdom United State Car Insurance Market Revenue (Million) Forecast, by Application 2019 & 2032
- Table 48: United Kingdom United State Car Insurance Market Volume (Billion) Forecast, by Application 2019 & 2032
- Table 49: Germany United State Car Insurance Market Revenue (Million) Forecast, by Application 2019 & 2032
- Table 50: Germany United State Car Insurance Market Volume (Billion) Forecast, by Application 2019 & 2032
- Table 51: France United State Car Insurance Market Revenue (Million) Forecast, by Application 2019 & 2032
- Table 52: France United State Car Insurance Market Volume (Billion) Forecast, by Application 2019 & 2032
- Table 53: Italy United State Car Insurance Market Revenue (Million) Forecast, by Application 2019 & 2032
- Table 54: Italy United State Car Insurance Market Volume (Billion) Forecast, by Application 2019 & 2032
- Table 55: Spain United State Car Insurance Market Revenue (Million) Forecast, by Application 2019 & 2032
- Table 56: Spain United State Car Insurance Market Volume (Billion) Forecast, by Application 2019 & 2032
- Table 57: Russia United State Car Insurance Market Revenue (Million) Forecast, by Application 2019 & 2032
- Table 58: Russia United State Car Insurance Market Volume (Billion) Forecast, by Application 2019 & 2032
- Table 59: Benelux United State Car Insurance Market Revenue (Million) Forecast, by Application 2019 & 2032
- Table 60: Benelux United State Car Insurance Market Volume (Billion) Forecast, by Application 2019 & 2032
- Table 61: Nordics United State Car Insurance Market Revenue (Million) Forecast, by Application 2019 & 2032
- Table 62: Nordics United State Car Insurance Market Volume (Billion) Forecast, by Application 2019 & 2032
- Table 63: Rest of Europe United State Car Insurance Market Revenue (Million) Forecast, by Application 2019 & 2032
- Table 64: Rest of Europe United State Car Insurance Market Volume (Billion) Forecast, by Application 2019 & 2032
- Table 65: Global United State Car Insurance Market Revenue Million Forecast, by Coverage 2019 & 2032
- Table 66: Global United State Car Insurance Market Volume Billion Forecast, by Coverage 2019 & 2032
- Table 67: Global United State Car Insurance Market Revenue Million Forecast, by Application 2019 & 2032
- Table 68: Global United State Car Insurance Market Volume Billion Forecast, by Application 2019 & 2032
- Table 69: Global United State Car Insurance Market Revenue Million Forecast, by Distribution Channel 2019 & 2032
- Table 70: Global United State Car Insurance Market Volume Billion Forecast, by Distribution Channel 2019 & 2032
- Table 71: Global United State Car Insurance Market Revenue Million Forecast, by Country 2019 & 2032
- Table 72: Global United State Car Insurance Market Volume Billion Forecast, by Country 2019 & 2032
- Table 73: Turkey United State Car Insurance Market Revenue (Million) Forecast, by Application 2019 & 2032
- Table 74: Turkey United State Car Insurance Market Volume (Billion) Forecast, by Application 2019 & 2032
- Table 75: Israel United State Car Insurance Market Revenue (Million) Forecast, by Application 2019 & 2032
- Table 76: Israel United State Car Insurance Market Volume (Billion) Forecast, by Application 2019 & 2032
- Table 77: GCC United State Car Insurance Market Revenue (Million) Forecast, by Application 2019 & 2032
- Table 78: GCC United State Car Insurance Market Volume (Billion) Forecast, by Application 2019 & 2032
- Table 79: North Africa United State Car Insurance Market Revenue (Million) Forecast, by Application 2019 & 2032
- Table 80: North Africa United State Car Insurance Market Volume (Billion) Forecast, by Application 2019 & 2032
- Table 81: South Africa United State Car Insurance Market Revenue (Million) Forecast, by Application 2019 & 2032
- Table 82: South Africa United State Car Insurance Market Volume (Billion) Forecast, by Application 2019 & 2032
- Table 83: Rest of Middle East & Africa United State Car Insurance Market Revenue (Million) Forecast, by Application 2019 & 2032
- Table 84: Rest of Middle East & Africa United State Car Insurance Market Volume (Billion) Forecast, by Application 2019 & 2032
- Table 85: Global United State Car Insurance Market Revenue Million Forecast, by Coverage 2019 & 2032
- Table 86: Global United State Car Insurance Market Volume Billion Forecast, by Coverage 2019 & 2032
- Table 87: Global United State Car Insurance Market Revenue Million Forecast, by Application 2019 & 2032
- Table 88: Global United State Car Insurance Market Volume Billion Forecast, by Application 2019 & 2032
- Table 89: Global United State Car Insurance Market Revenue Million Forecast, by Distribution Channel 2019 & 2032
- Table 90: Global United State Car Insurance Market Volume Billion Forecast, by Distribution Channel 2019 & 2032
- Table 91: Global United State Car Insurance Market Revenue Million Forecast, by Country 2019 & 2032
- Table 92: Global United State Car Insurance Market Volume Billion Forecast, by Country 2019 & 2032
- Table 93: China United State Car Insurance Market Revenue (Million) Forecast, by Application 2019 & 2032
- Table 94: China United State Car Insurance Market Volume (Billion) Forecast, by Application 2019 & 2032
- Table 95: India United State Car Insurance Market Revenue (Million) Forecast, by Application 2019 & 2032
- Table 96: India United State Car Insurance Market Volume (Billion) Forecast, by Application 2019 & 2032
- Table 97: Japan United State Car Insurance Market Revenue (Million) Forecast, by Application 2019 & 2032
- Table 98: Japan United State Car Insurance Market Volume (Billion) Forecast, by Application 2019 & 2032
- Table 99: South Korea United State Car Insurance Market Revenue (Million) Forecast, by Application 2019 & 2032
- Table 100: South Korea United State Car Insurance Market Volume (Billion) Forecast, by Application 2019 & 2032
- Table 101: ASEAN United State Car Insurance Market Revenue (Million) Forecast, by Application 2019 & 2032
- Table 102: ASEAN United State Car Insurance Market Volume (Billion) Forecast, by Application 2019 & 2032
- Table 103: Oceania United State Car Insurance Market Revenue (Million) Forecast, by Application 2019 & 2032
- Table 104: Oceania United State Car Insurance Market Volume (Billion) Forecast, by Application 2019 & 2032
- Table 105: Rest of Asia Pacific United State Car Insurance Market Revenue (Million) Forecast, by Application 2019 & 2032
- Table 106: Rest of Asia Pacific United State Car Insurance Market Volume (Billion) Forecast, by Application 2019 & 2032
Frequently Asked Questions
1. What is the projected Compound Annual Growth Rate (CAGR) of the United State Car Insurance Market?
The projected CAGR is approximately 4.21%.
2. Which companies are prominent players in the United State Car Insurance Market?
Key companies in the market include State Farm Mutual Automobile Insurance, Berkshire Hathaway Inc, Progressive Corp, Allstate Corp, USAA Insurance Group, Liberty Mutual, Farmers Insurance Group of Companies, Nationwide Mutual Group, American Family Insurance Group, Travelers Companies Inc **List Not Exhaustive.
3. What are the main segments of the United State Car Insurance Market?
The market segments include Coverage, Application, Distribution Channel.
4. Can you provide details about the market size?
The market size is estimated to be USD 194.15 Million as of 2022.
5. What are some drivers contributing to market growth?
Rising Number of Accidents Drives The Market; An increase in Road Traffic Accidents Drives The Market.
6. What are the notable trends driving market growth?
Rise In Number Of Traffic Accidents.
7. Are there any restraints impacting market growth?
Rising Number of Accidents Drives The Market; An increase in Road Traffic Accidents Drives The Market.
8. Can you provide examples of recent developments in the market?
August 2023: AXA S.A. introduced its latest digital claims solution, STeP, which simplifies the car insurance process.
9. What pricing options are available for accessing the report?
Pricing options include single-user, multi-user, and enterprise licenses priced at USD 3800, USD 4500, and USD 5800 respectively.
10. Is the market size provided in terms of value or volume?
The market size is provided in terms of value, measured in Million and volume, measured in Billion.
11. Are there any specific market keywords associated with the report?
Yes, the market keyword associated with the report is "United State Car Insurance Market," which aids in identifying and referencing the specific market segment covered.
12. How do I determine which pricing option suits my needs best?
The pricing options vary based on user requirements and access needs. Individual users may opt for single-user licenses, while businesses requiring broader access may choose multi-user or enterprise licenses for cost-effective access to the report.
13. Are there any additional resources or data provided in the United State Car Insurance Market report?
While the report offers comprehensive insights, it's advisable to review the specific contents or supplementary materials provided to ascertain if additional resources or data are available.
14. How can I stay updated on further developments or reports in the United State Car Insurance Market?
To stay informed about further developments, trends, and reports in the United State Car Insurance Market, consider subscribing to industry newsletters, following relevant companies and organizations, or regularly checking reputable industry news sources and publications.
Methodology
Step 1 - Identification of Relevant Samples Size from Population Database


Step 2 - Approaches for Defining Global Market Size (Value, Volume* & Price*)

Note*: In applicable scenarios
Step 3 - Data Sources
Primary Research
- Web Analytics
- Survey Reports
- Research Institute
- Latest Research Reports
- Opinion Leaders
Secondary Research
- Annual Reports
- White Paper
- Latest Press Release
- Industry Association
- Paid Database
- Investor Presentations

Step 4 - Data Triangulation
Involves using different sources of information in order to increase the validity of a study
These sources are likely to be stakeholders in a program - participants, other researchers, program staff, other community members, and so on.
Then we put all data in single framework & apply various statistical tools to find out the dynamic on the market.
During the analysis stage, feedback from the stakeholder groups would be compared to determine areas of agreement as well as areas of divergence


