
Key Insights
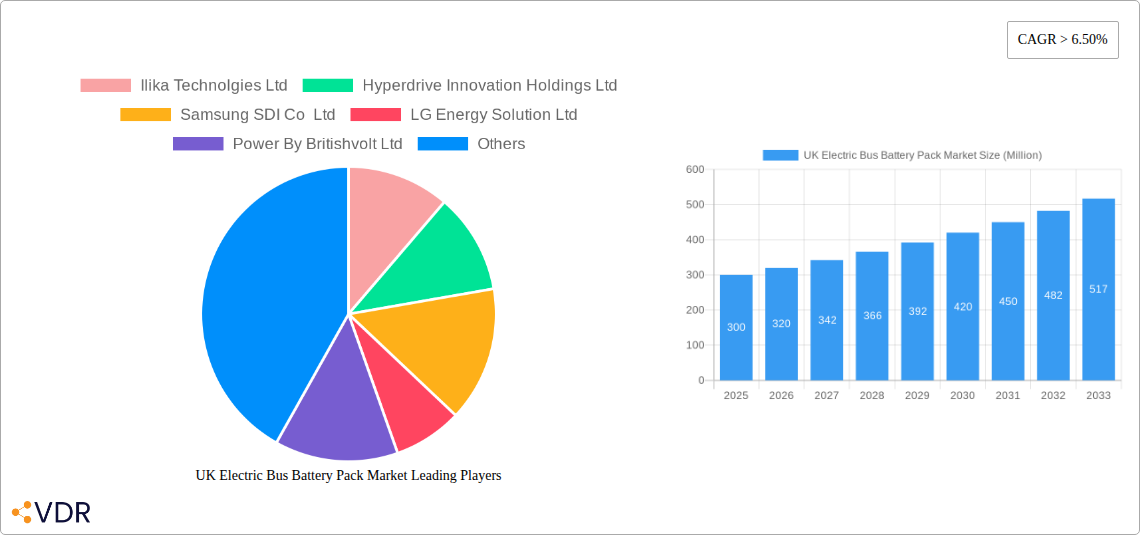
The UK electric bus battery pack market is experiencing robust growth, driven by government initiatives promoting sustainable transportation and the increasing awareness of environmental concerns. With a Compound Annual Growth Rate (CAGR) exceeding 6.50%, the market, valued at an estimated £300 million in 2025, is projected to reach significant size by 2033. Several factors contribute to this expansion. Firstly, stringent emission regulations are pushing bus operators to transition to electric fleets. Secondly, advancements in battery technology, such as improved energy density and lifespan, are making electric buses a more viable and cost-effective alternative to diesel buses. The market segmentation reveals a diverse landscape, with various battery chemistries (LFP, NCA, NMC, etc.), capacities (ranging from under 15 kWh to over 80 kWh), and form factors (cylindrical, pouch, prismatic) catering to different bus models and operational requirements. Key players like BYD, CATL, and others are actively investing in the UK market, further fueling its growth.
The market's growth isn't without challenges. High initial investment costs for electric buses and their battery packs remain a significant barrier for adoption, particularly for smaller operators. Furthermore, the availability and cost of raw materials, particularly lithium and cobalt, pose potential supply chain risks. However, ongoing research and development in battery technology are aiming to address these concerns through improved efficiency, reduced reliance on critical minerals, and the exploration of alternative battery chemistries. The market’s future trajectory hinges on continued government support, further technological advancements, and the successful integration of charging infrastructure to support widespread electric bus adoption. The focus on sustainable solutions and the environmental benefits will be crucial factors in driving this market forward.
UK Electric Bus Battery Pack Market: A Comprehensive Report (2019-2033)
This in-depth report provides a comprehensive analysis of the UK electric bus battery pack market, encompassing market dynamics, growth trends, regional segmentation, product landscape, key players, and future outlook. The study period covers 2019-2033, with a base year of 2025 and a forecast period of 2025-2033. The report utilizes data from the historical period of 2019-2024 to build a robust predictive model, offering invaluable insights for industry professionals, investors, and stakeholders. This report is crucial for understanding the evolution of this rapidly growing sector within the broader UK electric vehicle (EV) and renewable energy markets. The parent market is the UK EV market, and the child market is the UK electric bus battery pack market.
UK Electric Bus Battery Pack Market Market Dynamics & Structure
The UK electric bus battery pack market is experiencing significant growth driven by government initiatives promoting EV adoption, increasing environmental concerns, and advancements in battery technology. Market concentration is currently moderate, with several key players vying for market share. Technological innovation, particularly in battery chemistry (LFP, NCA, NCM, NMC) and form factor (cylindrical, pouch, prismatic), is a major driver. Stringent regulatory frameworks, including emission standards and safety regulations, shape market dynamics. Competitive substitutes, such as hydrogen fuel cell buses, exert pressure, though their market penetration remains limited. End-user demographics are primarily focused on public transport operators and local authorities. M&A activity is relatively frequent, reflecting consolidation within the supply chain and efforts to secure battery materials and manufacturing capacity.
- Market Concentration: Moderate, with xx% market share held by the top 3 players in 2024.
- Technological Innovation: Rapid advancements in battery energy density, lifespan, and charging speed are key drivers.
- Regulatory Framework: Stringent emission standards and safety regulations promote battery adoption.
- Competitive Substitutes: Hydrogen fuel cell buses present a niche competitive threat.
- M&A Activity: xx deals concluded between 2019 and 2024, indicating consolidation trends.
- Innovation Barriers: High R&D costs, supply chain complexities, and material sourcing challenges.
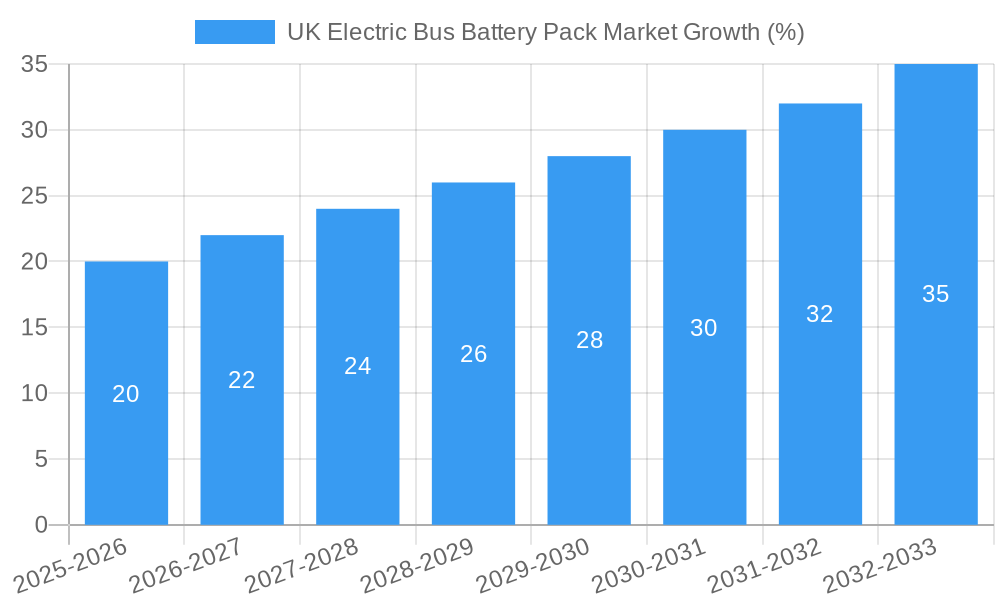
UK Electric Bus Battery Pack Market Growth Trends & Insights
The UK electric bus battery pack market is poised for robust expansion, fueled by supportive government policies, rising environmental awareness, and falling battery costs. The market size is projected to reach £xx million in 2025, exhibiting a CAGR of xx% during the forecast period (2025-2033). Adoption rates are accelerating, driven by increasing urban air quality concerns and the commitment of local authorities to decarbonize public transport. Technological disruptions, such as solid-state batteries, promise further market growth. Consumer behavior is shifting towards environmentally conscious choices, further bolstering demand for electric buses.
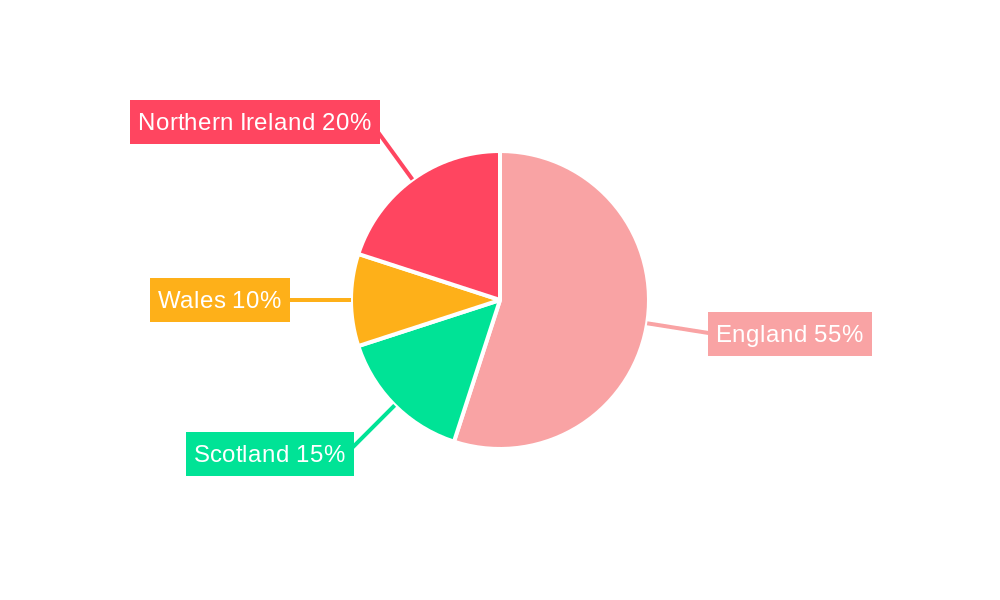
Dominant Regions, Countries, or Segments in UK Electric Bus Battery Pack Market
London and other major metropolitan areas are leading the adoption of electric buses, due to high population density, concentrated public transport networks, and stringent air quality regulations. The largest segment by component is the cathode (xx% market share in 2024), reflecting its crucial role in battery performance. Lithium and Nickel are dominant material types, representing xx% and xx% market share respectively in 2024. BEVs (Battery Electric Vehicles) represent the majority of the propulsion type market segment. High-capacity battery packs (above 80 kWh) are becoming increasingly prevalent, driven by the need for extended operational ranges for electric buses.
- Key Drivers: Government incentives, air quality regulations, and increasing environmental consciousness.
- Dominant Regions: London, Greater Manchester, other major urban centres.
- Leading Components: Cathodes, followed by Anodes, Electrolytes and Separators.
- Leading Material Types: Lithium, Nickel, Cobalt.
- Leading Propulsion Type: BEVs.
- Dominant Capacity Segment: Above 80 kWh.
UK Electric Bus Battery Pack Market Product Landscape
The UK electric bus battery pack market features a diverse range of products, characterized by varying energy densities, chemistries (LFP, NCA, NCM, NMC), and form factors (cylindrical, pouch, prismatic). Key innovations focus on improved safety features, faster charging capabilities, extended lifespan, and enhanced thermal management. Unique selling propositions often centre on superior performance metrics, such as energy density and cycle life, and tailored solutions for specific bus models.
Key Drivers, Barriers & Challenges in UK Electric Bus Battery Pack Market
Key Drivers:
- Government support through subsidies and grants.
- Increasingly stringent emission regulations.
- Growing consumer preference for sustainable transport solutions.
- Advancements in battery technology leading to improved performance and reduced costs.
Key Barriers & Challenges:
- High initial investment costs for electric bus fleets.
- Limited charging infrastructure in some areas.
- Concerns about battery lifespan and replacement costs.
- Supply chain vulnerabilities and potential material shortages.
Emerging Opportunities in UK Electric Bus Battery Pack Market
Emerging opportunities lie in the development of next-generation battery technologies, including solid-state batteries and improved recycling processes. Expanding charging infrastructure and innovative financing models could unlock further market growth. The integration of smart technologies, such as predictive maintenance and energy management systems, also presents significant opportunities.
Growth Accelerators in the UK Electric Bus Battery Pack Market Industry
Long-term growth will be accelerated by continued government investment in public transport electrification, technological breakthroughs in battery technology leading to higher energy densities and longer lifespans, and the emergence of innovative business models that facilitate the adoption of electric buses. Strategic partnerships between battery manufacturers, bus manufacturers, and charging infrastructure providers will play a critical role in accelerating market growth.
Key Players Shaping the UK Electric Bus Battery Pack Market Market
- Ilika Technologies Ltd
- Hyperdrive Innovation Holdings Ltd
- Samsung SDI Co Ltd
- LG Energy Solution Ltd
- Power By Britishvolt Ltd
- Contemporary Amperex Technology Co Ltd (CATL)
- BYD Company Ltd
- Amte Power PLC
- SK Innovation Co Ltd
- Automotive Cells Company (ACC)
Notable Milestones in UK Electric Bus Battery Pack Market Sector
- June 2022: POSCO Chemical signs MoU with Britishvolt to supply battery materials.
- July 2022: Britishvolt and H&T Battery Components sign MoU for battery can components.
- January 2023: Samsung SDI considers joint venture with BMW for EV battery production in Hungary.
In-Depth UK Electric Bus Battery Pack Market Market Outlook
The future of the UK electric bus battery pack market is exceptionally bright, driven by supportive government policies, escalating environmental concerns, and continuous advancements in battery technology. Strategic partnerships, along with further development of charging infrastructure and innovative battery recycling solutions, will be key factors in realizing the market's substantial growth potential. The market is expected to witness substantial expansion throughout the forecast period, presenting significant opportunities for businesses involved in battery manufacturing, supply chain management, and electric bus deployment.
UK Electric Bus Battery Pack Market Segmentation
-
1. Propulsion Type
- 1.1. BEV
- 1.2. PHEV
-
2. Battery Chemistry
- 2.1. LFP
- 2.2. NCA
- 2.3. NCM
- 2.4. NMC
- 2.5. Others
-
3. Capacity
- 3.1. 15 kWh to 40 kWh
- 3.2. 40 kWh to 80 kWh
- 3.3. Above 80 kWh
- 3.4. Less than 15 kWh
-
4. Battery Form
- 4.1. Cylindrical
- 4.2. Pouch
- 4.3. Prismatic
-
5. Method
- 5.1. Laser
- 5.2. Wire
-
6. Component
- 6.1. Anode
- 6.2. Cathode
- 6.3. Electrolyte
- 6.4. Separator
-
7. Material Type
- 7.1. Cobalt
- 7.2. Lithium
- 7.3. Manganese
- 7.4. Natural Graphite
- 7.5. Nickel
- 7.6. Other Materials
UK Electric Bus Battery Pack Market Segmentation By Geography
-
1. North America
- 1.1. United States
- 1.2. Canada
- 1.3. Mexico
-
2. South America
- 2.1. Brazil
- 2.2. Argentina
- 2.3. Rest of South America
-
3. Europe
- 3.1. United Kingdom
- 3.2. Germany
- 3.3. France
- 3.4. Italy
- 3.5. Spain
- 3.6. Russia
- 3.7. Benelux
- 3.8. Nordics
- 3.9. Rest of Europe
-
4. Middle East & Africa
- 4.1. Turkey
- 4.2. Israel
- 4.3. GCC
- 4.4. North Africa
- 4.5. South Africa
- 4.6. Rest of Middle East & Africa
-
5. Asia Pacific
- 5.1. China
- 5.2. India
- 5.3. Japan
- 5.4. South Korea
- 5.5. ASEAN
- 5.6. Oceania
- 5.7. Rest of Asia Pacific
UK Electric Bus Battery Pack Market REPORT HIGHLIGHTS
| Aspects | Details |
|---|---|
| Study Period | 2019-2033 |
| Base Year | 2024 |
| Estimated Year | 2025 |
| Forecast Period | 2025-2033 |
| Historical Period | 2019-2024 |
| Growth Rate | CAGR of > 6.50% from 2019-2033 |
| Segmentation |
|
Table of Contents
- 1. Introduction
- 1.1. Research Scope
- 1.2. Market Segmentation
- 1.3. Research Methodology
- 1.4. Definitions and Assumptions
- 2. Executive Summary
- 2.1. Introduction
- 3. Market Dynamics
- 3.1. Introduction
- 3.2. Market Drivers
- 3.2.1. Increasing Demand and Sales of Commercial Vehicles is Driving the Market for Hydraulic Systems
- 3.3. Market Restrains
- 3.3.1. Increasing Replacement of Conventional Hydraulic Systems with Fully-electric Hydraulic Systems Acts as a Restraint
- 3.4. Market Trends
- 3.4.1. OTHER KEY INDUSTRY TRENDS COVERED IN THE REPORT
- 4. Market Factor Analysis
- 4.1. Porters Five Forces
- 4.2. Supply/Value Chain
- 4.3. PESTEL analysis
- 4.4. Market Entropy
- 4.5. Patent/Trademark Analysis
- 5. Global UK Electric Bus Battery Pack Market Analysis, Insights and Forecast, 2019-2031
- 5.1. Market Analysis, Insights and Forecast - by Propulsion Type
- 5.1.1. BEV
- 5.1.2. PHEV
- 5.2. Market Analysis, Insights and Forecast - by Battery Chemistry
- 5.2.1. LFP
- 5.2.2. NCA
- 5.2.3. NCM
- 5.2.4. NMC
- 5.2.5. Others
- 5.3. Market Analysis, Insights and Forecast - by Capacity
- 5.3.1. 15 kWh to 40 kWh
- 5.3.2. 40 kWh to 80 kWh
- 5.3.3. Above 80 kWh
- 5.3.4. Less than 15 kWh
- 5.4. Market Analysis, Insights and Forecast - by Battery Form
- 5.4.1. Cylindrical
- 5.4.2. Pouch
- 5.4.3. Prismatic
- 5.5. Market Analysis, Insights and Forecast - by Method
- 5.5.1. Laser
- 5.5.2. Wire
- 5.6. Market Analysis, Insights and Forecast - by Component
- 5.6.1. Anode
- 5.6.2. Cathode
- 5.6.3. Electrolyte
- 5.6.4. Separator
- 5.7. Market Analysis, Insights and Forecast - by Material Type
- 5.7.1. Cobalt
- 5.7.2. Lithium
- 5.7.3. Manganese
- 5.7.4. Natural Graphite
- 5.7.5. Nickel
- 5.7.6. Other Materials
- 5.8. Market Analysis, Insights and Forecast - by Region
- 5.8.1. North America
- 5.8.2. South America
- 5.8.3. Europe
- 5.8.4. Middle East & Africa
- 5.8.5. Asia Pacific
- 5.1. Market Analysis, Insights and Forecast - by Propulsion Type
- 6. North America UK Electric Bus Battery Pack Market Analysis, Insights and Forecast, 2019-2031
- 6.1. Market Analysis, Insights and Forecast - by Propulsion Type
- 6.1.1. BEV
- 6.1.2. PHEV
- 6.2. Market Analysis, Insights and Forecast - by Battery Chemistry
- 6.2.1. LFP
- 6.2.2. NCA
- 6.2.3. NCM
- 6.2.4. NMC
- 6.2.5. Others
- 6.3. Market Analysis, Insights and Forecast - by Capacity
- 6.3.1. 15 kWh to 40 kWh
- 6.3.2. 40 kWh to 80 kWh
- 6.3.3. Above 80 kWh
- 6.3.4. Less than 15 kWh
- 6.4. Market Analysis, Insights and Forecast - by Battery Form
- 6.4.1. Cylindrical
- 6.4.2. Pouch
- 6.4.3. Prismatic
- 6.5. Market Analysis, Insights and Forecast - by Method
- 6.5.1. Laser
- 6.5.2. Wire
- 6.6. Market Analysis, Insights and Forecast - by Component
- 6.6.1. Anode
- 6.6.2. Cathode
- 6.6.3. Electrolyte
- 6.6.4. Separator
- 6.7. Market Analysis, Insights and Forecast - by Material Type
- 6.7.1. Cobalt
- 6.7.2. Lithium
- 6.7.3. Manganese
- 6.7.4. Natural Graphite
- 6.7.5. Nickel
- 6.7.6. Other Materials
- 6.1. Market Analysis, Insights and Forecast - by Propulsion Type
- 7. South America UK Electric Bus Battery Pack Market Analysis, Insights and Forecast, 2019-2031
- 7.1. Market Analysis, Insights and Forecast - by Propulsion Type
- 7.1.1. BEV
- 7.1.2. PHEV
- 7.2. Market Analysis, Insights and Forecast - by Battery Chemistry
- 7.2.1. LFP
- 7.2.2. NCA
- 7.2.3. NCM
- 7.2.4. NMC
- 7.2.5. Others
- 7.3. Market Analysis, Insights and Forecast - by Capacity
- 7.3.1. 15 kWh to 40 kWh
- 7.3.2. 40 kWh to 80 kWh
- 7.3.3. Above 80 kWh
- 7.3.4. Less than 15 kWh
- 7.4. Market Analysis, Insights and Forecast - by Battery Form
- 7.4.1. Cylindrical
- 7.4.2. Pouch
- 7.4.3. Prismatic
- 7.5. Market Analysis, Insights and Forecast - by Method
- 7.5.1. Laser
- 7.5.2. Wire
- 7.6. Market Analysis, Insights and Forecast - by Component
- 7.6.1. Anode
- 7.6.2. Cathode
- 7.6.3. Electrolyte
- 7.6.4. Separator
- 7.7. Market Analysis, Insights and Forecast - by Material Type
- 7.7.1. Cobalt
- 7.7.2. Lithium
- 7.7.3. Manganese
- 7.7.4. Natural Graphite
- 7.7.5. Nickel
- 7.7.6. Other Materials
- 7.1. Market Analysis, Insights and Forecast - by Propulsion Type
- 8. Europe UK Electric Bus Battery Pack Market Analysis, Insights and Forecast, 2019-2031
- 8.1. Market Analysis, Insights and Forecast - by Propulsion Type
- 8.1.1. BEV
- 8.1.2. PHEV
- 8.2. Market Analysis, Insights and Forecast - by Battery Chemistry
- 8.2.1. LFP
- 8.2.2. NCA
- 8.2.3. NCM
- 8.2.4. NMC
- 8.2.5. Others
- 8.3. Market Analysis, Insights and Forecast - by Capacity
- 8.3.1. 15 kWh to 40 kWh
- 8.3.2. 40 kWh to 80 kWh
- 8.3.3. Above 80 kWh
- 8.3.4. Less than 15 kWh
- 8.4. Market Analysis, Insights and Forecast - by Battery Form
- 8.4.1. Cylindrical
- 8.4.2. Pouch
- 8.4.3. Prismatic
- 8.5. Market Analysis, Insights and Forecast - by Method
- 8.5.1. Laser
- 8.5.2. Wire
- 8.6. Market Analysis, Insights and Forecast - by Component
- 8.6.1. Anode
- 8.6.2. Cathode
- 8.6.3. Electrolyte
- 8.6.4. Separator
- 8.7. Market Analysis, Insights and Forecast - by Material Type
- 8.7.1. Cobalt
- 8.7.2. Lithium
- 8.7.3. Manganese
- 8.7.4. Natural Graphite
- 8.7.5. Nickel
- 8.7.6. Other Materials
- 8.1. Market Analysis, Insights and Forecast - by Propulsion Type
- 9. Middle East & Africa UK Electric Bus Battery Pack Market Analysis, Insights and Forecast, 2019-2031
- 9.1. Market Analysis, Insights and Forecast - by Propulsion Type
- 9.1.1. BEV
- 9.1.2. PHEV
- 9.2. Market Analysis, Insights and Forecast - by Battery Chemistry
- 9.2.1. LFP
- 9.2.2. NCA
- 9.2.3. NCM
- 9.2.4. NMC
- 9.2.5. Others
- 9.3. Market Analysis, Insights and Forecast - by Capacity
- 9.3.1. 15 kWh to 40 kWh
- 9.3.2. 40 kWh to 80 kWh
- 9.3.3. Above 80 kWh
- 9.3.4. Less than 15 kWh
- 9.4. Market Analysis, Insights and Forecast - by Battery Form
- 9.4.1. Cylindrical
- 9.4.2. Pouch
- 9.4.3. Prismatic
- 9.5. Market Analysis, Insights and Forecast - by Method
- 9.5.1. Laser
- 9.5.2. Wire
- 9.6. Market Analysis, Insights and Forecast - by Component
- 9.6.1. Anode
- 9.6.2. Cathode
- 9.6.3. Electrolyte
- 9.6.4. Separator
- 9.7. Market Analysis, Insights and Forecast - by Material Type
- 9.7.1. Cobalt
- 9.7.2. Lithium
- 9.7.3. Manganese
- 9.7.4. Natural Graphite
- 9.7.5. Nickel
- 9.7.6. Other Materials
- 9.1. Market Analysis, Insights and Forecast - by Propulsion Type
- 10. Asia Pacific UK Electric Bus Battery Pack Market Analysis, Insights and Forecast, 2019-2031
- 10.1. Market Analysis, Insights and Forecast - by Propulsion Type
- 10.1.1. BEV
- 10.1.2. PHEV
- 10.2. Market Analysis, Insights and Forecast - by Battery Chemistry
- 10.2.1. LFP
- 10.2.2. NCA
- 10.2.3. NCM
- 10.2.4. NMC
- 10.2.5. Others
- 10.3. Market Analysis, Insights and Forecast - by Capacity
- 10.3.1. 15 kWh to 40 kWh
- 10.3.2. 40 kWh to 80 kWh
- 10.3.3. Above 80 kWh
- 10.3.4. Less than 15 kWh
- 10.4. Market Analysis, Insights and Forecast - by Battery Form
- 10.4.1. Cylindrical
- 10.4.2. Pouch
- 10.4.3. Prismatic
- 10.5. Market Analysis, Insights and Forecast - by Method
- 10.5.1. Laser
- 10.5.2. Wire
- 10.6. Market Analysis, Insights and Forecast - by Component
- 10.6.1. Anode
- 10.6.2. Cathode
- 10.6.3. Electrolyte
- 10.6.4. Separator
- 10.7. Market Analysis, Insights and Forecast - by Material Type
- 10.7.1. Cobalt
- 10.7.2. Lithium
- 10.7.3. Manganese
- 10.7.4. Natural Graphite
- 10.7.5. Nickel
- 10.7.6. Other Materials
- 10.1. Market Analysis, Insights and Forecast - by Propulsion Type
- 11. England UK Electric Bus Battery Pack Market Analysis, Insights and Forecast, 2019-2031
- 12. Wales UK Electric Bus Battery Pack Market Analysis, Insights and Forecast, 2019-2031
- 13. Scotland UK Electric Bus Battery Pack Market Analysis, Insights and Forecast, 2019-2031
- 14. Northern UK Electric Bus Battery Pack Market Analysis, Insights and Forecast, 2019-2031
- 15. Ireland UK Electric Bus Battery Pack Market Analysis, Insights and Forecast, 2019-2031
- 16. Competitive Analysis
- 16.1. Global Market Share Analysis 2024
- 16.2. Company Profiles
- 16.2.1 Ilika Technolgies Ltd
- 16.2.1.1. Overview
- 16.2.1.2. Products
- 16.2.1.3. SWOT Analysis
- 16.2.1.4. Recent Developments
- 16.2.1.5. Financials (Based on Availability)
- 16.2.2 Hyperdrive Innovation Holdings Ltd
- 16.2.2.1. Overview
- 16.2.2.2. Products
- 16.2.2.3. SWOT Analysis
- 16.2.2.4. Recent Developments
- 16.2.2.5. Financials (Based on Availability)
- 16.2.3 Samsung SDI Co Ltd
- 16.2.3.1. Overview
- 16.2.3.2. Products
- 16.2.3.3. SWOT Analysis
- 16.2.3.4. Recent Developments
- 16.2.3.5. Financials (Based on Availability)
- 16.2.4 LG Energy Solution Ltd
- 16.2.4.1. Overview
- 16.2.4.2. Products
- 16.2.4.3. SWOT Analysis
- 16.2.4.4. Recent Developments
- 16.2.4.5. Financials (Based on Availability)
- 16.2.5 Power By Britishvolt Ltd
- 16.2.5.1. Overview
- 16.2.5.2. Products
- 16.2.5.3. SWOT Analysis
- 16.2.5.4. Recent Developments
- 16.2.5.5. Financials (Based on Availability)
- 16.2.6 Contemporary Amperex Technology Co Ltd (CATL)
- 16.2.6.1. Overview
- 16.2.6.2. Products
- 16.2.6.3. SWOT Analysis
- 16.2.6.4. Recent Developments
- 16.2.6.5. Financials (Based on Availability)
- 16.2.7 BYD Company Ltd
- 16.2.7.1. Overview
- 16.2.7.2. Products
- 16.2.7.3. SWOT Analysis
- 16.2.7.4. Recent Developments
- 16.2.7.5. Financials (Based on Availability)
- 16.2.8 Amte Power PLC
- 16.2.8.1. Overview
- 16.2.8.2. Products
- 16.2.8.3. SWOT Analysis
- 16.2.8.4. Recent Developments
- 16.2.8.5. Financials (Based on Availability)
- 16.2.9 SK Innovation Co Ltd
- 16.2.9.1. Overview
- 16.2.9.2. Products
- 16.2.9.3. SWOT Analysis
- 16.2.9.4. Recent Developments
- 16.2.9.5. Financials (Based on Availability)
- 16.2.10 Automotive Cells Company (ACC)
- 16.2.10.1. Overview
- 16.2.10.2. Products
- 16.2.10.3. SWOT Analysis
- 16.2.10.4. Recent Developments
- 16.2.10.5. Financials (Based on Availability)
- 16.2.1 Ilika Technolgies Ltd
List of Figures
- Figure 1: Global UK Electric Bus Battery Pack Market Revenue Breakdown (Million, %) by Region 2024 & 2032
- Figure 2: United kingdom Region UK Electric Bus Battery Pack Market Revenue (Million), by Country 2024 & 2032
- Figure 3: United kingdom Region UK Electric Bus Battery Pack Market Revenue Share (%), by Country 2024 & 2032
- Figure 4: North America UK Electric Bus Battery Pack Market Revenue (Million), by Propulsion Type 2024 & 2032
- Figure 5: North America UK Electric Bus Battery Pack Market Revenue Share (%), by Propulsion Type 2024 & 2032
- Figure 6: North America UK Electric Bus Battery Pack Market Revenue (Million), by Battery Chemistry 2024 & 2032
- Figure 7: North America UK Electric Bus Battery Pack Market Revenue Share (%), by Battery Chemistry 2024 & 2032
- Figure 8: North America UK Electric Bus Battery Pack Market Revenue (Million), by Capacity 2024 & 2032
- Figure 9: North America UK Electric Bus Battery Pack Market Revenue Share (%), by Capacity 2024 & 2032
- Figure 10: North America UK Electric Bus Battery Pack Market Revenue (Million), by Battery Form 2024 & 2032
- Figure 11: North America UK Electric Bus Battery Pack Market Revenue Share (%), by Battery Form 2024 & 2032
- Figure 12: North America UK Electric Bus Battery Pack Market Revenue (Million), by Method 2024 & 2032
- Figure 13: North America UK Electric Bus Battery Pack Market Revenue Share (%), by Method 2024 & 2032
- Figure 14: North America UK Electric Bus Battery Pack Market Revenue (Million), by Component 2024 & 2032
- Figure 15: North America UK Electric Bus Battery Pack Market Revenue Share (%), by Component 2024 & 2032
- Figure 16: North America UK Electric Bus Battery Pack Market Revenue (Million), by Material Type 2024 & 2032
- Figure 17: North America UK Electric Bus Battery Pack Market Revenue Share (%), by Material Type 2024 & 2032
- Figure 18: North America UK Electric Bus Battery Pack Market Revenue (Million), by Country 2024 & 2032
- Figure 19: North America UK Electric Bus Battery Pack Market Revenue Share (%), by Country 2024 & 2032
- Figure 20: South America UK Electric Bus Battery Pack Market Revenue (Million), by Propulsion Type 2024 & 2032
- Figure 21: South America UK Electric Bus Battery Pack Market Revenue Share (%), by Propulsion Type 2024 & 2032
- Figure 22: South America UK Electric Bus Battery Pack Market Revenue (Million), by Battery Chemistry 2024 & 2032
- Figure 23: South America UK Electric Bus Battery Pack Market Revenue Share (%), by Battery Chemistry 2024 & 2032
- Figure 24: South America UK Electric Bus Battery Pack Market Revenue (Million), by Capacity 2024 & 2032
- Figure 25: South America UK Electric Bus Battery Pack Market Revenue Share (%), by Capacity 2024 & 2032
- Figure 26: South America UK Electric Bus Battery Pack Market Revenue (Million), by Battery Form 2024 & 2032
- Figure 27: South America UK Electric Bus Battery Pack Market Revenue Share (%), by Battery Form 2024 & 2032
- Figure 28: South America UK Electric Bus Battery Pack Market Revenue (Million), by Method 2024 & 2032
- Figure 29: South America UK Electric Bus Battery Pack Market Revenue Share (%), by Method 2024 & 2032
- Figure 30: South America UK Electric Bus Battery Pack Market Revenue (Million), by Component 2024 & 2032
- Figure 31: South America UK Electric Bus Battery Pack Market Revenue Share (%), by Component 2024 & 2032
- Figure 32: South America UK Electric Bus Battery Pack Market Revenue (Million), by Material Type 2024 & 2032
- Figure 33: South America UK Electric Bus Battery Pack Market Revenue Share (%), by Material Type 2024 & 2032
- Figure 34: South America UK Electric Bus Battery Pack Market Revenue (Million), by Country 2024 & 2032
- Figure 35: South America UK Electric Bus Battery Pack Market Revenue Share (%), by Country 2024 & 2032
- Figure 36: Europe UK Electric Bus Battery Pack Market Revenue (Million), by Propulsion Type 2024 & 2032
- Figure 37: Europe UK Electric Bus Battery Pack Market Revenue Share (%), by Propulsion Type 2024 & 2032
- Figure 38: Europe UK Electric Bus Battery Pack Market Revenue (Million), by Battery Chemistry 2024 & 2032
- Figure 39: Europe UK Electric Bus Battery Pack Market Revenue Share (%), by Battery Chemistry 2024 & 2032
- Figure 40: Europe UK Electric Bus Battery Pack Market Revenue (Million), by Capacity 2024 & 2032
- Figure 41: Europe UK Electric Bus Battery Pack Market Revenue Share (%), by Capacity 2024 & 2032
- Figure 42: Europe UK Electric Bus Battery Pack Market Revenue (Million), by Battery Form 2024 & 2032
- Figure 43: Europe UK Electric Bus Battery Pack Market Revenue Share (%), by Battery Form 2024 & 2032
- Figure 44: Europe UK Electric Bus Battery Pack Market Revenue (Million), by Method 2024 & 2032
- Figure 45: Europe UK Electric Bus Battery Pack Market Revenue Share (%), by Method 2024 & 2032
- Figure 46: Europe UK Electric Bus Battery Pack Market Revenue (Million), by Component 2024 & 2032
- Figure 47: Europe UK Electric Bus Battery Pack Market Revenue Share (%), by Component 2024 & 2032
- Figure 48: Europe UK Electric Bus Battery Pack Market Revenue (Million), by Material Type 2024 & 2032
- Figure 49: Europe UK Electric Bus Battery Pack Market Revenue Share (%), by Material Type 2024 & 2032
- Figure 50: Europe UK Electric Bus Battery Pack Market Revenue (Million), by Country 2024 & 2032
- Figure 51: Europe UK Electric Bus Battery Pack Market Revenue Share (%), by Country 2024 & 2032
- Figure 52: Middle East & Africa UK Electric Bus Battery Pack Market Revenue (Million), by Propulsion Type 2024 & 2032
- Figure 53: Middle East & Africa UK Electric Bus Battery Pack Market Revenue Share (%), by Propulsion Type 2024 & 2032
- Figure 54: Middle East & Africa UK Electric Bus Battery Pack Market Revenue (Million), by Battery Chemistry 2024 & 2032
- Figure 55: Middle East & Africa UK Electric Bus Battery Pack Market Revenue Share (%), by Battery Chemistry 2024 & 2032
- Figure 56: Middle East & Africa UK Electric Bus Battery Pack Market Revenue (Million), by Capacity 2024 & 2032
- Figure 57: Middle East & Africa UK Electric Bus Battery Pack Market Revenue Share (%), by Capacity 2024 & 2032
- Figure 58: Middle East & Africa UK Electric Bus Battery Pack Market Revenue (Million), by Battery Form 2024 & 2032
- Figure 59: Middle East & Africa UK Electric Bus Battery Pack Market Revenue Share (%), by Battery Form 2024 & 2032
- Figure 60: Middle East & Africa UK Electric Bus Battery Pack Market Revenue (Million), by Method 2024 & 2032
- Figure 61: Middle East & Africa UK Electric Bus Battery Pack Market Revenue Share (%), by Method 2024 & 2032
- Figure 62: Middle East & Africa UK Electric Bus Battery Pack Market Revenue (Million), by Component 2024 & 2032
- Figure 63: Middle East & Africa UK Electric Bus Battery Pack Market Revenue Share (%), by Component 2024 & 2032
- Figure 64: Middle East & Africa UK Electric Bus Battery Pack Market Revenue (Million), by Material Type 2024 & 2032
- Figure 65: Middle East & Africa UK Electric Bus Battery Pack Market Revenue Share (%), by Material Type 2024 & 2032
- Figure 66: Middle East & Africa UK Electric Bus Battery Pack Market Revenue (Million), by Country 2024 & 2032
- Figure 67: Middle East & Africa UK Electric Bus Battery Pack Market Revenue Share (%), by Country 2024 & 2032
- Figure 68: Asia Pacific UK Electric Bus Battery Pack Market Revenue (Million), by Propulsion Type 2024 & 2032
- Figure 69: Asia Pacific UK Electric Bus Battery Pack Market Revenue Share (%), by Propulsion Type 2024 & 2032
- Figure 70: Asia Pacific UK Electric Bus Battery Pack Market Revenue (Million), by Battery Chemistry 2024 & 2032
- Figure 71: Asia Pacific UK Electric Bus Battery Pack Market Revenue Share (%), by Battery Chemistry 2024 & 2032
- Figure 72: Asia Pacific UK Electric Bus Battery Pack Market Revenue (Million), by Capacity 2024 & 2032
- Figure 73: Asia Pacific UK Electric Bus Battery Pack Market Revenue Share (%), by Capacity 2024 & 2032
- Figure 74: Asia Pacific UK Electric Bus Battery Pack Market Revenue (Million), by Battery Form 2024 & 2032
- Figure 75: Asia Pacific UK Electric Bus Battery Pack Market Revenue Share (%), by Battery Form 2024 & 2032
- Figure 76: Asia Pacific UK Electric Bus Battery Pack Market Revenue (Million), by Method 2024 & 2032
- Figure 77: Asia Pacific UK Electric Bus Battery Pack Market Revenue Share (%), by Method 2024 & 2032
- Figure 78: Asia Pacific UK Electric Bus Battery Pack Market Revenue (Million), by Component 2024 & 2032
- Figure 79: Asia Pacific UK Electric Bus Battery Pack Market Revenue Share (%), by Component 2024 & 2032
- Figure 80: Asia Pacific UK Electric Bus Battery Pack Market Revenue (Million), by Material Type 2024 & 2032
- Figure 81: Asia Pacific UK Electric Bus Battery Pack Market Revenue Share (%), by Material Type 2024 & 2032
- Figure 82: Asia Pacific UK Electric Bus Battery Pack Market Revenue (Million), by Country 2024 & 2032
- Figure 83: Asia Pacific UK Electric Bus Battery Pack Market Revenue Share (%), by Country 2024 & 2032
List of Tables
- Table 1: Global UK Electric Bus Battery Pack Market Revenue Million Forecast, by Region 2019 & 2032
- Table 2: Global UK Electric Bus Battery Pack Market Revenue Million Forecast, by Propulsion Type 2019 & 2032
- Table 3: Global UK Electric Bus Battery Pack Market Revenue Million Forecast, by Battery Chemistry 2019 & 2032
- Table 4: Global UK Electric Bus Battery Pack Market Revenue Million Forecast, by Capacity 2019 & 2032
- Table 5: Global UK Electric Bus Battery Pack Market Revenue Million Forecast, by Battery Form 2019 & 2032
- Table 6: Global UK Electric Bus Battery Pack Market Revenue Million Forecast, by Method 2019 & 2032
- Table 7: Global UK Electric Bus Battery Pack Market Revenue Million Forecast, by Component 2019 & 2032
- Table 8: Global UK Electric Bus Battery Pack Market Revenue Million Forecast, by Material Type 2019 & 2032
- Table 9: Global UK Electric Bus Battery Pack Market Revenue Million Forecast, by Region 2019 & 2032
- Table 10: Global UK Electric Bus Battery Pack Market Revenue Million Forecast, by Country 2019 & 2032
- Table 11: England UK Electric Bus Battery Pack Market Revenue (Million) Forecast, by Application 2019 & 2032
- Table 12: Wales UK Electric Bus Battery Pack Market Revenue (Million) Forecast, by Application 2019 & 2032
- Table 13: Scotland UK Electric Bus Battery Pack Market Revenue (Million) Forecast, by Application 2019 & 2032
- Table 14: Northern UK Electric Bus Battery Pack Market Revenue (Million) Forecast, by Application 2019 & 2032
- Table 15: Ireland UK Electric Bus Battery Pack Market Revenue (Million) Forecast, by Application 2019 & 2032
- Table 16: Global UK Electric Bus Battery Pack Market Revenue Million Forecast, by Propulsion Type 2019 & 2032
- Table 17: Global UK Electric Bus Battery Pack Market Revenue Million Forecast, by Battery Chemistry 2019 & 2032
- Table 18: Global UK Electric Bus Battery Pack Market Revenue Million Forecast, by Capacity 2019 & 2032
- Table 19: Global UK Electric Bus Battery Pack Market Revenue Million Forecast, by Battery Form 2019 & 2032
- Table 20: Global UK Electric Bus Battery Pack Market Revenue Million Forecast, by Method 2019 & 2032
- Table 21: Global UK Electric Bus Battery Pack Market Revenue Million Forecast, by Component 2019 & 2032
- Table 22: Global UK Electric Bus Battery Pack Market Revenue Million Forecast, by Material Type 2019 & 2032
- Table 23: Global UK Electric Bus Battery Pack Market Revenue Million Forecast, by Country 2019 & 2032
- Table 24: United States UK Electric Bus Battery Pack Market Revenue (Million) Forecast, by Application 2019 & 2032
- Table 25: Canada UK Electric Bus Battery Pack Market Revenue (Million) Forecast, by Application 2019 & 2032
- Table 26: Mexico UK Electric Bus Battery Pack Market Revenue (Million) Forecast, by Application 2019 & 2032
- Table 27: Global UK Electric Bus Battery Pack Market Revenue Million Forecast, by Propulsion Type 2019 & 2032
- Table 28: Global UK Electric Bus Battery Pack Market Revenue Million Forecast, by Battery Chemistry 2019 & 2032
- Table 29: Global UK Electric Bus Battery Pack Market Revenue Million Forecast, by Capacity 2019 & 2032
- Table 30: Global UK Electric Bus Battery Pack Market Revenue Million Forecast, by Battery Form 2019 & 2032
- Table 31: Global UK Electric Bus Battery Pack Market Revenue Million Forecast, by Method 2019 & 2032
- Table 32: Global UK Electric Bus Battery Pack Market Revenue Million Forecast, by Component 2019 & 2032
- Table 33: Global UK Electric Bus Battery Pack Market Revenue Million Forecast, by Material Type 2019 & 2032
- Table 34: Global UK Electric Bus Battery Pack Market Revenue Million Forecast, by Country 2019 & 2032
- Table 35: Brazil UK Electric Bus Battery Pack Market Revenue (Million) Forecast, by Application 2019 & 2032
- Table 36: Argentina UK Electric Bus Battery Pack Market Revenue (Million) Forecast, by Application 2019 & 2032
- Table 37: Rest of South America UK Electric Bus Battery Pack Market Revenue (Million) Forecast, by Application 2019 & 2032
- Table 38: Global UK Electric Bus Battery Pack Market Revenue Million Forecast, by Propulsion Type 2019 & 2032
- Table 39: Global UK Electric Bus Battery Pack Market Revenue Million Forecast, by Battery Chemistry 2019 & 2032
- Table 40: Global UK Electric Bus Battery Pack Market Revenue Million Forecast, by Capacity 2019 & 2032
- Table 41: Global UK Electric Bus Battery Pack Market Revenue Million Forecast, by Battery Form 2019 & 2032
- Table 42: Global UK Electric Bus Battery Pack Market Revenue Million Forecast, by Method 2019 & 2032
- Table 43: Global UK Electric Bus Battery Pack Market Revenue Million Forecast, by Component 2019 & 2032
- Table 44: Global UK Electric Bus Battery Pack Market Revenue Million Forecast, by Material Type 2019 & 2032
- Table 45: Global UK Electric Bus Battery Pack Market Revenue Million Forecast, by Country 2019 & 2032
- Table 46: United Kingdom UK Electric Bus Battery Pack Market Revenue (Million) Forecast, by Application 2019 & 2032
- Table 47: Germany UK Electric Bus Battery Pack Market Revenue (Million) Forecast, by Application 2019 & 2032
- Table 48: France UK Electric Bus Battery Pack Market Revenue (Million) Forecast, by Application 2019 & 2032
- Table 49: Italy UK Electric Bus Battery Pack Market Revenue (Million) Forecast, by Application 2019 & 2032
- Table 50: Spain UK Electric Bus Battery Pack Market Revenue (Million) Forecast, by Application 2019 & 2032
- Table 51: Russia UK Electric Bus Battery Pack Market Revenue (Million) Forecast, by Application 2019 & 2032
- Table 52: Benelux UK Electric Bus Battery Pack Market Revenue (Million) Forecast, by Application 2019 & 2032
- Table 53: Nordics UK Electric Bus Battery Pack Market Revenue (Million) Forecast, by Application 2019 & 2032
- Table 54: Rest of Europe UK Electric Bus Battery Pack Market Revenue (Million) Forecast, by Application 2019 & 2032
- Table 55: Global UK Electric Bus Battery Pack Market Revenue Million Forecast, by Propulsion Type 2019 & 2032
- Table 56: Global UK Electric Bus Battery Pack Market Revenue Million Forecast, by Battery Chemistry 2019 & 2032
- Table 57: Global UK Electric Bus Battery Pack Market Revenue Million Forecast, by Capacity 2019 & 2032
- Table 58: Global UK Electric Bus Battery Pack Market Revenue Million Forecast, by Battery Form 2019 & 2032
- Table 59: Global UK Electric Bus Battery Pack Market Revenue Million Forecast, by Method 2019 & 2032
- Table 60: Global UK Electric Bus Battery Pack Market Revenue Million Forecast, by Component 2019 & 2032
- Table 61: Global UK Electric Bus Battery Pack Market Revenue Million Forecast, by Material Type 2019 & 2032
- Table 62: Global UK Electric Bus Battery Pack Market Revenue Million Forecast, by Country 2019 & 2032
- Table 63: Turkey UK Electric Bus Battery Pack Market Revenue (Million) Forecast, by Application 2019 & 2032
- Table 64: Israel UK Electric Bus Battery Pack Market Revenue (Million) Forecast, by Application 2019 & 2032
- Table 65: GCC UK Electric Bus Battery Pack Market Revenue (Million) Forecast, by Application 2019 & 2032
- Table 66: North Africa UK Electric Bus Battery Pack Market Revenue (Million) Forecast, by Application 2019 & 2032
- Table 67: South Africa UK Electric Bus Battery Pack Market Revenue (Million) Forecast, by Application 2019 & 2032
- Table 68: Rest of Middle East & Africa UK Electric Bus Battery Pack Market Revenue (Million) Forecast, by Application 2019 & 2032
- Table 69: Global UK Electric Bus Battery Pack Market Revenue Million Forecast, by Propulsion Type 2019 & 2032
- Table 70: Global UK Electric Bus Battery Pack Market Revenue Million Forecast, by Battery Chemistry 2019 & 2032
- Table 71: Global UK Electric Bus Battery Pack Market Revenue Million Forecast, by Capacity 2019 & 2032
- Table 72: Global UK Electric Bus Battery Pack Market Revenue Million Forecast, by Battery Form 2019 & 2032
- Table 73: Global UK Electric Bus Battery Pack Market Revenue Million Forecast, by Method 2019 & 2032
- Table 74: Global UK Electric Bus Battery Pack Market Revenue Million Forecast, by Component 2019 & 2032
- Table 75: Global UK Electric Bus Battery Pack Market Revenue Million Forecast, by Material Type 2019 & 2032
- Table 76: Global UK Electric Bus Battery Pack Market Revenue Million Forecast, by Country 2019 & 2032
- Table 77: China UK Electric Bus Battery Pack Market Revenue (Million) Forecast, by Application 2019 & 2032
- Table 78: India UK Electric Bus Battery Pack Market Revenue (Million) Forecast, by Application 2019 & 2032
- Table 79: Japan UK Electric Bus Battery Pack Market Revenue (Million) Forecast, by Application 2019 & 2032
- Table 80: South Korea UK Electric Bus Battery Pack Market Revenue (Million) Forecast, by Application 2019 & 2032
- Table 81: ASEAN UK Electric Bus Battery Pack Market Revenue (Million) Forecast, by Application 2019 & 2032
- Table 82: Oceania UK Electric Bus Battery Pack Market Revenue (Million) Forecast, by Application 2019 & 2032
- Table 83: Rest of Asia Pacific UK Electric Bus Battery Pack Market Revenue (Million) Forecast, by Application 2019 & 2032
Frequently Asked Questions
1. What is the projected Compound Annual Growth Rate (CAGR) of the UK Electric Bus Battery Pack Market?
The projected CAGR is approximately > 6.50%.
2. Which companies are prominent players in the UK Electric Bus Battery Pack Market?
Key companies in the market include Ilika Technolgies Ltd, Hyperdrive Innovation Holdings Ltd, Samsung SDI Co Ltd, LG Energy Solution Ltd, Power By Britishvolt Ltd, Contemporary Amperex Technology Co Ltd (CATL), BYD Company Ltd, Amte Power PLC, SK Innovation Co Ltd, Automotive Cells Company (ACC).
3. What are the main segments of the UK Electric Bus Battery Pack Market?
The market segments include Propulsion Type, Battery Chemistry, Capacity, Battery Form, Method, Component, Material Type.
4. Can you provide details about the market size?
The market size is estimated to be USD XX Million as of 2022.
5. What are some drivers contributing to market growth?
Increasing Demand and Sales of Commercial Vehicles is Driving the Market for Hydraulic Systems.
6. What are the notable trends driving market growth?
OTHER KEY INDUSTRY TRENDS COVERED IN THE REPORT.
7. Are there any restraints impacting market growth?
Increasing Replacement of Conventional Hydraulic Systems with Fully-electric Hydraulic Systems Acts as a Restraint.
8. Can you provide examples of recent developments in the market?
January 2023: Samsung SDI is reportedly considering building an electric vehicle battery joint venture with BMW, its largest customer, in Hungary.July 2022: Britishvolt and H&T Battery Components have signed a Memorandum of Understanding (MoU) for the supply of battery can components for high-tech battery cells used in automotive applications.June 2022: POSCO Chemical, Korea, has entered into an agreement for battery materials with Britishvolt. On June 30, POSCO Chemical signed an MoU with Britishvolt to develop and supply battery materials.
9. What pricing options are available for accessing the report?
Pricing options include single-user, multi-user, and enterprise licenses priced at USD 3800, USD 4500, and USD 5800 respectively.
10. Is the market size provided in terms of value or volume?
The market size is provided in terms of value, measured in Million.
11. Are there any specific market keywords associated with the report?
Yes, the market keyword associated with the report is "UK Electric Bus Battery Pack Market," which aids in identifying and referencing the specific market segment covered.
12. How do I determine which pricing option suits my needs best?
The pricing options vary based on user requirements and access needs. Individual users may opt for single-user licenses, while businesses requiring broader access may choose multi-user or enterprise licenses for cost-effective access to the report.
13. Are there any additional resources or data provided in the UK Electric Bus Battery Pack Market report?
While the report offers comprehensive insights, it's advisable to review the specific contents or supplementary materials provided to ascertain if additional resources or data are available.
14. How can I stay updated on further developments or reports in the UK Electric Bus Battery Pack Market?
To stay informed about further developments, trends, and reports in the UK Electric Bus Battery Pack Market, consider subscribing to industry newsletters, following relevant companies and organizations, or regularly checking reputable industry news sources and publications.
Methodology
Step 1 - Identification of Relevant Samples Size from Population Database


Step 2 - Approaches for Defining Global Market Size (Value, Volume* & Price*)

Note*: In applicable scenarios
Step 3 - Data Sources
Primary Research
- Web Analytics
- Survey Reports
- Research Institute
- Latest Research Reports
- Opinion Leaders
Secondary Research
- Annual Reports
- White Paper
- Latest Press Release
- Industry Association
- Paid Database
- Investor Presentations

Step 4 - Data Triangulation
Involves using different sources of information in order to increase the validity of a study
These sources are likely to be stakeholders in a program - participants, other researchers, program staff, other community members, and so on.
Then we put all data in single framework & apply various statistical tools to find out the dynamic on the market.
During the analysis stage, feedback from the stakeholder groups would be compared to determine areas of agreement as well as areas of divergence


