
Key Insights
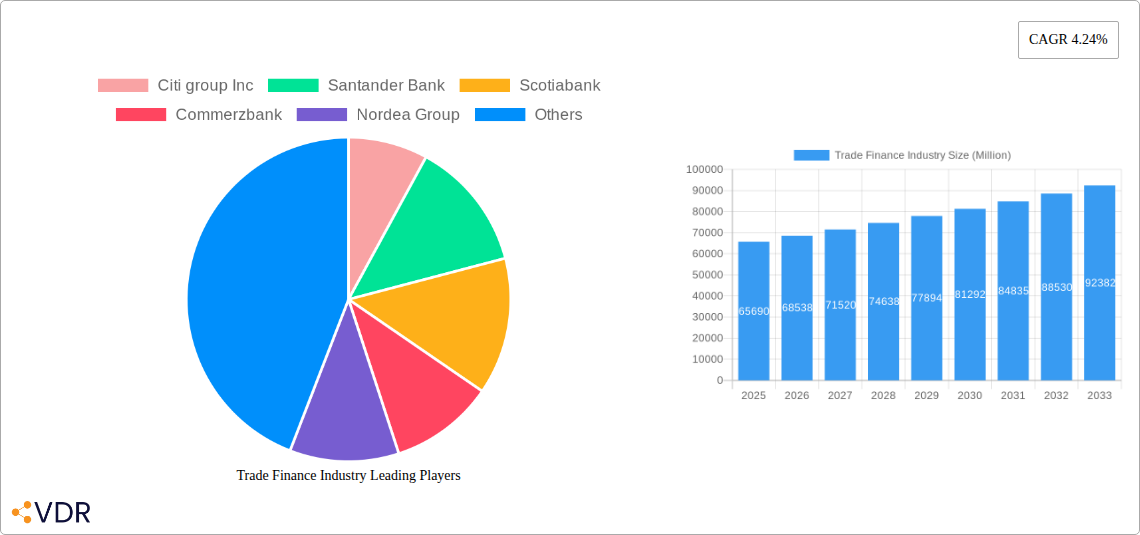
The global trade finance industry, valued at $65.69 billion in 2025, is projected to experience robust growth, driven by a compound annual growth rate (CAGR) of 4.24% from 2025 to 2033. This expansion is fueled by several key factors. Increased global trade, particularly among emerging markets, necessitates sophisticated financing solutions for international transactions. The rise of e-commerce and digitalization within the trade finance sector streamlines processes, reduces costs, and facilitates faster transactions, further stimulating growth. Furthermore, growing demand for supply chain finance solutions, which optimize cash flow for both buyers and sellers, contributes significantly to market expansion. The industry is also witnessing an increased focus on sustainability and responsible lending practices, influencing investment decisions and shaping future growth trajectories.
However, the industry also faces certain challenges. Geopolitical instability and trade wars can create uncertainty and disrupt global trade flows, impacting demand for trade finance services. Stringent regulatory compliance requirements and anti-money laundering (AML) regulations increase operational costs and complexity for financial institutions. Furthermore, intense competition among established players and the emergence of fintech companies offering alternative solutions pose ongoing challenges to market participants. Despite these headwinds, the long-term outlook for the trade finance industry remains positive, underpinned by the fundamental need for financing in international commerce and ongoing technological advancements. Key players like Citigroup, Santander Bank, and others are strategically adapting to these changes through innovation and diversification to maintain their market positions.
Trade Finance Industry Market Report: 2019-2033
This comprehensive report provides an in-depth analysis of the global trade finance industry, encompassing market dynamics, growth trends, key players, and future outlook. The study period covers 2019-2033, with 2025 as the base and estimated year. The report segments the market by various parameters, offering granular insights for informed decision-making. The parent market is global finance and the child market is trade finance. Market value is presented in million units.
Trade Finance Industry Market Dynamics & Structure
This section analyzes the market concentration, technological innovation, regulatory landscape, competitive dynamics, end-user demographics, and merger & acquisition (M&A) activity within the trade finance industry. The global trade finance market, valued at xx million in 2024, is expected to reach xx million by 2033, exhibiting a CAGR of xx%.
- Market Concentration: The market is moderately concentrated, with a few major players holding significant market share. Citigroup Inc., Santander Bank, and Standard Chartered Bank are among the leading players, collectively controlling an estimated xx% of the market in 2024.
- Technological Innovation: Blockchain technology, AI, and big data analytics are transforming trade finance processes, improving efficiency and transparency. However, integration challenges and cybersecurity concerns remain barriers to widespread adoption.
- Regulatory Frameworks: Stringent regulatory compliance requirements (e.g., KYC/AML) and evolving trade policies significantly impact market operations. Regional variations in regulatory frameworks create complexities for international trade finance operations.
- Competitive Landscape: Intense competition exists among traditional banks and emerging fintech players. The emergence of fintech companies offering innovative solutions is disrupting the traditional market landscape.
- M&A Activity: The trade finance sector has witnessed a moderate level of M&A activity in recent years, driven by consolidation and expansion strategies. An estimated xx M&A deals were recorded between 2019 and 2024, with a total transaction value of approximately xx million.
- End-User Demographics: The end-users are diverse, ranging from large multinational corporations to SMEs and individual traders. The increasing participation of SMEs is driving demand for innovative and accessible trade finance solutions.
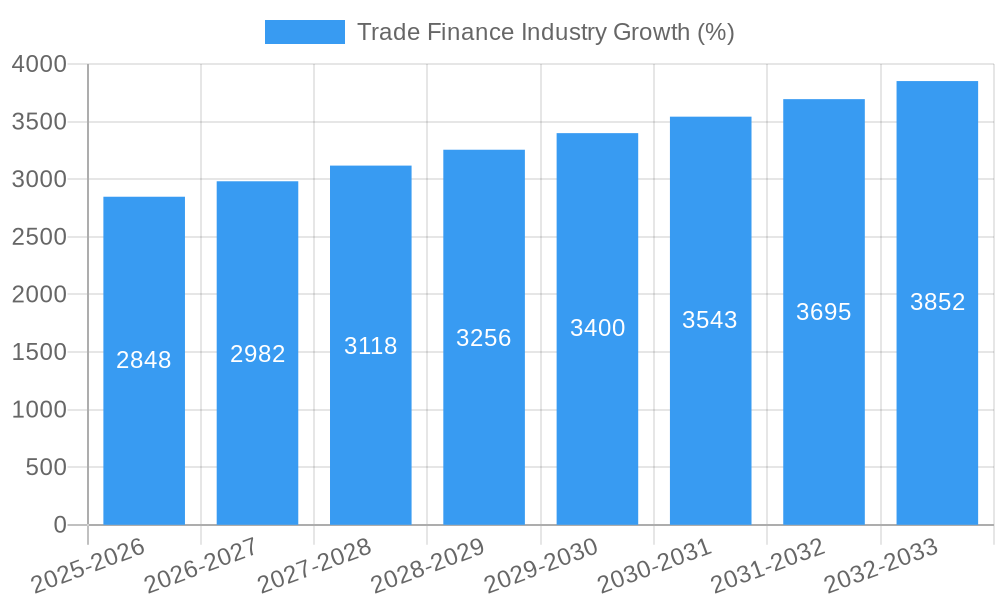
Trade Finance Industry Growth Trends & Insights
This section analyzes the evolution of market size, adoption rates, technological disruptions, and shifts in consumer behavior within the trade finance industry. Utilizing various data sources, including market research reports and financial statements, this section offers insights into growth drivers, market penetration, and future growth prospects. The global trade finance market demonstrates a steady growth trajectory, fueled by increasing global trade volumes and the growing adoption of digital technologies.
The market exhibited a CAGR of xx% during the historical period (2019-2024). This growth is primarily driven by factors like increased global trade, rising demand from SMEs, and the growing adoption of digital trade finance solutions. Market penetration of digital trade finance solutions is expected to increase from xx% in 2024 to xx% by 2033. The shift towards digital platforms is improving efficiency, reducing costs, and enhancing transparency in trade finance operations. Consumer behavior is evolving with increased preference for digital solutions, streamlined processes, and enhanced security features.
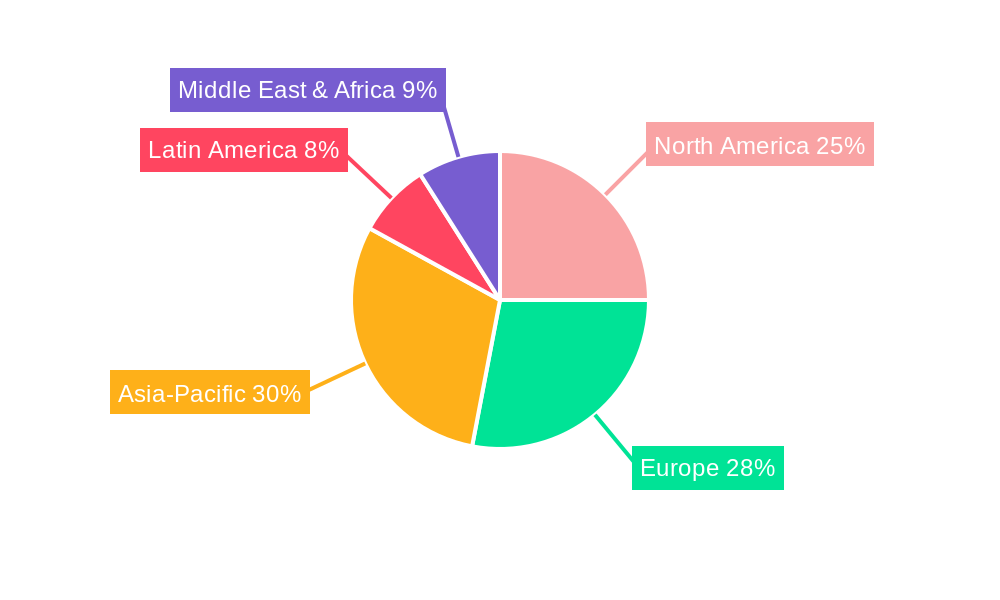
Dominant Regions, Countries, or Segments in Trade Finance Industry
This section identifies the leading regions, countries, or segments driving market growth in the trade finance industry. Asia-Pacific is expected to remain the dominant region, driven by robust economic growth, increasing trade volumes, and the expanding middle class.
- Asia-Pacific: The region accounts for the largest market share due to high economic growth, expanding trade, and a large number of SMEs. China and India are key drivers within this region.
- North America: North America is another significant market, exhibiting a stable growth trajectory driven by the robust performance of large multinational corporations.
- Europe: Europe's trade finance market is characterized by regulatory scrutiny and a focus on sustainable trade practices.
- Key Drivers:
- Strong economic growth in emerging economies
- Increasing global trade volumes
- Government initiatives supporting trade finance
- Technological advancements facilitating trade operations
- Dominance Factors:
- High trade volumes
- Favorable regulatory environment
- Strong presence of major financial institutions
- Robust digital infrastructure
Trade Finance Industry Product Landscape
The trade finance industry offers a diverse range of products, including letters of credit, guarantees, factoring, forfaiting, and supply chain finance. Recent innovations include the integration of blockchain technology to enhance security and transparency, and the development of specialized products for SMEs and sustainable trade initiatives. These products offer unique selling propositions such as reduced processing time, lower costs, and improved risk management. Technological advancements, like AI-powered credit assessment and automated document processing, are continuously improving product efficiency and reach.
Key Drivers, Barriers & Challenges in Trade Finance Industry
Key Drivers: The primary drivers include increasing globalization, rising cross-border trade, and the growing demand for efficient trade financing solutions among SMEs. Technological advancements, such as blockchain and AI, are further enhancing efficiency and security. Government initiatives promoting international trade also contribute significantly.
Key Challenges & Restraints: Challenges include regulatory complexities, cybersecurity threats, and the need for robust KYC/AML compliance measures. Supply chain disruptions, geopolitical uncertainties, and fluctuating exchange rates also pose significant risks. The high cost of trade finance can hinder access for SMEs, further limiting market growth.
Emerging Opportunities in Trade Finance Industry
Emerging opportunities lie in untapped markets, particularly in developing economies with expanding trade volumes. Innovative applications of technology, such as blockchain and AI, offer opportunities for enhanced efficiency, transparency, and risk management. The growing demand for sustainable trade finance solutions presents a significant opportunity for financial institutions to support environmentally and socially responsible businesses. Furthermore, the integration of trade finance with other financial services can create new revenue streams and enhance customer offerings.
Growth Accelerators in the Trade Finance Industry
Long-term growth will be accelerated by technological advancements, particularly the wider adoption of blockchain and AI to streamline processes and reduce costs. Strategic partnerships between traditional banks and fintech companies will foster innovation and expand market reach. Expanding into untapped markets, particularly in developing economies, will offer significant growth potential. Finally, initiatives promoting sustainable trade finance will drive demand for responsible and ethical financial solutions.
Key Players Shaping the Trade Finance Industry Market
- Citigroup Inc.
- Santander Bank
- Scotiabank
- Commerzbank
- Nordea Group
- Unicredit
- Standard Chartered Bank
- Arab Bank
- Societe Generale
- Rand Merchant Bank
- Rabobank
- China Construction Bank
- BNP Paribas (List Not Exhaustive)
Notable Milestones in Trade Finance Industry Sector
- September 2023: Standard Chartered Bank launched a sustainable trade loan offering for financial institutions, promoting liquidity for sustainable development projects.
- April 2022: The Asian Development Bank partnered with Axis Bank Limited in a USD 150 million deal to expand supply chain financing for SMEs, focusing on impact sectors.
In-Depth Trade Finance Industry Market Outlook
The future of the trade finance industry is bright, driven by continued globalization, technological innovation, and the increasing demand for efficient and transparent trade finance solutions. Strategic partnerships and expansion into new markets will be crucial for long-term success. The focus on sustainable and responsible trade finance will shape the industry's future, creating opportunities for growth and positive impact. The market is poised for significant expansion, driven by the factors mentioned above, promising attractive returns for investors and innovative players alike.
Trade Finance Industry Segmentation
-
1. Service Provider
- 1.1. Banks
- 1.2. Trade Finance Companies
- 1.3. Insurance Companies
Trade Finance Industry Segmentation By Geography
-
1. North America
- 1.1. US
- 1.2. Canada
- 1.3. Mexico
- 1.4. Rest of North America
-
2. Europe
- 2.1. Germany
- 2.2. UK
- 2.3. France
- 2.4. Russia
- 2.5. Spain
- 2.6. Rest of Europe
-
3. Asia Pacific
- 3.1. India
- 3.2. China
- 3.3. Japan
- 3.4. Rest of Asia Pacific
-
4. South America
- 4.1. Brazil
- 4.2. Argentina
-
5. Middle East And Africa
- 5.1. UAE
- 5.2. Saudi Arabia
- 5.3. Rest of Middle East And Africa
Trade Finance Industry REPORT HIGHLIGHTS
| Aspects | Details |
|---|---|
| Study Period | 2019-2033 |
| Base Year | 2024 |
| Estimated Year | 2025 |
| Forecast Period | 2025-2033 |
| Historical Period | 2019-2024 |
| Growth Rate | CAGR of 4.24% from 2019-2033 |
| Segmentation |
|
Table of Contents
- 1. Introduction
- 1.1. Research Scope
- 1.2. Market Segmentation
- 1.3. Research Methodology
- 1.4. Definitions and Assumptions
- 2. Executive Summary
- 2.1. Introduction
- 3. Market Dynamics
- 3.1. Introduction
- 3.2. Market Drivers
- 3.2.1. Rise In Global Trade Drives The Market; Increasing Investments And Innovations In Fintech Drives The Market
- 3.3. Market Restrains
- 3.3.1. Rise In Global Trade Drives The Market; Increasing Investments And Innovations In Fintech Drives The Market
- 3.4. Market Trends
- 3.4.1. Globalization And Increased International Trade Drives the Market
- 4. Market Factor Analysis
- 4.1. Porters Five Forces
- 4.2. Supply/Value Chain
- 4.3. PESTEL analysis
- 4.4. Market Entropy
- 4.5. Patent/Trademark Analysis
- 5. Global Trade Finance Industry Analysis, Insights and Forecast, 2019-2031
- 5.1. Market Analysis, Insights and Forecast - by Service Provider
- 5.1.1. Banks
- 5.1.2. Trade Finance Companies
- 5.1.3. Insurance Companies
- 5.2. Market Analysis, Insights and Forecast - by Region
- 5.2.1. North America
- 5.2.2. Europe
- 5.2.3. Asia Pacific
- 5.2.4. South America
- 5.2.5. Middle East And Africa
- 5.1. Market Analysis, Insights and Forecast - by Service Provider
- 6. North America Trade Finance Industry Analysis, Insights and Forecast, 2019-2031
- 6.1. Market Analysis, Insights and Forecast - by Service Provider
- 6.1.1. Banks
- 6.1.2. Trade Finance Companies
- 6.1.3. Insurance Companies
- 6.1. Market Analysis, Insights and Forecast - by Service Provider
- 7. Europe Trade Finance Industry Analysis, Insights and Forecast, 2019-2031
- 7.1. Market Analysis, Insights and Forecast - by Service Provider
- 7.1.1. Banks
- 7.1.2. Trade Finance Companies
- 7.1.3. Insurance Companies
- 7.1. Market Analysis, Insights and Forecast - by Service Provider
- 8. Asia Pacific Trade Finance Industry Analysis, Insights and Forecast, 2019-2031
- 8.1. Market Analysis, Insights and Forecast - by Service Provider
- 8.1.1. Banks
- 8.1.2. Trade Finance Companies
- 8.1.3. Insurance Companies
- 8.1. Market Analysis, Insights and Forecast - by Service Provider
- 9. South America Trade Finance Industry Analysis, Insights and Forecast, 2019-2031
- 9.1. Market Analysis, Insights and Forecast - by Service Provider
- 9.1.1. Banks
- 9.1.2. Trade Finance Companies
- 9.1.3. Insurance Companies
- 9.1. Market Analysis, Insights and Forecast - by Service Provider
- 10. Middle East And Africa Trade Finance Industry Analysis, Insights and Forecast, 2019-2031
- 10.1. Market Analysis, Insights and Forecast - by Service Provider
- 10.1.1. Banks
- 10.1.2. Trade Finance Companies
- 10.1.3. Insurance Companies
- 10.1. Market Analysis, Insights and Forecast - by Service Provider
- 11. Competitive Analysis
- 11.1. Global Market Share Analysis 2024
- 11.2. Company Profiles
- 11.2.1 Citi group Inc
- 11.2.1.1. Overview
- 11.2.1.2. Products
- 11.2.1.3. SWOT Analysis
- 11.2.1.4. Recent Developments
- 11.2.1.5. Financials (Based on Availability)
- 11.2.2 Santander Bank
- 11.2.2.1. Overview
- 11.2.2.2. Products
- 11.2.2.3. SWOT Analysis
- 11.2.2.4. Recent Developments
- 11.2.2.5. Financials (Based on Availability)
- 11.2.3 Scotiabank
- 11.2.3.1. Overview
- 11.2.3.2. Products
- 11.2.3.3. SWOT Analysis
- 11.2.3.4. Recent Developments
- 11.2.3.5. Financials (Based on Availability)
- 11.2.4 Commerzbank
- 11.2.4.1. Overview
- 11.2.4.2. Products
- 11.2.4.3. SWOT Analysis
- 11.2.4.4. Recent Developments
- 11.2.4.5. Financials (Based on Availability)
- 11.2.5 Nordea Group
- 11.2.5.1. Overview
- 11.2.5.2. Products
- 11.2.5.3. SWOT Analysis
- 11.2.5.4. Recent Developments
- 11.2.5.5. Financials (Based on Availability)
- 11.2.6 Unicredit
- 11.2.6.1. Overview
- 11.2.6.2. Products
- 11.2.6.3. SWOT Analysis
- 11.2.6.4. Recent Developments
- 11.2.6.5. Financials (Based on Availability)
- 11.2.7 Standard Chartered Bank
- 11.2.7.1. Overview
- 11.2.7.2. Products
- 11.2.7.3. SWOT Analysis
- 11.2.7.4. Recent Developments
- 11.2.7.5. Financials (Based on Availability)
- 11.2.8 Arab Bank
- 11.2.8.1. Overview
- 11.2.8.2. Products
- 11.2.8.3. SWOT Analysis
- 11.2.8.4. Recent Developments
- 11.2.8.5. Financials (Based on Availability)
- 11.2.9 Societe Generale
- 11.2.9.1. Overview
- 11.2.9.2. Products
- 11.2.9.3. SWOT Analysis
- 11.2.9.4. Recent Developments
- 11.2.9.5. Financials (Based on Availability)
- 11.2.10 Rand Merchant Bank
- 11.2.10.1. Overview
- 11.2.10.2. Products
- 11.2.10.3. SWOT Analysis
- 11.2.10.4. Recent Developments
- 11.2.10.5. Financials (Based on Availability)
- 11.2.11 Rabobank
- 11.2.11.1. Overview
- 11.2.11.2. Products
- 11.2.11.3. SWOT Analysis
- 11.2.11.4. Recent Developments
- 11.2.11.5. Financials (Based on Availability)
- 11.2.12 China Construction Bank
- 11.2.12.1. Overview
- 11.2.12.2. Products
- 11.2.12.3. SWOT Analysis
- 11.2.12.4. Recent Developments
- 11.2.12.5. Financials (Based on Availability)
- 11.2.13 BNP Paribas**List Not Exhaustive
- 11.2.13.1. Overview
- 11.2.13.2. Products
- 11.2.13.3. SWOT Analysis
- 11.2.13.4. Recent Developments
- 11.2.13.5. Financials (Based on Availability)
- 11.2.1 Citi group Inc
List of Figures
- Figure 1: Global Trade Finance Industry Revenue Breakdown (Million, %) by Region 2024 & 2032
- Figure 2: Global Trade Finance Industry Volume Breakdown (Billion, %) by Region 2024 & 2032
- Figure 3: North America Trade Finance Industry Revenue (Million), by Service Provider 2024 & 2032
- Figure 4: North America Trade Finance Industry Volume (Billion), by Service Provider 2024 & 2032
- Figure 5: North America Trade Finance Industry Revenue Share (%), by Service Provider 2024 & 2032
- Figure 6: North America Trade Finance Industry Volume Share (%), by Service Provider 2024 & 2032
- Figure 7: North America Trade Finance Industry Revenue (Million), by Country 2024 & 2032
- Figure 8: North America Trade Finance Industry Volume (Billion), by Country 2024 & 2032
- Figure 9: North America Trade Finance Industry Revenue Share (%), by Country 2024 & 2032
- Figure 10: North America Trade Finance Industry Volume Share (%), by Country 2024 & 2032
- Figure 11: Europe Trade Finance Industry Revenue (Million), by Service Provider 2024 & 2032
- Figure 12: Europe Trade Finance Industry Volume (Billion), by Service Provider 2024 & 2032
- Figure 13: Europe Trade Finance Industry Revenue Share (%), by Service Provider 2024 & 2032
- Figure 14: Europe Trade Finance Industry Volume Share (%), by Service Provider 2024 & 2032
- Figure 15: Europe Trade Finance Industry Revenue (Million), by Country 2024 & 2032
- Figure 16: Europe Trade Finance Industry Volume (Billion), by Country 2024 & 2032
- Figure 17: Europe Trade Finance Industry Revenue Share (%), by Country 2024 & 2032
- Figure 18: Europe Trade Finance Industry Volume Share (%), by Country 2024 & 2032
- Figure 19: Asia Pacific Trade Finance Industry Revenue (Million), by Service Provider 2024 & 2032
- Figure 20: Asia Pacific Trade Finance Industry Volume (Billion), by Service Provider 2024 & 2032
- Figure 21: Asia Pacific Trade Finance Industry Revenue Share (%), by Service Provider 2024 & 2032
- Figure 22: Asia Pacific Trade Finance Industry Volume Share (%), by Service Provider 2024 & 2032
- Figure 23: Asia Pacific Trade Finance Industry Revenue (Million), by Country 2024 & 2032
- Figure 24: Asia Pacific Trade Finance Industry Volume (Billion), by Country 2024 & 2032
- Figure 25: Asia Pacific Trade Finance Industry Revenue Share (%), by Country 2024 & 2032
- Figure 26: Asia Pacific Trade Finance Industry Volume Share (%), by Country 2024 & 2032
- Figure 27: South America Trade Finance Industry Revenue (Million), by Service Provider 2024 & 2032
- Figure 28: South America Trade Finance Industry Volume (Billion), by Service Provider 2024 & 2032
- Figure 29: South America Trade Finance Industry Revenue Share (%), by Service Provider 2024 & 2032
- Figure 30: South America Trade Finance Industry Volume Share (%), by Service Provider 2024 & 2032
- Figure 31: South America Trade Finance Industry Revenue (Million), by Country 2024 & 2032
- Figure 32: South America Trade Finance Industry Volume (Billion), by Country 2024 & 2032
- Figure 33: South America Trade Finance Industry Revenue Share (%), by Country 2024 & 2032
- Figure 34: South America Trade Finance Industry Volume Share (%), by Country 2024 & 2032
- Figure 35: Middle East And Africa Trade Finance Industry Revenue (Million), by Service Provider 2024 & 2032
- Figure 36: Middle East And Africa Trade Finance Industry Volume (Billion), by Service Provider 2024 & 2032
- Figure 37: Middle East And Africa Trade Finance Industry Revenue Share (%), by Service Provider 2024 & 2032
- Figure 38: Middle East And Africa Trade Finance Industry Volume Share (%), by Service Provider 2024 & 2032
- Figure 39: Middle East And Africa Trade Finance Industry Revenue (Million), by Country 2024 & 2032
- Figure 40: Middle East And Africa Trade Finance Industry Volume (Billion), by Country 2024 & 2032
- Figure 41: Middle East And Africa Trade Finance Industry Revenue Share (%), by Country 2024 & 2032
- Figure 42: Middle East And Africa Trade Finance Industry Volume Share (%), by Country 2024 & 2032
List of Tables
- Table 1: Global Trade Finance Industry Revenue Million Forecast, by Region 2019 & 2032
- Table 2: Global Trade Finance Industry Volume Billion Forecast, by Region 2019 & 2032
- Table 3: Global Trade Finance Industry Revenue Million Forecast, by Service Provider 2019 & 2032
- Table 4: Global Trade Finance Industry Volume Billion Forecast, by Service Provider 2019 & 2032
- Table 5: Global Trade Finance Industry Revenue Million Forecast, by Region 2019 & 2032
- Table 6: Global Trade Finance Industry Volume Billion Forecast, by Region 2019 & 2032
- Table 7: Global Trade Finance Industry Revenue Million Forecast, by Service Provider 2019 & 2032
- Table 8: Global Trade Finance Industry Volume Billion Forecast, by Service Provider 2019 & 2032
- Table 9: Global Trade Finance Industry Revenue Million Forecast, by Country 2019 & 2032
- Table 10: Global Trade Finance Industry Volume Billion Forecast, by Country 2019 & 2032
- Table 11: US Trade Finance Industry Revenue (Million) Forecast, by Application 2019 & 2032
- Table 12: US Trade Finance Industry Volume (Billion) Forecast, by Application 2019 & 2032
- Table 13: Canada Trade Finance Industry Revenue (Million) Forecast, by Application 2019 & 2032
- Table 14: Canada Trade Finance Industry Volume (Billion) Forecast, by Application 2019 & 2032
- Table 15: Mexico Trade Finance Industry Revenue (Million) Forecast, by Application 2019 & 2032
- Table 16: Mexico Trade Finance Industry Volume (Billion) Forecast, by Application 2019 & 2032
- Table 17: Rest of North America Trade Finance Industry Revenue (Million) Forecast, by Application 2019 & 2032
- Table 18: Rest of North America Trade Finance Industry Volume (Billion) Forecast, by Application 2019 & 2032
- Table 19: Global Trade Finance Industry Revenue Million Forecast, by Service Provider 2019 & 2032
- Table 20: Global Trade Finance Industry Volume Billion Forecast, by Service Provider 2019 & 2032
- Table 21: Global Trade Finance Industry Revenue Million Forecast, by Country 2019 & 2032
- Table 22: Global Trade Finance Industry Volume Billion Forecast, by Country 2019 & 2032
- Table 23: Germany Trade Finance Industry Revenue (Million) Forecast, by Application 2019 & 2032
- Table 24: Germany Trade Finance Industry Volume (Billion) Forecast, by Application 2019 & 2032
- Table 25: UK Trade Finance Industry Revenue (Million) Forecast, by Application 2019 & 2032
- Table 26: UK Trade Finance Industry Volume (Billion) Forecast, by Application 2019 & 2032
- Table 27: France Trade Finance Industry Revenue (Million) Forecast, by Application 2019 & 2032
- Table 28: France Trade Finance Industry Volume (Billion) Forecast, by Application 2019 & 2032
- Table 29: Russia Trade Finance Industry Revenue (Million) Forecast, by Application 2019 & 2032
- Table 30: Russia Trade Finance Industry Volume (Billion) Forecast, by Application 2019 & 2032
- Table 31: Spain Trade Finance Industry Revenue (Million) Forecast, by Application 2019 & 2032
- Table 32: Spain Trade Finance Industry Volume (Billion) Forecast, by Application 2019 & 2032
- Table 33: Rest of Europe Trade Finance Industry Revenue (Million) Forecast, by Application 2019 & 2032
- Table 34: Rest of Europe Trade Finance Industry Volume (Billion) Forecast, by Application 2019 & 2032
- Table 35: Global Trade Finance Industry Revenue Million Forecast, by Service Provider 2019 & 2032
- Table 36: Global Trade Finance Industry Volume Billion Forecast, by Service Provider 2019 & 2032
- Table 37: Global Trade Finance Industry Revenue Million Forecast, by Country 2019 & 2032
- Table 38: Global Trade Finance Industry Volume Billion Forecast, by Country 2019 & 2032
- Table 39: India Trade Finance Industry Revenue (Million) Forecast, by Application 2019 & 2032
- Table 40: India Trade Finance Industry Volume (Billion) Forecast, by Application 2019 & 2032
- Table 41: China Trade Finance Industry Revenue (Million) Forecast, by Application 2019 & 2032
- Table 42: China Trade Finance Industry Volume (Billion) Forecast, by Application 2019 & 2032
- Table 43: Japan Trade Finance Industry Revenue (Million) Forecast, by Application 2019 & 2032
- Table 44: Japan Trade Finance Industry Volume (Billion) Forecast, by Application 2019 & 2032
- Table 45: Rest of Asia Pacific Trade Finance Industry Revenue (Million) Forecast, by Application 2019 & 2032
- Table 46: Rest of Asia Pacific Trade Finance Industry Volume (Billion) Forecast, by Application 2019 & 2032
- Table 47: Global Trade Finance Industry Revenue Million Forecast, by Service Provider 2019 & 2032
- Table 48: Global Trade Finance Industry Volume Billion Forecast, by Service Provider 2019 & 2032
- Table 49: Global Trade Finance Industry Revenue Million Forecast, by Country 2019 & 2032
- Table 50: Global Trade Finance Industry Volume Billion Forecast, by Country 2019 & 2032
- Table 51: Brazil Trade Finance Industry Revenue (Million) Forecast, by Application 2019 & 2032
- Table 52: Brazil Trade Finance Industry Volume (Billion) Forecast, by Application 2019 & 2032
- Table 53: Argentina Trade Finance Industry Revenue (Million) Forecast, by Application 2019 & 2032
- Table 54: Argentina Trade Finance Industry Volume (Billion) Forecast, by Application 2019 & 2032
- Table 55: Global Trade Finance Industry Revenue Million Forecast, by Service Provider 2019 & 2032
- Table 56: Global Trade Finance Industry Volume Billion Forecast, by Service Provider 2019 & 2032
- Table 57: Global Trade Finance Industry Revenue Million Forecast, by Country 2019 & 2032
- Table 58: Global Trade Finance Industry Volume Billion Forecast, by Country 2019 & 2032
- Table 59: UAE Trade Finance Industry Revenue (Million) Forecast, by Application 2019 & 2032
- Table 60: UAE Trade Finance Industry Volume (Billion) Forecast, by Application 2019 & 2032
- Table 61: Saudi Arabia Trade Finance Industry Revenue (Million) Forecast, by Application 2019 & 2032
- Table 62: Saudi Arabia Trade Finance Industry Volume (Billion) Forecast, by Application 2019 & 2032
- Table 63: Rest of Middle East And Africa Trade Finance Industry Revenue (Million) Forecast, by Application 2019 & 2032
- Table 64: Rest of Middle East And Africa Trade Finance Industry Volume (Billion) Forecast, by Application 2019 & 2032
Frequently Asked Questions
1. What is the projected Compound Annual Growth Rate (CAGR) of the Trade Finance Industry?
The projected CAGR is approximately 4.24%.
2. Which companies are prominent players in the Trade Finance Industry?
Key companies in the market include Citi group Inc, Santander Bank, Scotiabank, Commerzbank, Nordea Group, Unicredit, Standard Chartered Bank, Arab Bank, Societe Generale, Rand Merchant Bank, Rabobank, China Construction Bank, BNP Paribas**List Not Exhaustive.
3. What are the main segments of the Trade Finance Industry?
The market segments include Service Provider.
4. Can you provide details about the market size?
The market size is estimated to be USD 65.69 Million as of 2022.
5. What are some drivers contributing to market growth?
Rise In Global Trade Drives The Market; Increasing Investments And Innovations In Fintech Drives The Market.
6. What are the notable trends driving market growth?
Globalization And Increased International Trade Drives the Market.
7. Are there any restraints impacting market growth?
Rise In Global Trade Drives The Market; Increasing Investments And Innovations In Fintech Drives The Market.
8. Can you provide examples of recent developments in the market?
September 2023 - Standard Chartered Bank, a multinational bank, launched a sustainable trade loan offering for financial institutions. It will assist financial institutions in providing liquidity associated with sustainable development in the most needed areas.
9. What pricing options are available for accessing the report?
Pricing options include single-user, multi-user, and enterprise licenses priced at USD 4750, USD 5250, and USD 8750 respectively.
10. Is the market size provided in terms of value or volume?
The market size is provided in terms of value, measured in Million and volume, measured in Billion.
11. Are there any specific market keywords associated with the report?
Yes, the market keyword associated with the report is "Trade Finance Industry," which aids in identifying and referencing the specific market segment covered.
12. How do I determine which pricing option suits my needs best?
The pricing options vary based on user requirements and access needs. Individual users may opt for single-user licenses, while businesses requiring broader access may choose multi-user or enterprise licenses for cost-effective access to the report.
13. Are there any additional resources or data provided in the Trade Finance Industry report?
While the report offers comprehensive insights, it's advisable to review the specific contents or supplementary materials provided to ascertain if additional resources or data are available.
14. How can I stay updated on further developments or reports in the Trade Finance Industry?
To stay informed about further developments, trends, and reports in the Trade Finance Industry, consider subscribing to industry newsletters, following relevant companies and organizations, or regularly checking reputable industry news sources and publications.
Methodology
Step 1 - Identification of Relevant Samples Size from Population Database


Step 2 - Approaches for Defining Global Market Size (Value, Volume* & Price*)

Note*: In applicable scenarios
Step 3 - Data Sources
Primary Research
- Web Analytics
- Survey Reports
- Research Institute
- Latest Research Reports
- Opinion Leaders
Secondary Research
- Annual Reports
- White Paper
- Latest Press Release
- Industry Association
- Paid Database
- Investor Presentations

Step 4 - Data Triangulation
Involves using different sources of information in order to increase the validity of a study
These sources are likely to be stakeholders in a program - participants, other researchers, program staff, other community members, and so on.
Then we put all data in single framework & apply various statistical tools to find out the dynamic on the market.
During the analysis stage, feedback from the stakeholder groups would be compared to determine areas of agreement as well as areas of divergence


