
Key Insights
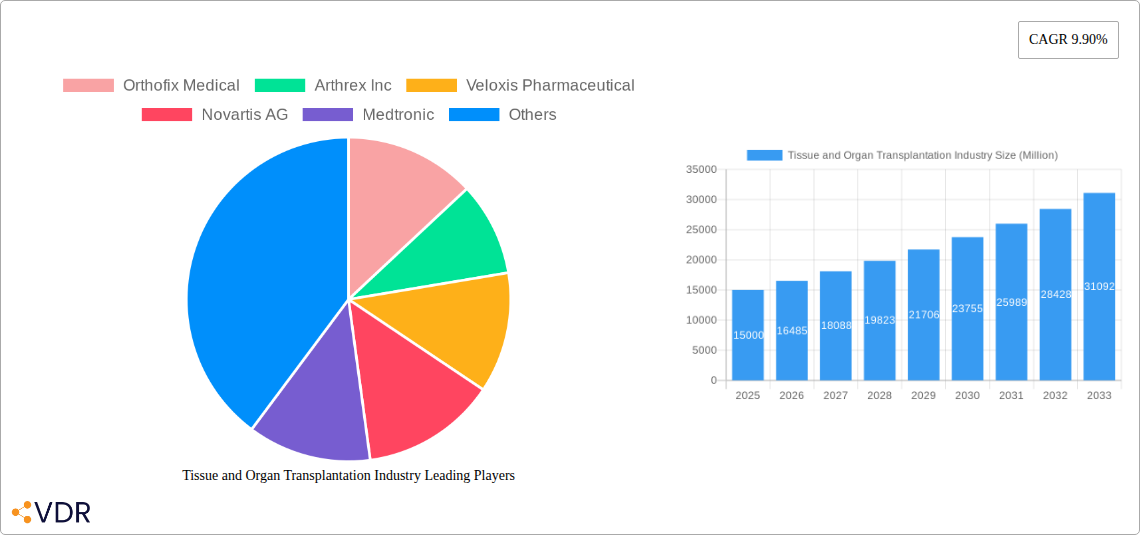
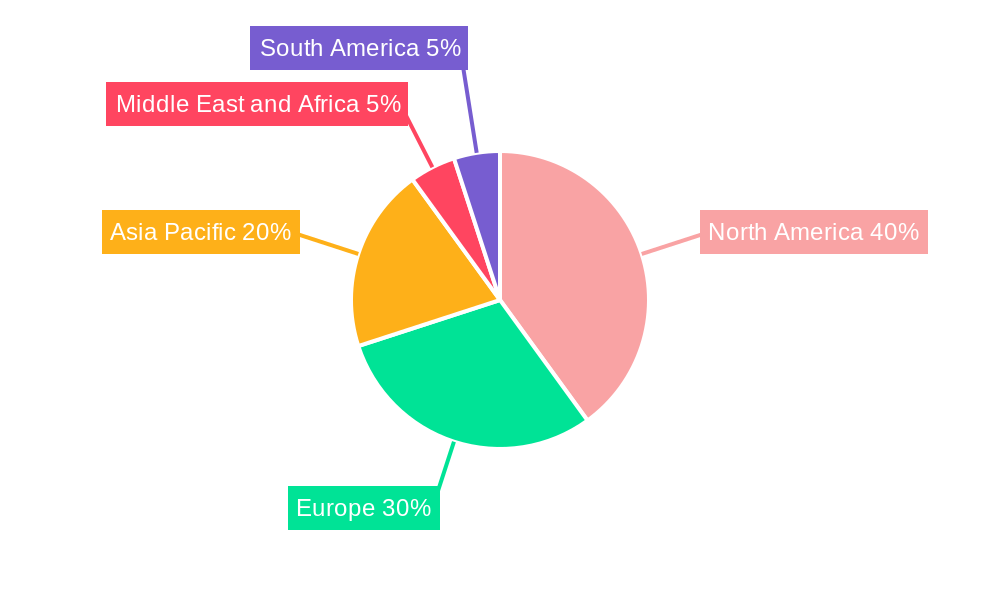
The global tissue and organ transplantation market is experiencing robust growth, projected to reach a substantial size driven by several key factors. The increasing prevalence of chronic diseases like diabetes and cardiovascular ailments is leading to a surge in the demand for organ transplants. Simultaneously, advancements in surgical techniques, improved preservation solutions, and the development of innovative immunosuppressive drugs are significantly enhancing transplantation success rates and patient outcomes. The expanding geriatric population, coupled with rising healthcare expenditure in developed and developing nations, further fuels market expansion. While the shortage of donor organs remains a significant constraint, initiatives promoting organ donation awareness and advancements in xenotransplantation (using animal organs) are gradually mitigating this challenge. The market is segmented by end-use (hospitals, transplant centers, others), product type (tissue products, immunosuppressant drugs, preservation solutions), and application (organ transplantation, tissue transplantation). North America and Europe currently hold dominant market shares due to well-established healthcare infrastructure and higher adoption rates of advanced transplantation technologies. However, Asia-Pacific is witnessing significant growth, driven by rising disposable incomes and increasing awareness about transplantation procedures. Competition among established players like Medtronic, Novartis, and AbbVie, along with emerging biotech companies focusing on innovative solutions, is shaping market dynamics and fostering innovation.
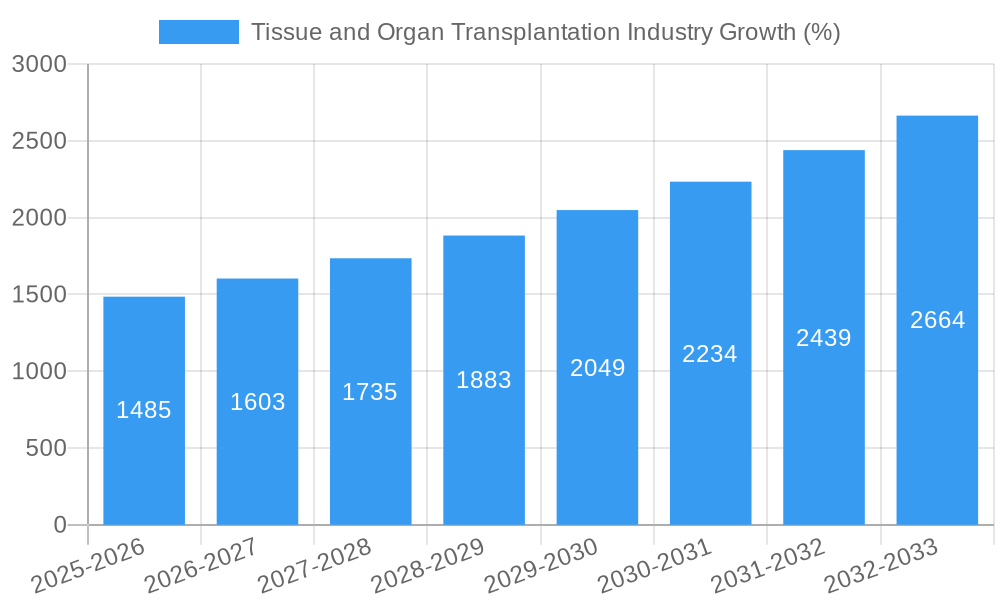
The forecast period (2025-2033) anticipates continued market expansion at a Compound Annual Growth Rate (CAGR) of 9.90%. This growth will be fueled by the factors mentioned above, alongside ongoing research and development efforts focused on improving organ preservation techniques, reducing rejection rates, and developing new immunosuppressants with fewer side effects. Specific segments within the market are projected to demonstrate varying growth trajectories. For instance, the demand for immunosuppressive drugs is anticipated to remain strong due to their critical role in preventing transplant rejection, while the tissue transplantation segment is poised for growth driven by advancements in tissue engineering and regenerative medicine. Geographical expansion, particularly in emerging economies, presents considerable growth opportunities for market participants. Strategic partnerships, mergers and acquisitions, and the development of innovative product offerings will be crucial for companies aiming to capitalize on this growing market.
Tissue and Organ Transplantation Industry Market Report: 2019-2033
This comprehensive report provides a detailed analysis of the Tissue and Organ Transplantation industry, encompassing market dynamics, growth trends, regional insights, product landscapes, and key player strategies. The study period covers 2019-2033, with a base year of 2025 and a forecast period of 2025-2033. The report is designed for industry professionals, investors, and researchers seeking a deep understanding of this vital sector.
High-impact keywords: Tissue transplantation, organ transplantation, immunosuppressive drugs, preservation solutions, allografts, bone grafts, medical devices, healthcare market, market analysis, market forecast, industry trends, competitive landscape, Orthofix Medical, Arthrex Inc, Veloxis Pharmaceuticals, Novartis AG, Medtronic.
Tissue and Organ Transplantation Industry Market Dynamics & Structure
The tissue and organ transplantation market is characterized by a moderately concentrated landscape, with a few major players holding significant market share. Technological innovation, particularly in preservation solutions and immunosuppressive drugs, is a key driver. Stringent regulatory frameworks, varying across geographies, present both challenges and opportunities. The market also faces competition from alternative therapies and procedures. End-user demographics, particularly the aging population and increasing incidence of chronic diseases, significantly influence market demand. Mergers and acquisitions (M&A) activity is moderate, with larger players strategically acquiring smaller companies to expand their product portfolios and geographical reach.
- Market Concentration: The top 5 players hold an estimated xx% market share in 2025.
- Technological Innovation: Focus on minimally invasive procedures, improved preservation techniques, and personalized medicine.
- Regulatory Landscape: Stringent approvals and compliance requirements impacting market entry and product development.
- Competitive Substitutes: Alternative therapies and treatments posing competitive pressure.
- End-User Demographics: Aging population and increasing prevalence of chronic diseases drive demand.
- M&A Activity: xx major M&A deals recorded between 2019 and 2024, with an estimated value of xx Million.
Tissue and Organ Transplantation Industry Growth Trends & Insights
The global tissue and organ transplantation market is experiencing robust growth, driven by several key factors. The market size is projected to reach xx Million by 2025 and xx Million by 2033, exhibiting a CAGR of xx% during the forecast period. This growth is fueled by increasing organ failure rates, rising demand for advanced transplantation procedures, technological advancements in immunosuppression and preservation, and expanding healthcare infrastructure in developing economies. Adoption rates for innovative products are steadily increasing, as are advancements in minimally invasive techniques. Consumer behavior is shifting toward greater demand for personalized treatments and improved patient outcomes.
Dominant Regions, Countries, or Segments in Tissue and Organ Transplantation Industry
North America currently dominates the tissue and organ transplantation market, driven by high healthcare expenditure, advanced medical infrastructure, and a large patient pool. Europe follows closely, showing significant growth potential. Within the market segments, Organ Transplantation holds the largest share in terms of value, followed by Tissue Transplantation. The Hospitals segment is the largest end-user, owing to the high volume of transplantation procedures performed in these facilities.
- Key Drivers (North America): High healthcare expenditure, advanced medical infrastructure, strong regulatory support.
- Key Drivers (Europe): Growing healthcare investments, increasing prevalence of chronic diseases, technological advancements.
- End-Use Segment Dominance: Hospitals (xx Million in 2025), followed by Transplant Centers (xx Million in 2025).
- Product Segment Dominance: Immunosuppressive Drugs (xx Million in 2025), followed by Tissue Products (xx Million in 2025).
- Application Segment Dominance: Organ Transplantation (xx Million in 2025), followed by Tissue Transplantation (xx Million in 2025).
Tissue and Organ Transplantation Industry Product Landscape
The tissue and organ transplantation market offers a diverse range of products, including tissue products (allografts, xenografts), immunosuppressive drugs, and preservation solutions. Recent innovations focus on enhancing tissue viability, improving graft survival rates, and reducing adverse effects of immunosuppression. Products are differentiated based on their biocompatibility, efficacy, and ease of use. Technological advancements, such as 3D bioprinting and tissue engineering, are poised to revolutionize the product landscape.
Key Drivers, Barriers & Challenges in Tissue and Organ Transplantation Industry
Key Drivers: Increasing prevalence of chronic diseases leading to organ failure, technological advancements resulting in improved outcomes, rising healthcare expenditure, and government initiatives promoting organ donation.
Key Challenges: High cost of treatment, limited organ availability, stringent regulatory hurdles, and potential risks associated with immunosuppressive drugs. Supply chain disruptions during the pandemic impacted the availability of certain products, resulting in a xx% decrease in supply in 2020.
Emerging Opportunities in Tissue and Organ Transplantation Industry
Emerging opportunities lie in regenerative medicine, 3D bioprinting of tissues and organs, development of novel immunosuppressive agents with reduced side effects, and expansion into underserved markets. The growing demand for personalized medicine and increased focus on improving patient outcomes represent significant growth opportunities.
Growth Accelerators in the Tissue and Organ Transplantation Industry Industry
Technological advancements in tissue engineering, improved preservation techniques, and the development of novel immunosuppressants are key growth accelerators. Strategic partnerships between pharmaceutical companies, medical device manufacturers, and research institutions are also fostering innovation and market expansion. Increased public awareness campaigns promoting organ donation contribute to a growing supply of transplantable organs.
Key Players Shaping the Tissue and Organ Transplantation Industry Market
- Orthofix Medical
- Arthrex Inc
- Veloxis Pharmaceutical
- Novartis AG
- Medtronic
- Amnio Technology
- Strykers
- Teva Pharmaceuticals
- Abbvie Inc
- Zimmer Biomet
- BiolifeSolutions Inc
- 21st Century Medicine
Notable Milestones in Tissue and Organ Transplantation Industry Sector
- February 2022: Amnio Technology launched PalinGen Dual-Layer Membrane and Dual Layer PalinGen X-Membrane, expanding its allograft offerings.
- February 2022: Orthofix Medical launched Opus BA, a synthetic bioactive bone graft solution for spine fusion procedures.
In-Depth Tissue and Organ Transplantation Industry Market Outlook
The tissue and organ transplantation market holds immense future potential, driven by continuous technological advancements, rising healthcare expenditure, and growing awareness of the need for organ donation. Strategic partnerships, focused on R&D and market expansion, will be critical for long-term success. The focus on improved patient outcomes and personalized medicine will shape the industry's future trajectory, unlocking new growth avenues and opportunities for market players.
Tissue and Organ Transplantation Industry Segmentation
-
1. Product
- 1.1. Tissue Products
- 1.2. Immunosuppressive Drugs
- 1.3. Preservation Solution
-
2. Application
- 2.1. Organ Transplantation
- 2.2. Tissue Transplantation
-
3. End Use
- 3.1. Hospitals
- 3.2. Transplant Centers
- 3.3. Others
Tissue and Organ Transplantation Industry Segmentation By Geography
-
1. North America
- 1.1. United States
- 1.2. Canada
- 1.3. Mexico
-
2. Europe
- 2.1. Germany
- 2.2. United Kingdom
- 2.3. France
- 2.4. Italy
- 2.5. Spain
- 2.6. Rest of Europe
-
3. Asia Pacific
- 3.1. China
- 3.2. Japan
- 3.3. India
- 3.4. Australia
- 3.5. South Korea
- 3.6. Rest of Asia Pacific
-
4. Middle East and Africa
- 4.1. GCC
- 4.2. South Africa
- 4.3. Rest of Middle East and Africa
-
5. South America
- 5.1. Brazil
- 5.2. Argentina
- 5.3. Rest of South America
Tissue and Organ Transplantation Industry REPORT HIGHLIGHTS
| Aspects | Details |
|---|---|
| Study Period | 2019-2033 |
| Base Year | 2024 |
| Estimated Year | 2025 |
| Forecast Period | 2025-2033 |
| Historical Period | 2019-2024 |
| Growth Rate | CAGR of 9.90% from 2019-2033 |
| Segmentation |
|
Table of Contents
- 1. Introduction
- 1.1. Research Scope
- 1.2. Market Segmentation
- 1.3. Research Methodology
- 1.4. Definitions and Assumptions
- 2. Executive Summary
- 2.1. Introduction
- 3. Market Dynamics
- 3.1. Introduction
- 3.2. Market Drivers
- 3.2.1. Increasing Burden of Chronic Diseases; Increasing Burden of Organ Failure; Technological Advancement in Transplantation Method
- 3.3. Market Restrains
- 3.3.1. Shortage of Organ Donors; Ethical and Cultural Issues
- 3.4. Market Trends
- 3.4.1. Tissue Product Segment is Expected to Dominate the Market Over the Forecast Period
- 4. Market Factor Analysis
- 4.1. Porters Five Forces
- 4.2. Supply/Value Chain
- 4.3. PESTEL analysis
- 4.4. Market Entropy
- 4.5. Patent/Trademark Analysis
- 5. Global Tissue and Organ Transplantation Industry Analysis, Insights and Forecast, 2019-2031
- 5.1. Market Analysis, Insights and Forecast - by Product
- 5.1.1. Tissue Products
- 5.1.2. Immunosuppressive Drugs
- 5.1.3. Preservation Solution
- 5.2. Market Analysis, Insights and Forecast - by Application
- 5.2.1. Organ Transplantation
- 5.2.2. Tissue Transplantation
- 5.3. Market Analysis, Insights and Forecast - by End Use
- 5.3.1. Hospitals
- 5.3.2. Transplant Centers
- 5.3.3. Others
- 5.4. Market Analysis, Insights and Forecast - by Region
- 5.4.1. North America
- 5.4.2. Europe
- 5.4.3. Asia Pacific
- 5.4.4. Middle East and Africa
- 5.4.5. South America
- 5.1. Market Analysis, Insights and Forecast - by Product
- 6. North America Tissue and Organ Transplantation Industry Analysis, Insights and Forecast, 2019-2031
- 6.1. Market Analysis, Insights and Forecast - by Product
- 6.1.1. Tissue Products
- 6.1.2. Immunosuppressive Drugs
- 6.1.3. Preservation Solution
- 6.2. Market Analysis, Insights and Forecast - by Application
- 6.2.1. Organ Transplantation
- 6.2.2. Tissue Transplantation
- 6.3. Market Analysis, Insights and Forecast - by End Use
- 6.3.1. Hospitals
- 6.3.2. Transplant Centers
- 6.3.3. Others
- 6.1. Market Analysis, Insights and Forecast - by Product
- 7. Europe Tissue and Organ Transplantation Industry Analysis, Insights and Forecast, 2019-2031
- 7.1. Market Analysis, Insights and Forecast - by Product
- 7.1.1. Tissue Products
- 7.1.2. Immunosuppressive Drugs
- 7.1.3. Preservation Solution
- 7.2. Market Analysis, Insights and Forecast - by Application
- 7.2.1. Organ Transplantation
- 7.2.2. Tissue Transplantation
- 7.3. Market Analysis, Insights and Forecast - by End Use
- 7.3.1. Hospitals
- 7.3.2. Transplant Centers
- 7.3.3. Others
- 7.1. Market Analysis, Insights and Forecast - by Product
- 8. Asia Pacific Tissue and Organ Transplantation Industry Analysis, Insights and Forecast, 2019-2031
- 8.1. Market Analysis, Insights and Forecast - by Product
- 8.1.1. Tissue Products
- 8.1.2. Immunosuppressive Drugs
- 8.1.3. Preservation Solution
- 8.2. Market Analysis, Insights and Forecast - by Application
- 8.2.1. Organ Transplantation
- 8.2.2. Tissue Transplantation
- 8.3. Market Analysis, Insights and Forecast - by End Use
- 8.3.1. Hospitals
- 8.3.2. Transplant Centers
- 8.3.3. Others
- 8.1. Market Analysis, Insights and Forecast - by Product
- 9. Middle East and Africa Tissue and Organ Transplantation Industry Analysis, Insights and Forecast, 2019-2031
- 9.1. Market Analysis, Insights and Forecast - by Product
- 9.1.1. Tissue Products
- 9.1.2. Immunosuppressive Drugs
- 9.1.3. Preservation Solution
- 9.2. Market Analysis, Insights and Forecast - by Application
- 9.2.1. Organ Transplantation
- 9.2.2. Tissue Transplantation
- 9.3. Market Analysis, Insights and Forecast - by End Use
- 9.3.1. Hospitals
- 9.3.2. Transplant Centers
- 9.3.3. Others
- 9.1. Market Analysis, Insights and Forecast - by Product
- 10. South America Tissue and Organ Transplantation Industry Analysis, Insights and Forecast, 2019-2031
- 10.1. Market Analysis, Insights and Forecast - by Product
- 10.1.1. Tissue Products
- 10.1.2. Immunosuppressive Drugs
- 10.1.3. Preservation Solution
- 10.2. Market Analysis, Insights and Forecast - by Application
- 10.2.1. Organ Transplantation
- 10.2.2. Tissue Transplantation
- 10.3. Market Analysis, Insights and Forecast - by End Use
- 10.3.1. Hospitals
- 10.3.2. Transplant Centers
- 10.3.3. Others
- 10.1. Market Analysis, Insights and Forecast - by Product
- 11. North America Tissue and Organ Transplantation Industry Analysis, Insights and Forecast, 2019-2031
- 11.1. Market Analysis, Insights and Forecast - By Country/Sub-region
- 11.1.1 United States
- 11.1.2 Canada
- 11.1.3 Mexico
- 12. Europe Tissue and Organ Transplantation Industry Analysis, Insights and Forecast, 2019-2031
- 12.1. Market Analysis, Insights and Forecast - By Country/Sub-region
- 12.1.1 Germany
- 12.1.2 United Kingdom
- 12.1.3 France
- 12.1.4 Italy
- 12.1.5 Spain
- 12.1.6 Rest of Europe
- 13. Asia Pacific Tissue and Organ Transplantation Industry Analysis, Insights and Forecast, 2019-2031
- 13.1. Market Analysis, Insights and Forecast - By Country/Sub-region
- 13.1.1 China
- 13.1.2 Japan
- 13.1.3 India
- 13.1.4 Australia
- 13.1.5 South Korea
- 13.1.6 Rest of Asia Pacific
- 14. Middle East and Africa Tissue and Organ Transplantation Industry Analysis, Insights and Forecast, 2019-2031
- 14.1. Market Analysis, Insights and Forecast - By Country/Sub-region
- 14.1.1 GCC
- 14.1.2 South Africa
- 14.1.3 Rest of Middle East and Africa
- 15. South America Tissue and Organ Transplantation Industry Analysis, Insights and Forecast, 2019-2031
- 15.1. Market Analysis, Insights and Forecast - By Country/Sub-region
- 15.1.1 Brazil
- 15.1.2 Argentina
- 15.1.3 Rest of South America
- 16. Competitive Analysis
- 16.1. Global Market Share Analysis 2024
- 16.2. Company Profiles
- 16.2.1 Orthofix Medical
- 16.2.1.1. Overview
- 16.2.1.2. Products
- 16.2.1.3. SWOT Analysis
- 16.2.1.4. Recent Developments
- 16.2.1.5. Financials (Based on Availability)
- 16.2.2 Arthrex Inc
- 16.2.2.1. Overview
- 16.2.2.2. Products
- 16.2.2.3. SWOT Analysis
- 16.2.2.4. Recent Developments
- 16.2.2.5. Financials (Based on Availability)
- 16.2.3 Veloxis Pharmaceutical
- 16.2.3.1. Overview
- 16.2.3.2. Products
- 16.2.3.3. SWOT Analysis
- 16.2.3.4. Recent Developments
- 16.2.3.5. Financials (Based on Availability)
- 16.2.4 Novartis AG
- 16.2.4.1. Overview
- 16.2.4.2. Products
- 16.2.4.3. SWOT Analysis
- 16.2.4.4. Recent Developments
- 16.2.4.5. Financials (Based on Availability)
- 16.2.5 Medtronic
- 16.2.5.1. Overview
- 16.2.5.2. Products
- 16.2.5.3. SWOT Analysis
- 16.2.5.4. Recent Developments
- 16.2.5.5. Financials (Based on Availability)
- 16.2.6 Amnio Technology
- 16.2.6.1. Overview
- 16.2.6.2. Products
- 16.2.6.3. SWOT Analysis
- 16.2.6.4. Recent Developments
- 16.2.6.5. Financials (Based on Availability)
- 16.2.7 Strykers
- 16.2.7.1. Overview
- 16.2.7.2. Products
- 16.2.7.3. SWOT Analysis
- 16.2.7.4. Recent Developments
- 16.2.7.5. Financials (Based on Availability)
- 16.2.8 Teva Pharmaceuticals
- 16.2.8.1. Overview
- 16.2.8.2. Products
- 16.2.8.3. SWOT Analysis
- 16.2.8.4. Recent Developments
- 16.2.8.5. Financials (Based on Availability)
- 16.2.9 Abbvie Inc
- 16.2.9.1. Overview
- 16.2.9.2. Products
- 16.2.9.3. SWOT Analysis
- 16.2.9.4. Recent Developments
- 16.2.9.5. Financials (Based on Availability)
- 16.2.10 Zimmer Biomet
- 16.2.10.1. Overview
- 16.2.10.2. Products
- 16.2.10.3. SWOT Analysis
- 16.2.10.4. Recent Developments
- 16.2.10.5. Financials (Based on Availability)
- 16.2.11 BiolifeSolutions Inc
- 16.2.11.1. Overview
- 16.2.11.2. Products
- 16.2.11.3. SWOT Analysis
- 16.2.11.4. Recent Developments
- 16.2.11.5. Financials (Based on Availability)
- 16.2.12 21st Century Medicine
- 16.2.12.1. Overview
- 16.2.12.2. Products
- 16.2.12.3. SWOT Analysis
- 16.2.12.4. Recent Developments
- 16.2.12.5. Financials (Based on Availability)
- 16.2.1 Orthofix Medical
List of Figures
- Figure 1: Global Tissue and Organ Transplantation Industry Revenue Breakdown (Million, %) by Region 2024 & 2032
- Figure 2: Global Tissue and Organ Transplantation Industry Volume Breakdown (K Unit, %) by Region 2024 & 2032
- Figure 3: North America Tissue and Organ Transplantation Industry Revenue (Million), by Country 2024 & 2032
- Figure 4: North America Tissue and Organ Transplantation Industry Volume (K Unit), by Country 2024 & 2032
- Figure 5: North America Tissue and Organ Transplantation Industry Revenue Share (%), by Country 2024 & 2032
- Figure 6: North America Tissue and Organ Transplantation Industry Volume Share (%), by Country 2024 & 2032
- Figure 7: Europe Tissue and Organ Transplantation Industry Revenue (Million), by Country 2024 & 2032
- Figure 8: Europe Tissue and Organ Transplantation Industry Volume (K Unit), by Country 2024 & 2032
- Figure 9: Europe Tissue and Organ Transplantation Industry Revenue Share (%), by Country 2024 & 2032
- Figure 10: Europe Tissue and Organ Transplantation Industry Volume Share (%), by Country 2024 & 2032
- Figure 11: Asia Pacific Tissue and Organ Transplantation Industry Revenue (Million), by Country 2024 & 2032
- Figure 12: Asia Pacific Tissue and Organ Transplantation Industry Volume (K Unit), by Country 2024 & 2032
- Figure 13: Asia Pacific Tissue and Organ Transplantation Industry Revenue Share (%), by Country 2024 & 2032
- Figure 14: Asia Pacific Tissue and Organ Transplantation Industry Volume Share (%), by Country 2024 & 2032
- Figure 15: Middle East and Africa Tissue and Organ Transplantation Industry Revenue (Million), by Country 2024 & 2032
- Figure 16: Middle East and Africa Tissue and Organ Transplantation Industry Volume (K Unit), by Country 2024 & 2032
- Figure 17: Middle East and Africa Tissue and Organ Transplantation Industry Revenue Share (%), by Country 2024 & 2032
- Figure 18: Middle East and Africa Tissue and Organ Transplantation Industry Volume Share (%), by Country 2024 & 2032
- Figure 19: South America Tissue and Organ Transplantation Industry Revenue (Million), by Country 2024 & 2032
- Figure 20: South America Tissue and Organ Transplantation Industry Volume (K Unit), by Country 2024 & 2032
- Figure 21: South America Tissue and Organ Transplantation Industry Revenue Share (%), by Country 2024 & 2032
- Figure 22: South America Tissue and Organ Transplantation Industry Volume Share (%), by Country 2024 & 2032
- Figure 23: North America Tissue and Organ Transplantation Industry Revenue (Million), by Product 2024 & 2032
- Figure 24: North America Tissue and Organ Transplantation Industry Volume (K Unit), by Product 2024 & 2032
- Figure 25: North America Tissue and Organ Transplantation Industry Revenue Share (%), by Product 2024 & 2032
- Figure 26: North America Tissue and Organ Transplantation Industry Volume Share (%), by Product 2024 & 2032
- Figure 27: North America Tissue and Organ Transplantation Industry Revenue (Million), by Application 2024 & 2032
- Figure 28: North America Tissue and Organ Transplantation Industry Volume (K Unit), by Application 2024 & 2032
- Figure 29: North America Tissue and Organ Transplantation Industry Revenue Share (%), by Application 2024 & 2032
- Figure 30: North America Tissue and Organ Transplantation Industry Volume Share (%), by Application 2024 & 2032
- Figure 31: North America Tissue and Organ Transplantation Industry Revenue (Million), by End Use 2024 & 2032
- Figure 32: North America Tissue and Organ Transplantation Industry Volume (K Unit), by End Use 2024 & 2032
- Figure 33: North America Tissue and Organ Transplantation Industry Revenue Share (%), by End Use 2024 & 2032
- Figure 34: North America Tissue and Organ Transplantation Industry Volume Share (%), by End Use 2024 & 2032
- Figure 35: North America Tissue and Organ Transplantation Industry Revenue (Million), by Country 2024 & 2032
- Figure 36: North America Tissue and Organ Transplantation Industry Volume (K Unit), by Country 2024 & 2032
- Figure 37: North America Tissue and Organ Transplantation Industry Revenue Share (%), by Country 2024 & 2032
- Figure 38: North America Tissue and Organ Transplantation Industry Volume Share (%), by Country 2024 & 2032
- Figure 39: Europe Tissue and Organ Transplantation Industry Revenue (Million), by Product 2024 & 2032
- Figure 40: Europe Tissue and Organ Transplantation Industry Volume (K Unit), by Product 2024 & 2032
- Figure 41: Europe Tissue and Organ Transplantation Industry Revenue Share (%), by Product 2024 & 2032
- Figure 42: Europe Tissue and Organ Transplantation Industry Volume Share (%), by Product 2024 & 2032
- Figure 43: Europe Tissue and Organ Transplantation Industry Revenue (Million), by Application 2024 & 2032
- Figure 44: Europe Tissue and Organ Transplantation Industry Volume (K Unit), by Application 2024 & 2032
- Figure 45: Europe Tissue and Organ Transplantation Industry Revenue Share (%), by Application 2024 & 2032
- Figure 46: Europe Tissue and Organ Transplantation Industry Volume Share (%), by Application 2024 & 2032
- Figure 47: Europe Tissue and Organ Transplantation Industry Revenue (Million), by End Use 2024 & 2032
- Figure 48: Europe Tissue and Organ Transplantation Industry Volume (K Unit), by End Use 2024 & 2032
- Figure 49: Europe Tissue and Organ Transplantation Industry Revenue Share (%), by End Use 2024 & 2032
- Figure 50: Europe Tissue and Organ Transplantation Industry Volume Share (%), by End Use 2024 & 2032
- Figure 51: Europe Tissue and Organ Transplantation Industry Revenue (Million), by Country 2024 & 2032
- Figure 52: Europe Tissue and Organ Transplantation Industry Volume (K Unit), by Country 2024 & 2032
- Figure 53: Europe Tissue and Organ Transplantation Industry Revenue Share (%), by Country 2024 & 2032
- Figure 54: Europe Tissue and Organ Transplantation Industry Volume Share (%), by Country 2024 & 2032
- Figure 55: Asia Pacific Tissue and Organ Transplantation Industry Revenue (Million), by Product 2024 & 2032
- Figure 56: Asia Pacific Tissue and Organ Transplantation Industry Volume (K Unit), by Product 2024 & 2032
- Figure 57: Asia Pacific Tissue and Organ Transplantation Industry Revenue Share (%), by Product 2024 & 2032
- Figure 58: Asia Pacific Tissue and Organ Transplantation Industry Volume Share (%), by Product 2024 & 2032
- Figure 59: Asia Pacific Tissue and Organ Transplantation Industry Revenue (Million), by Application 2024 & 2032
- Figure 60: Asia Pacific Tissue and Organ Transplantation Industry Volume (K Unit), by Application 2024 & 2032
- Figure 61: Asia Pacific Tissue and Organ Transplantation Industry Revenue Share (%), by Application 2024 & 2032
- Figure 62: Asia Pacific Tissue and Organ Transplantation Industry Volume Share (%), by Application 2024 & 2032
- Figure 63: Asia Pacific Tissue and Organ Transplantation Industry Revenue (Million), by End Use 2024 & 2032
- Figure 64: Asia Pacific Tissue and Organ Transplantation Industry Volume (K Unit), by End Use 2024 & 2032
- Figure 65: Asia Pacific Tissue and Organ Transplantation Industry Revenue Share (%), by End Use 2024 & 2032
- Figure 66: Asia Pacific Tissue and Organ Transplantation Industry Volume Share (%), by End Use 2024 & 2032
- Figure 67: Asia Pacific Tissue and Organ Transplantation Industry Revenue (Million), by Country 2024 & 2032
- Figure 68: Asia Pacific Tissue and Organ Transplantation Industry Volume (K Unit), by Country 2024 & 2032
- Figure 69: Asia Pacific Tissue and Organ Transplantation Industry Revenue Share (%), by Country 2024 & 2032
- Figure 70: Asia Pacific Tissue and Organ Transplantation Industry Volume Share (%), by Country 2024 & 2032
- Figure 71: Middle East and Africa Tissue and Organ Transplantation Industry Revenue (Million), by Product 2024 & 2032
- Figure 72: Middle East and Africa Tissue and Organ Transplantation Industry Volume (K Unit), by Product 2024 & 2032
- Figure 73: Middle East and Africa Tissue and Organ Transplantation Industry Revenue Share (%), by Product 2024 & 2032
- Figure 74: Middle East and Africa Tissue and Organ Transplantation Industry Volume Share (%), by Product 2024 & 2032
- Figure 75: Middle East and Africa Tissue and Organ Transplantation Industry Revenue (Million), by Application 2024 & 2032
- Figure 76: Middle East and Africa Tissue and Organ Transplantation Industry Volume (K Unit), by Application 2024 & 2032
- Figure 77: Middle East and Africa Tissue and Organ Transplantation Industry Revenue Share (%), by Application 2024 & 2032
- Figure 78: Middle East and Africa Tissue and Organ Transplantation Industry Volume Share (%), by Application 2024 & 2032
- Figure 79: Middle East and Africa Tissue and Organ Transplantation Industry Revenue (Million), by End Use 2024 & 2032
- Figure 80: Middle East and Africa Tissue and Organ Transplantation Industry Volume (K Unit), by End Use 2024 & 2032
- Figure 81: Middle East and Africa Tissue and Organ Transplantation Industry Revenue Share (%), by End Use 2024 & 2032
- Figure 82: Middle East and Africa Tissue and Organ Transplantation Industry Volume Share (%), by End Use 2024 & 2032
- Figure 83: Middle East and Africa Tissue and Organ Transplantation Industry Revenue (Million), by Country 2024 & 2032
- Figure 84: Middle East and Africa Tissue and Organ Transplantation Industry Volume (K Unit), by Country 2024 & 2032
- Figure 85: Middle East and Africa Tissue and Organ Transplantation Industry Revenue Share (%), by Country 2024 & 2032
- Figure 86: Middle East and Africa Tissue and Organ Transplantation Industry Volume Share (%), by Country 2024 & 2032
- Figure 87: South America Tissue and Organ Transplantation Industry Revenue (Million), by Product 2024 & 2032
- Figure 88: South America Tissue and Organ Transplantation Industry Volume (K Unit), by Product 2024 & 2032
- Figure 89: South America Tissue and Organ Transplantation Industry Revenue Share (%), by Product 2024 & 2032
- Figure 90: South America Tissue and Organ Transplantation Industry Volume Share (%), by Product 2024 & 2032
- Figure 91: South America Tissue and Organ Transplantation Industry Revenue (Million), by Application 2024 & 2032
- Figure 92: South America Tissue and Organ Transplantation Industry Volume (K Unit), by Application 2024 & 2032
- Figure 93: South America Tissue and Organ Transplantation Industry Revenue Share (%), by Application 2024 & 2032
- Figure 94: South America Tissue and Organ Transplantation Industry Volume Share (%), by Application 2024 & 2032
- Figure 95: South America Tissue and Organ Transplantation Industry Revenue (Million), by End Use 2024 & 2032
- Figure 96: South America Tissue and Organ Transplantation Industry Volume (K Unit), by End Use 2024 & 2032
- Figure 97: South America Tissue and Organ Transplantation Industry Revenue Share (%), by End Use 2024 & 2032
- Figure 98: South America Tissue and Organ Transplantation Industry Volume Share (%), by End Use 2024 & 2032
- Figure 99: South America Tissue and Organ Transplantation Industry Revenue (Million), by Country 2024 & 2032
- Figure 100: South America Tissue and Organ Transplantation Industry Volume (K Unit), by Country 2024 & 2032
- Figure 101: South America Tissue and Organ Transplantation Industry Revenue Share (%), by Country 2024 & 2032
- Figure 102: South America Tissue and Organ Transplantation Industry Volume Share (%), by Country 2024 & 2032
List of Tables
- Table 1: Global Tissue and Organ Transplantation Industry Revenue Million Forecast, by Region 2019 & 2032
- Table 2: Global Tissue and Organ Transplantation Industry Volume K Unit Forecast, by Region 2019 & 2032
- Table 3: Global Tissue and Organ Transplantation Industry Revenue Million Forecast, by Product 2019 & 2032
- Table 4: Global Tissue and Organ Transplantation Industry Volume K Unit Forecast, by Product 2019 & 2032
- Table 5: Global Tissue and Organ Transplantation Industry Revenue Million Forecast, by Application 2019 & 2032
- Table 6: Global Tissue and Organ Transplantation Industry Volume K Unit Forecast, by Application 2019 & 2032
- Table 7: Global Tissue and Organ Transplantation Industry Revenue Million Forecast, by End Use 2019 & 2032
- Table 8: Global Tissue and Organ Transplantation Industry Volume K Unit Forecast, by End Use 2019 & 2032
- Table 9: Global Tissue and Organ Transplantation Industry Revenue Million Forecast, by Region 2019 & 2032
- Table 10: Global Tissue and Organ Transplantation Industry Volume K Unit Forecast, by Region 2019 & 2032
- Table 11: Global Tissue and Organ Transplantation Industry Revenue Million Forecast, by Country 2019 & 2032
- Table 12: Global Tissue and Organ Transplantation Industry Volume K Unit Forecast, by Country 2019 & 2032
- Table 13: United States Tissue and Organ Transplantation Industry Revenue (Million) Forecast, by Application 2019 & 2032
- Table 14: United States Tissue and Organ Transplantation Industry Volume (K Unit) Forecast, by Application 2019 & 2032
- Table 15: Canada Tissue and Organ Transplantation Industry Revenue (Million) Forecast, by Application 2019 & 2032
- Table 16: Canada Tissue and Organ Transplantation Industry Volume (K Unit) Forecast, by Application 2019 & 2032
- Table 17: Mexico Tissue and Organ Transplantation Industry Revenue (Million) Forecast, by Application 2019 & 2032
- Table 18: Mexico Tissue and Organ Transplantation Industry Volume (K Unit) Forecast, by Application 2019 & 2032
- Table 19: Global Tissue and Organ Transplantation Industry Revenue Million Forecast, by Country 2019 & 2032
- Table 20: Global Tissue and Organ Transplantation Industry Volume K Unit Forecast, by Country 2019 & 2032
- Table 21: Germany Tissue and Organ Transplantation Industry Revenue (Million) Forecast, by Application 2019 & 2032
- Table 22: Germany Tissue and Organ Transplantation Industry Volume (K Unit) Forecast, by Application 2019 & 2032
- Table 23: United Kingdom Tissue and Organ Transplantation Industry Revenue (Million) Forecast, by Application 2019 & 2032
- Table 24: United Kingdom Tissue and Organ Transplantation Industry Volume (K Unit) Forecast, by Application 2019 & 2032
- Table 25: France Tissue and Organ Transplantation Industry Revenue (Million) Forecast, by Application 2019 & 2032
- Table 26: France Tissue and Organ Transplantation Industry Volume (K Unit) Forecast, by Application 2019 & 2032
- Table 27: Italy Tissue and Organ Transplantation Industry Revenue (Million) Forecast, by Application 2019 & 2032
- Table 28: Italy Tissue and Organ Transplantation Industry Volume (K Unit) Forecast, by Application 2019 & 2032
- Table 29: Spain Tissue and Organ Transplantation Industry Revenue (Million) Forecast, by Application 2019 & 2032
- Table 30: Spain Tissue and Organ Transplantation Industry Volume (K Unit) Forecast, by Application 2019 & 2032
- Table 31: Rest of Europe Tissue and Organ Transplantation Industry Revenue (Million) Forecast, by Application 2019 & 2032
- Table 32: Rest of Europe Tissue and Organ Transplantation Industry Volume (K Unit) Forecast, by Application 2019 & 2032
- Table 33: Global Tissue and Organ Transplantation Industry Revenue Million Forecast, by Country 2019 & 2032
- Table 34: Global Tissue and Organ Transplantation Industry Volume K Unit Forecast, by Country 2019 & 2032
- Table 35: China Tissue and Organ Transplantation Industry Revenue (Million) Forecast, by Application 2019 & 2032
- Table 36: China Tissue and Organ Transplantation Industry Volume (K Unit) Forecast, by Application 2019 & 2032
- Table 37: Japan Tissue and Organ Transplantation Industry Revenue (Million) Forecast, by Application 2019 & 2032
- Table 38: Japan Tissue and Organ Transplantation Industry Volume (K Unit) Forecast, by Application 2019 & 2032
- Table 39: India Tissue and Organ Transplantation Industry Revenue (Million) Forecast, by Application 2019 & 2032
- Table 40: India Tissue and Organ Transplantation Industry Volume (K Unit) Forecast, by Application 2019 & 2032
- Table 41: Australia Tissue and Organ Transplantation Industry Revenue (Million) Forecast, by Application 2019 & 2032
- Table 42: Australia Tissue and Organ Transplantation Industry Volume (K Unit) Forecast, by Application 2019 & 2032
- Table 43: South Korea Tissue and Organ Transplantation Industry Revenue (Million) Forecast, by Application 2019 & 2032
- Table 44: South Korea Tissue and Organ Transplantation Industry Volume (K Unit) Forecast, by Application 2019 & 2032
- Table 45: Rest of Asia Pacific Tissue and Organ Transplantation Industry Revenue (Million) Forecast, by Application 2019 & 2032
- Table 46: Rest of Asia Pacific Tissue and Organ Transplantation Industry Volume (K Unit) Forecast, by Application 2019 & 2032
- Table 47: Global Tissue and Organ Transplantation Industry Revenue Million Forecast, by Country 2019 & 2032
- Table 48: Global Tissue and Organ Transplantation Industry Volume K Unit Forecast, by Country 2019 & 2032
- Table 49: GCC Tissue and Organ Transplantation Industry Revenue (Million) Forecast, by Application 2019 & 2032
- Table 50: GCC Tissue and Organ Transplantation Industry Volume (K Unit) Forecast, by Application 2019 & 2032
- Table 51: South Africa Tissue and Organ Transplantation Industry Revenue (Million) Forecast, by Application 2019 & 2032
- Table 52: South Africa Tissue and Organ Transplantation Industry Volume (K Unit) Forecast, by Application 2019 & 2032
- Table 53: Rest of Middle East and Africa Tissue and Organ Transplantation Industry Revenue (Million) Forecast, by Application 2019 & 2032
- Table 54: Rest of Middle East and Africa Tissue and Organ Transplantation Industry Volume (K Unit) Forecast, by Application 2019 & 2032
- Table 55: Global Tissue and Organ Transplantation Industry Revenue Million Forecast, by Country 2019 & 2032
- Table 56: Global Tissue and Organ Transplantation Industry Volume K Unit Forecast, by Country 2019 & 2032
- Table 57: Brazil Tissue and Organ Transplantation Industry Revenue (Million) Forecast, by Application 2019 & 2032
- Table 58: Brazil Tissue and Organ Transplantation Industry Volume (K Unit) Forecast, by Application 2019 & 2032
- Table 59: Argentina Tissue and Organ Transplantation Industry Revenue (Million) Forecast, by Application 2019 & 2032
- Table 60: Argentina Tissue and Organ Transplantation Industry Volume (K Unit) Forecast, by Application 2019 & 2032
- Table 61: Rest of South America Tissue and Organ Transplantation Industry Revenue (Million) Forecast, by Application 2019 & 2032
- Table 62: Rest of South America Tissue and Organ Transplantation Industry Volume (K Unit) Forecast, by Application 2019 & 2032
- Table 63: Global Tissue and Organ Transplantation Industry Revenue Million Forecast, by Product 2019 & 2032
- Table 64: Global Tissue and Organ Transplantation Industry Volume K Unit Forecast, by Product 2019 & 2032
- Table 65: Global Tissue and Organ Transplantation Industry Revenue Million Forecast, by Application 2019 & 2032
- Table 66: Global Tissue and Organ Transplantation Industry Volume K Unit Forecast, by Application 2019 & 2032
- Table 67: Global Tissue and Organ Transplantation Industry Revenue Million Forecast, by End Use 2019 & 2032
- Table 68: Global Tissue and Organ Transplantation Industry Volume K Unit Forecast, by End Use 2019 & 2032
- Table 69: Global Tissue and Organ Transplantation Industry Revenue Million Forecast, by Country 2019 & 2032
- Table 70: Global Tissue and Organ Transplantation Industry Volume K Unit Forecast, by Country 2019 & 2032
- Table 71: United States Tissue and Organ Transplantation Industry Revenue (Million) Forecast, by Application 2019 & 2032
- Table 72: United States Tissue and Organ Transplantation Industry Volume (K Unit) Forecast, by Application 2019 & 2032
- Table 73: Canada Tissue and Organ Transplantation Industry Revenue (Million) Forecast, by Application 2019 & 2032
- Table 74: Canada Tissue and Organ Transplantation Industry Volume (K Unit) Forecast, by Application 2019 & 2032
- Table 75: Mexico Tissue and Organ Transplantation Industry Revenue (Million) Forecast, by Application 2019 & 2032
- Table 76: Mexico Tissue and Organ Transplantation Industry Volume (K Unit) Forecast, by Application 2019 & 2032
- Table 77: Global Tissue and Organ Transplantation Industry Revenue Million Forecast, by Product 2019 & 2032
- Table 78: Global Tissue and Organ Transplantation Industry Volume K Unit Forecast, by Product 2019 & 2032
- Table 79: Global Tissue and Organ Transplantation Industry Revenue Million Forecast, by Application 2019 & 2032
- Table 80: Global Tissue and Organ Transplantation Industry Volume K Unit Forecast, by Application 2019 & 2032
- Table 81: Global Tissue and Organ Transplantation Industry Revenue Million Forecast, by End Use 2019 & 2032
- Table 82: Global Tissue and Organ Transplantation Industry Volume K Unit Forecast, by End Use 2019 & 2032
- Table 83: Global Tissue and Organ Transplantation Industry Revenue Million Forecast, by Country 2019 & 2032
- Table 84: Global Tissue and Organ Transplantation Industry Volume K Unit Forecast, by Country 2019 & 2032
- Table 85: Germany Tissue and Organ Transplantation Industry Revenue (Million) Forecast, by Application 2019 & 2032
- Table 86: Germany Tissue and Organ Transplantation Industry Volume (K Unit) Forecast, by Application 2019 & 2032
- Table 87: United Kingdom Tissue and Organ Transplantation Industry Revenue (Million) Forecast, by Application 2019 & 2032
- Table 88: United Kingdom Tissue and Organ Transplantation Industry Volume (K Unit) Forecast, by Application 2019 & 2032
- Table 89: France Tissue and Organ Transplantation Industry Revenue (Million) Forecast, by Application 2019 & 2032
- Table 90: France Tissue and Organ Transplantation Industry Volume (K Unit) Forecast, by Application 2019 & 2032
- Table 91: Italy Tissue and Organ Transplantation Industry Revenue (Million) Forecast, by Application 2019 & 2032
- Table 92: Italy Tissue and Organ Transplantation Industry Volume (K Unit) Forecast, by Application 2019 & 2032
- Table 93: Spain Tissue and Organ Transplantation Industry Revenue (Million) Forecast, by Application 2019 & 2032
- Table 94: Spain Tissue and Organ Transplantation Industry Volume (K Unit) Forecast, by Application 2019 & 2032
- Table 95: Rest of Europe Tissue and Organ Transplantation Industry Revenue (Million) Forecast, by Application 2019 & 2032
- Table 96: Rest of Europe Tissue and Organ Transplantation Industry Volume (K Unit) Forecast, by Application 2019 & 2032
- Table 97: Global Tissue and Organ Transplantation Industry Revenue Million Forecast, by Product 2019 & 2032
- Table 98: Global Tissue and Organ Transplantation Industry Volume K Unit Forecast, by Product 2019 & 2032
- Table 99: Global Tissue and Organ Transplantation Industry Revenue Million Forecast, by Application 2019 & 2032
- Table 100: Global Tissue and Organ Transplantation Industry Volume K Unit Forecast, by Application 2019 & 2032
- Table 101: Global Tissue and Organ Transplantation Industry Revenue Million Forecast, by End Use 2019 & 2032
- Table 102: Global Tissue and Organ Transplantation Industry Volume K Unit Forecast, by End Use 2019 & 2032
- Table 103: Global Tissue and Organ Transplantation Industry Revenue Million Forecast, by Country 2019 & 2032
- Table 104: Global Tissue and Organ Transplantation Industry Volume K Unit Forecast, by Country 2019 & 2032
- Table 105: China Tissue and Organ Transplantation Industry Revenue (Million) Forecast, by Application 2019 & 2032
- Table 106: China Tissue and Organ Transplantation Industry Volume (K Unit) Forecast, by Application 2019 & 2032
- Table 107: Japan Tissue and Organ Transplantation Industry Revenue (Million) Forecast, by Application 2019 & 2032
- Table 108: Japan Tissue and Organ Transplantation Industry Volume (K Unit) Forecast, by Application 2019 & 2032
- Table 109: India Tissue and Organ Transplantation Industry Revenue (Million) Forecast, by Application 2019 & 2032
- Table 110: India Tissue and Organ Transplantation Industry Volume (K Unit) Forecast, by Application 2019 & 2032
- Table 111: Australia Tissue and Organ Transplantation Industry Revenue (Million) Forecast, by Application 2019 & 2032
- Table 112: Australia Tissue and Organ Transplantation Industry Volume (K Unit) Forecast, by Application 2019 & 2032
- Table 113: South Korea Tissue and Organ Transplantation Industry Revenue (Million) Forecast, by Application 2019 & 2032
- Table 114: South Korea Tissue and Organ Transplantation Industry Volume (K Unit) Forecast, by Application 2019 & 2032
- Table 115: Rest of Asia Pacific Tissue and Organ Transplantation Industry Revenue (Million) Forecast, by Application 2019 & 2032
- Table 116: Rest of Asia Pacific Tissue and Organ Transplantation Industry Volume (K Unit) Forecast, by Application 2019 & 2032
- Table 117: Global Tissue and Organ Transplantation Industry Revenue Million Forecast, by Product 2019 & 2032
- Table 118: Global Tissue and Organ Transplantation Industry Volume K Unit Forecast, by Product 2019 & 2032
- Table 119: Global Tissue and Organ Transplantation Industry Revenue Million Forecast, by Application 2019 & 2032
- Table 120: Global Tissue and Organ Transplantation Industry Volume K Unit Forecast, by Application 2019 & 2032
- Table 121: Global Tissue and Organ Transplantation Industry Revenue Million Forecast, by End Use 2019 & 2032
- Table 122: Global Tissue and Organ Transplantation Industry Volume K Unit Forecast, by End Use 2019 & 2032
- Table 123: Global Tissue and Organ Transplantation Industry Revenue Million Forecast, by Country 2019 & 2032
- Table 124: Global Tissue and Organ Transplantation Industry Volume K Unit Forecast, by Country 2019 & 2032
- Table 125: GCC Tissue and Organ Transplantation Industry Revenue (Million) Forecast, by Application 2019 & 2032
- Table 126: GCC Tissue and Organ Transplantation Industry Volume (K Unit) Forecast, by Application 2019 & 2032
- Table 127: South Africa Tissue and Organ Transplantation Industry Revenue (Million) Forecast, by Application 2019 & 2032
- Table 128: South Africa Tissue and Organ Transplantation Industry Volume (K Unit) Forecast, by Application 2019 & 2032
- Table 129: Rest of Middle East and Africa Tissue and Organ Transplantation Industry Revenue (Million) Forecast, by Application 2019 & 2032
- Table 130: Rest of Middle East and Africa Tissue and Organ Transplantation Industry Volume (K Unit) Forecast, by Application 2019 & 2032
- Table 131: Global Tissue and Organ Transplantation Industry Revenue Million Forecast, by Product 2019 & 2032
- Table 132: Global Tissue and Organ Transplantation Industry Volume K Unit Forecast, by Product 2019 & 2032
- Table 133: Global Tissue and Organ Transplantation Industry Revenue Million Forecast, by Application 2019 & 2032
- Table 134: Global Tissue and Organ Transplantation Industry Volume K Unit Forecast, by Application 2019 & 2032
- Table 135: Global Tissue and Organ Transplantation Industry Revenue Million Forecast, by End Use 2019 & 2032
- Table 136: Global Tissue and Organ Transplantation Industry Volume K Unit Forecast, by End Use 2019 & 2032
- Table 137: Global Tissue and Organ Transplantation Industry Revenue Million Forecast, by Country 2019 & 2032
- Table 138: Global Tissue and Organ Transplantation Industry Volume K Unit Forecast, by Country 2019 & 2032
- Table 139: Brazil Tissue and Organ Transplantation Industry Revenue (Million) Forecast, by Application 2019 & 2032
- Table 140: Brazil Tissue and Organ Transplantation Industry Volume (K Unit) Forecast, by Application 2019 & 2032
- Table 141: Argentina Tissue and Organ Transplantation Industry Revenue (Million) Forecast, by Application 2019 & 2032
- Table 142: Argentina Tissue and Organ Transplantation Industry Volume (K Unit) Forecast, by Application 2019 & 2032
- Table 143: Rest of South America Tissue and Organ Transplantation Industry Revenue (Million) Forecast, by Application 2019 & 2032
- Table 144: Rest of South America Tissue and Organ Transplantation Industry Volume (K Unit) Forecast, by Application 2019 & 2032
Frequently Asked Questions
1. What is the projected Compound Annual Growth Rate (CAGR) of the Tissue and Organ Transplantation Industry?
The projected CAGR is approximately 9.90%.
2. Which companies are prominent players in the Tissue and Organ Transplantation Industry?
Key companies in the market include Orthofix Medical, Arthrex Inc, Veloxis Pharmaceutical, Novartis AG, Medtronic, Amnio Technology, Strykers, Teva Pharmaceuticals, Abbvie Inc, Zimmer Biomet, BiolifeSolutions Inc, 21st Century Medicine.
3. What are the main segments of the Tissue and Organ Transplantation Industry?
The market segments include Product, Application, End Use.
4. Can you provide details about the market size?
The market size is estimated to be USD XX Million as of 2022.
5. What are some drivers contributing to market growth?
Increasing Burden of Chronic Diseases; Increasing Burden of Organ Failure; Technological Advancement in Transplantation Method.
6. What are the notable trends driving market growth?
Tissue Product Segment is Expected to Dominate the Market Over the Forecast Period.
7. Are there any restraints impacting market growth?
Shortage of Organ Donors; Ethical and Cultural Issues.
8. Can you provide examples of recent developments in the market?
In February 2022, Amnio Technology launched two new PalinGen membrane products, PalinGen Dual-Layer Membrane and Dual Layer PalinGen X-Membrane. The new allografts, like the entire family of PalinGen membrane products, are minimally manipulated, homologous use, and chorion-free.
9. What pricing options are available for accessing the report?
Pricing options include single-user, multi-user, and enterprise licenses priced at USD 4750, USD 5250, and USD 8750 respectively.
10. Is the market size provided in terms of value or volume?
The market size is provided in terms of value, measured in Million and volume, measured in K Unit.
11. Are there any specific market keywords associated with the report?
Yes, the market keyword associated with the report is "Tissue and Organ Transplantation Industry," which aids in identifying and referencing the specific market segment covered.
12. How do I determine which pricing option suits my needs best?
The pricing options vary based on user requirements and access needs. Individual users may opt for single-user licenses, while businesses requiring broader access may choose multi-user or enterprise licenses for cost-effective access to the report.
13. Are there any additional resources or data provided in the Tissue and Organ Transplantation Industry report?
While the report offers comprehensive insights, it's advisable to review the specific contents or supplementary materials provided to ascertain if additional resources or data are available.
14. How can I stay updated on further developments or reports in the Tissue and Organ Transplantation Industry?
To stay informed about further developments, trends, and reports in the Tissue and Organ Transplantation Industry, consider subscribing to industry newsletters, following relevant companies and organizations, or regularly checking reputable industry news sources and publications.
Methodology
Step 1 - Identification of Relevant Samples Size from Population Database


Step 2 - Approaches for Defining Global Market Size (Value, Volume* & Price*)

Note*: In applicable scenarios
Step 3 - Data Sources
Primary Research
- Web Analytics
- Survey Reports
- Research Institute
- Latest Research Reports
- Opinion Leaders
Secondary Research
- Annual Reports
- White Paper
- Latest Press Release
- Industry Association
- Paid Database
- Investor Presentations

Step 4 - Data Triangulation
Involves using different sources of information in order to increase the validity of a study
These sources are likely to be stakeholders in a program - participants, other researchers, program staff, other community members, and so on.
Then we put all data in single framework & apply various statistical tools to find out the dynamic on the market.
During the analysis stage, feedback from the stakeholder groups would be compared to determine areas of agreement as well as areas of divergence


