

Key Insights
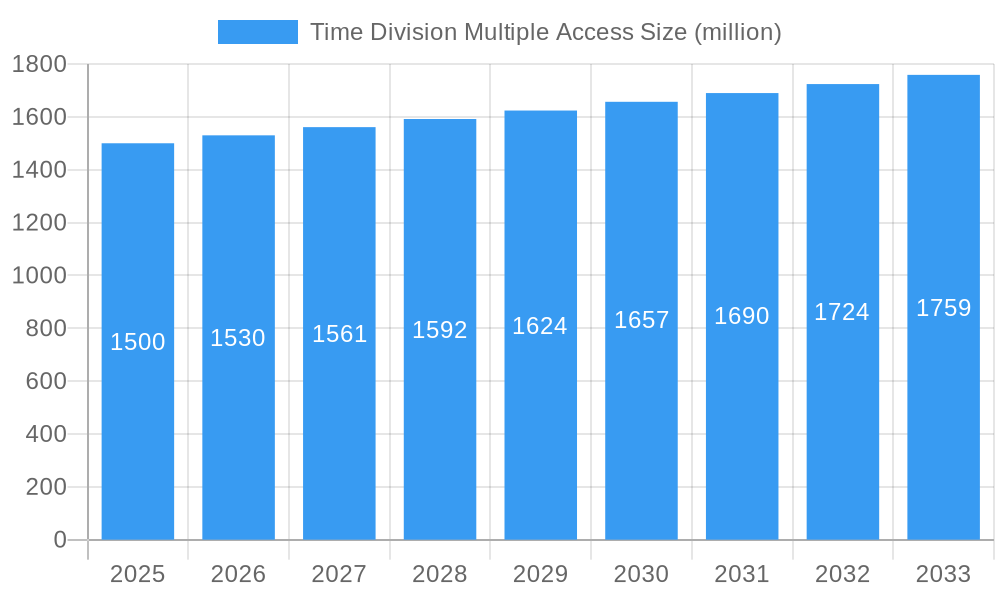
The Time Division Multiple Access (TDMA) market, while facing competition from more advanced technologies, retains a significant presence, particularly in legacy systems and niche applications. The market's value in 2025 is estimated at $1.5 billion, reflecting a steady but declining CAGR of approximately 2% from 2019-2024. This relatively low growth rate is attributed to the gradual migration towards more efficient and higher-capacity technologies like LTE and 5G. However, TDMA continues to find relevance in specific sectors requiring robust and reliable, albeit lower-bandwidth, communication, such as certain industrial control systems, specialized military applications, and remote monitoring networks. The market's resilience stems from the existing infrastructure investments and the cost-effectiveness of maintaining TDMA networks in these specialized scenarios. Key drivers include the need for secure and reliable communication in critical infrastructure, the relatively low cost of maintenance compared to newer technologies, and ongoing support from established players like Nokia and Ericsson who continue to provide maintenance and support services.
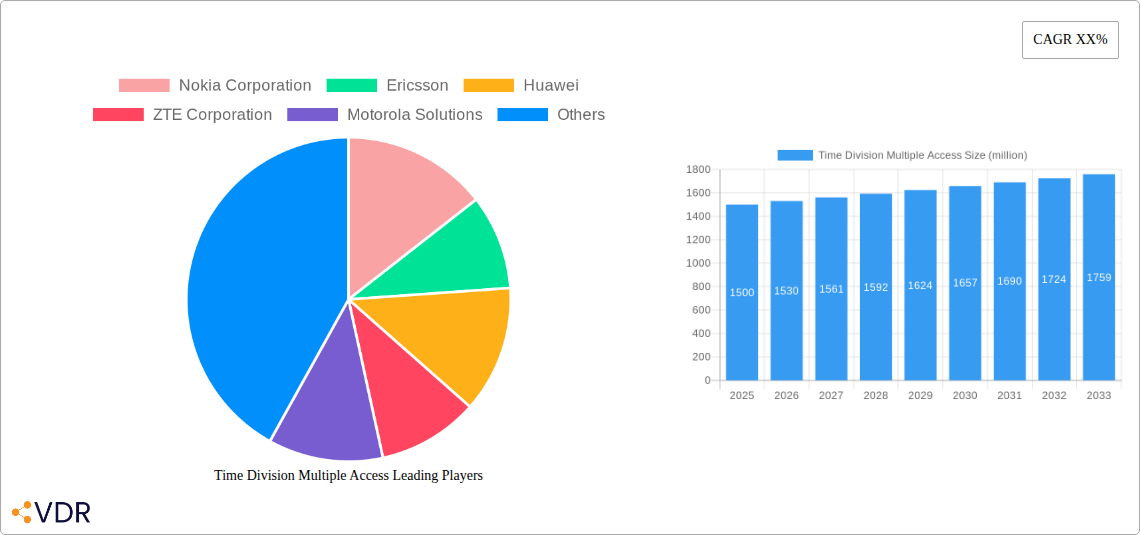
Time Division Multiple Access Market Size (In Billion)
Significant restraints on market expansion include the limited bandwidth capacity compared to newer technologies and the lack of innovation in the TDMA space. This has resulted in a relatively stagnant technological landscape, prompting organizations to actively transition towards more advanced solutions. The market is segmented by application (e.g., industrial automation, military communication), geographic region (with North America and Europe holding a significant share), and component type (infrastructure, devices). Major players like Nokia, Ericsson, Huawei, and ZTE continue to play a role, primarily in providing maintenance and support for existing TDMA installations. The forecast period (2025-2033) anticipates a slow, steady decline in market value as the adoption of newer technologies continues. However, the market is expected to maintain a niche presence due to its reliability and suitability for specialized applications.
Time Division Multiple Access Company Market Share
Time Division Multiple Access (TDMA) Market Report: 2019-2033
This comprehensive report provides an in-depth analysis of the Time Division Multiple Access (TDMA) market, encompassing historical data (2019-2024), current estimates (2025), and future forecasts (2025-2033). It offers valuable insights for industry professionals, investors, and strategic decision-makers seeking a granular understanding of this dynamic sector. The report covers key market segments, leading players like Nokia, Ericsson, and Huawei, and emerging trends shaping the future of TDMA technology. The market size is expected to reach xx million units by 2033.
Time Division Multiple Access Market Dynamics & Structure
The TDMA market exhibits a moderately concentrated structure, with key players holding significant market share. Technological innovation, primarily driven by the need for higher data rates and improved spectral efficiency, is a major growth driver. Stringent regulatory frameworks, particularly concerning spectrum allocation and licensing, significantly impact market dynamics. Competition from alternative technologies like CDMA and OFDMA presents a key challenge. The end-user demographic is broad, spanning telecommunications providers, military organizations, and industrial applications. M&A activity within the sector has been moderate, with a focus on strengthening technological capabilities and expanding market reach. Over the historical period (2019-2024), approximately xx M&A deals were recorded, resulting in a xx% increase in market concentration.
- Market Concentration: Moderately concentrated, with top 5 players holding xx% market share in 2025.
- Technological Innovation: Focus on 5G integration and improved spectral efficiency.
- Regulatory Framework: Stringent spectrum allocation policies influence market entry and growth.
- Competitive Substitutes: CDMA, OFDMA, and other multiple access technologies.
- End-User Demographics: Telecommunications operators, military, industrial applications.
- M&A Trends: Moderate activity focused on technology and market expansion.
Time Division Multiple Access Growth Trends & Insights
The TDMA market experienced a compound annual growth rate (CAGR) of xx% during the historical period (2019-2024), reaching an estimated market size of xx million units in 2025. This growth is attributed to increasing demand for reliable and efficient communication solutions across various sectors. Technological advancements, such as improved modulation techniques and enhanced error correction codes, have fueled adoption rates. However, the emergence of competing technologies is expected to moderate future growth, resulting in a projected CAGR of xx% during the forecast period (2025-2033). Market penetration in developing regions remains a key growth opportunity. Consumer behavior is shifting towards more data-intensive applications, further driving the need for efficient multiple access technologies. The increasing adoption of IoT devices is also contributing to market growth.
Dominant Regions, Countries, or Segments in Time Division Multiple Access
North America currently holds the largest market share in TDMA, driven by robust technological infrastructure and high demand for secure communication systems within the defense sector. The Asia-Pacific region is also experiencing significant growth due to increasing investments in telecom infrastructure and growing adoption of TDMA technologies in emerging economies. Specific countries like the USA, China, and Japan are key players, benefiting from favorable economic policies, supportive government regulations, and substantial investments in R&D.
- Key Drivers (North America): Strong telecom infrastructure, high defense spending, advanced technological adoption.
- Key Drivers (Asia-Pacific): Rising investments in telecom infrastructure, growing adoption in emerging economies.
- Dominance Factors: Market size, economic growth, government support, technological advancements.
Time Division Multiple Access Product Landscape
TDMA products are characterized by variations in bandwidth, power consumption, and data transmission rates. Innovation focuses on improving spectral efficiency, enhancing security, and integrating with next-generation communication networks. Unique selling propositions include enhanced reliability, improved security features, and cost-effectiveness compared to alternative technologies in specific niche applications. Advancements in signal processing and error correction contribute to increased data throughput and reduced latency.
Key Drivers, Barriers & Challenges in Time Division Multiple Access
Key Drivers: The need for secure communication, particularly in defense and government applications, is a major driver. Cost-effectiveness compared to other technologies in specific niche applications is another key factor. The increasing demand for reliable wireless communication in industrial settings further fuels market growth.
Challenges: Competition from more advanced technologies like OFDMA presents a significant barrier. Regulatory hurdles related to spectrum allocation and licensing can hinder market expansion. Supply chain disruptions, particularly concerning semiconductor components, could impact production and increase costs.
Emerging Opportunities in Time Division Multiple Access
Untapped markets in developing countries present significant growth opportunities. Innovative applications in industrial IoT (IIoT) and smart city infrastructure offer promising avenues for expansion. The increasing demand for secure communication in critical infrastructure sectors also provides substantial potential.
Growth Accelerators in the Time Division Multiple Access Industry
Technological breakthroughs in areas like spectrum management and modulation techniques will propel market growth. Strategic partnerships between technology providers and telecom operators will enhance market penetration. Expansion into new applications and markets, especially within the IIoT sector, will further accelerate growth.
Key Players Shaping the Time Division Multiple Access Market
Notable Milestones in Time Division Multiple Access Sector
- 2020, Q3: Nokia launched its enhanced TDMA solution with improved security features.
- 2021, Q1: Huawei announced a strategic partnership with a major telecom operator to expand TDMA deployment in Southeast Asia.
- 2022, Q4: Ericsson released a new generation of TDMA chipsets with increased data throughput. (Further milestones can be added here with specific dates and impacts).
In-Depth Time Division Multiple Access Market Outlook
The future of the TDMA market is characterized by a moderate growth trajectory, driven by continued demand in niche applications and ongoing technological advancements. Strategic partnerships and expansion into emerging markets will be crucial for long-term success. The market is expected to witness increased competition from alternative technologies, necessitating innovation and adaptability from existing players. Focus on enhanced security features, improved energy efficiency, and seamless integration with other communication systems will be key differentiators in the coming years.
Time Division Multiple Access Segmentation
-
1. Application
- 1.1. Communication
- 1.2. Railways
- 1.3. Military and Defense
- 1.4. Public Safety
- 1.5. Automotive
-
2. Types
- 2.1. 2G (Second Generation)
- 2.2. 3G (Third Generation)
- 2.3. 4G (Fourth Generation)
- 2.4. 5G (Fifth Generation)
Time Division Multiple Access Segmentation By Geography
-
1. North America
- 1.1. United States
- 1.2. Canada
- 1.3. Mexico
-
2. South America
- 2.1. Brazil
- 2.2. Argentina
- 2.3. Rest of South America
-
3. Europe
- 3.1. United Kingdom
- 3.2. Germany
- 3.3. France
- 3.4. Italy
- 3.5. Spain
- 3.6. Russia
- 3.7. Benelux
- 3.8. Nordics
- 3.9. Rest of Europe
-
4. Middle East & Africa
- 4.1. Turkey
- 4.2. Israel
- 4.3. GCC
- 4.4. North Africa
- 4.5. South Africa
- 4.6. Rest of Middle East & Africa
-
5. Asia Pacific
- 5.1. China
- 5.2. India
- 5.3. Japan
- 5.4. South Korea
- 5.5. ASEAN
- 5.6. Oceania
- 5.7. Rest of Asia Pacific

Time Division Multiple Access Regional Market Share
Geographic Coverage of Time Division Multiple Access
Time Division Multiple Access REPORT HIGHLIGHTS
| Aspects | Details |
|---|---|
| Study Period | 2020-2034 |
| Base Year | 2025 |
| Estimated Year | 2026 |
| Forecast Period | 2026-2034 |
| Historical Period | 2020-2025 |
| Growth Rate | CAGR of 9.26% from 2020-2034 |
| Segmentation |
|
Table of Contents
- 1. Introduction
- 1.1. Research Scope
- 1.2. Market Segmentation
- 1.3. Research Objective
- 1.4. Definitions and Assumptions
- 2. Executive Summary
- 2.1. Market Snapshot
- 3. Market Dynamics
- 3.1. Market Drivers
- 3.2. Market Restrains
- 3.3. Market Trends
- 3.4. Market Opportunities
- 4. Market Factor Analysis
- 4.1. Porters Five Forces
- 4.1.1. Bargaining Power of Suppliers
- 4.1.2. Bargaining Power of Buyers
- 4.1.3. Threat of New Entrants
- 4.1.4. Threat of Substitutes
- 4.1.5. Competitive Rivalry
- 4.2. PESTEL analysis
- 4.3. BCG Analysis
- 4.3.1. Stars (High Growth, High Market Share)
- 4.3.2. Cash Cows (Low Growth, High Market Share)
- 4.3.3. Question Mark (High Growth, Low Market Share)
- 4.3.4. Dogs (Low Growth, Low Market Share)
- 4.4. Ansoff Matrix Analysis
- 4.5. Supply Chain Analysis
- 4.6. Regulatory Landscape
- 4.7. Current Market Potential and Opportunity Assessment (TAM–SAM–SOM Framework)
- 4.8. VDR Analyst Note
- 4.1. Porters Five Forces
- 5. Market Analysis, Insights and Forecast 2021-2033
- 5.1. Market Analysis, Insights and Forecast - by Application
- 5.1.1. Communication
- 5.1.2. Railways
- 5.1.3. Military and Defense
- 5.1.4. Public Safety
- 5.1.5. Automotive
- 5.2. Market Analysis, Insights and Forecast - by Types
- 5.2.1. 2G (Second Generation)
- 5.2.2. 3G (Third Generation)
- 5.2.3. 4G (Fourth Generation)
- 5.2.4. 5G (Fifth Generation)
- 5.3. Market Analysis, Insights and Forecast - by Region
- 5.3.1. North America
- 5.3.2. South America
- 5.3.3. Europe
- 5.3.4. Middle East & Africa
- 5.3.5. Asia Pacific
- 5.1. Market Analysis, Insights and Forecast - by Application
- 6. Global Time Division Multiple Access Analysis, Insights and Forecast, 2021-2033
- 6.1. Market Analysis, Insights and Forecast - by Application
- 6.1.1. Communication
- 6.1.2. Railways
- 6.1.3. Military and Defense
- 6.1.4. Public Safety
- 6.1.5. Automotive
- 6.2. Market Analysis, Insights and Forecast - by Types
- 6.2.1. 2G (Second Generation)
- 6.2.2. 3G (Third Generation)
- 6.2.3. 4G (Fourth Generation)
- 6.2.4. 5G (Fifth Generation)
- 6.1. Market Analysis, Insights and Forecast - by Application
- 7. North America Time Division Multiple Access Analysis, Insights and Forecast, 2021-2033
- 7.1. Market Analysis, Insights and Forecast - by Application
- 7.1.1. Communication
- 7.1.2. Railways
- 7.1.3. Military and Defense
- 7.1.4. Public Safety
- 7.1.5. Automotive
- 7.2. Market Analysis, Insights and Forecast - by Types
- 7.2.1. 2G (Second Generation)
- 7.2.2. 3G (Third Generation)
- 7.2.3. 4G (Fourth Generation)
- 7.2.4. 5G (Fifth Generation)
- 7.1. Market Analysis, Insights and Forecast - by Application
- 8. South America Time Division Multiple Access Analysis, Insights and Forecast, 2021-2033
- 8.1. Market Analysis, Insights and Forecast - by Application
- 8.1.1. Communication
- 8.1.2. Railways
- 8.1.3. Military and Defense
- 8.1.4. Public Safety
- 8.1.5. Automotive
- 8.2. Market Analysis, Insights and Forecast - by Types
- 8.2.1. 2G (Second Generation)
- 8.2.2. 3G (Third Generation)
- 8.2.3. 4G (Fourth Generation)
- 8.2.4. 5G (Fifth Generation)
- 8.1. Market Analysis, Insights and Forecast - by Application
- 9. Europe Time Division Multiple Access Analysis, Insights and Forecast, 2021-2033
- 9.1. Market Analysis, Insights and Forecast - by Application
- 9.1.1. Communication
- 9.1.2. Railways
- 9.1.3. Military and Defense
- 9.1.4. Public Safety
- 9.1.5. Automotive
- 9.2. Market Analysis, Insights and Forecast - by Types
- 9.2.1. 2G (Second Generation)
- 9.2.2. 3G (Third Generation)
- 9.2.3. 4G (Fourth Generation)
- 9.2.4. 5G (Fifth Generation)
- 9.1. Market Analysis, Insights and Forecast - by Application
- 10. Middle East & Africa Time Division Multiple Access Analysis, Insights and Forecast, 2021-2033
- 10.1. Market Analysis, Insights and Forecast - by Application
- 10.1.1. Communication
- 10.1.2. Railways
- 10.1.3. Military and Defense
- 10.1.4. Public Safety
- 10.1.5. Automotive
- 10.2. Market Analysis, Insights and Forecast - by Types
- 10.2.1. 2G (Second Generation)
- 10.2.2. 3G (Third Generation)
- 10.2.3. 4G (Fourth Generation)
- 10.2.4. 5G (Fifth Generation)
- 10.1. Market Analysis, Insights and Forecast - by Application
- 11. Asia Pacific Time Division Multiple Access Analysis, Insights and Forecast, 2021-2033
- 11.1. Market Analysis, Insights and Forecast - by Application
- 11.1.1. Communication
- 11.1.2. Railways
- 11.1.3. Military and Defense
- 11.1.4. Public Safety
- 11.1.5. Automotive
- 11.2. Market Analysis, Insights and Forecast - by Types
- 11.2.1. 2G (Second Generation)
- 11.2.2. 3G (Third Generation)
- 11.2.3. 4G (Fourth Generation)
- 11.2.4. 5G (Fifth Generation)
- 11.1. Market Analysis, Insights and Forecast - by Application
- 12. Competitive Analysis
- 12.1. Company Profiles
- 12.1.1 Nokia Corporation
- 12.1.1.1. Company Overview
- 12.1.1.2. Products
- 12.1.1.3. Company Financials
- 12.1.1.4. SWOT Analysis
- 12.1.2 Ericsson
- 12.1.2.1. Company Overview
- 12.1.2.2. Products
- 12.1.2.3. Company Financials
- 12.1.2.4. SWOT Analysis
- 12.1.3 Huawei
- 12.1.3.1. Company Overview
- 12.1.3.2. Products
- 12.1.3.3. Company Financials
- 12.1.3.4. SWOT Analysis
- 12.1.4 ZTE Corporation
- 12.1.4.1. Company Overview
- 12.1.4.2. Products
- 12.1.4.3. Company Financials
- 12.1.4.4. SWOT Analysis
- 12.1.5 Motorola Solutions
- 12.1.5.1. Company Overview
- 12.1.5.2. Products
- 12.1.5.3. Company Financials
- 12.1.5.4. SWOT Analysis
- 12.1.6 NEC Corporation
- 12.1.6.1. Company Overview
- 12.1.6.2. Products
- 12.1.6.3. Company Financials
- 12.1.6.4. SWOT Analysis
- 12.1.7 Qualcomm Technologies
- 12.1.7.1. Company Overview
- 12.1.7.2. Products
- 12.1.7.3. Company Financials
- 12.1.7.4. SWOT Analysis
- 12.1.8 Harris Corporation
- 12.1.8.1. Company Overview
- 12.1.8.2. Products
- 12.1.8.3. Company Financials
- 12.1.8.4. SWOT Analysis
- 12.1.9 Thales Group
- 12.1.9.1. Company Overview
- 12.1.9.2. Products
- 12.1.9.3. Company Financials
- 12.1.9.4. SWOT Analysis
- 12.1.10 Alcatel-Lucent
- 12.1.10.1. Company Overview
- 12.1.10.2. Products
- 12.1.10.3. Company Financials
- 12.1.10.4. SWOT Analysis
- 12.1.1 Nokia Corporation
- 12.2. Market Entropy
- 12.2.1 Company's Key Areas Served
- 12.2.2 Recent Developments
- 12.3. Company Market Share Analysis 2025
- 12.3.1 Top 5 Companies Market Share Analysis
- 12.3.2 Top 3 Companies Market Share Analysis
- 12.4. List of Potential Customers
- 13. Research Methodology
List of Figures
- Figure 1: Global Time Division Multiple Access Revenue Breakdown (undefined, %) by Region 2025 & 2033
- Figure 2: North America Time Division Multiple Access Revenue (undefined), by Application 2025 & 2033
- Figure 3: North America Time Division Multiple Access Revenue Share (%), by Application 2025 & 2033
- Figure 4: North America Time Division Multiple Access Revenue (undefined), by Types 2025 & 2033
- Figure 5: North America Time Division Multiple Access Revenue Share (%), by Types 2025 & 2033
- Figure 6: North America Time Division Multiple Access Revenue (undefined), by Country 2025 & 2033
- Figure 7: North America Time Division Multiple Access Revenue Share (%), by Country 2025 & 2033
- Figure 8: South America Time Division Multiple Access Revenue (undefined), by Application 2025 & 2033
- Figure 9: South America Time Division Multiple Access Revenue Share (%), by Application 2025 & 2033
- Figure 10: South America Time Division Multiple Access Revenue (undefined), by Types 2025 & 2033
- Figure 11: South America Time Division Multiple Access Revenue Share (%), by Types 2025 & 2033
- Figure 12: South America Time Division Multiple Access Revenue (undefined), by Country 2025 & 2033
- Figure 13: South America Time Division Multiple Access Revenue Share (%), by Country 2025 & 2033
- Figure 14: Europe Time Division Multiple Access Revenue (undefined), by Application 2025 & 2033
- Figure 15: Europe Time Division Multiple Access Revenue Share (%), by Application 2025 & 2033
- Figure 16: Europe Time Division Multiple Access Revenue (undefined), by Types 2025 & 2033
- Figure 17: Europe Time Division Multiple Access Revenue Share (%), by Types 2025 & 2033
- Figure 18: Europe Time Division Multiple Access Revenue (undefined), by Country 2025 & 2033
- Figure 19: Europe Time Division Multiple Access Revenue Share (%), by Country 2025 & 2033
- Figure 20: Middle East & Africa Time Division Multiple Access Revenue (undefined), by Application 2025 & 2033
- Figure 21: Middle East & Africa Time Division Multiple Access Revenue Share (%), by Application 2025 & 2033
- Figure 22: Middle East & Africa Time Division Multiple Access Revenue (undefined), by Types 2025 & 2033
- Figure 23: Middle East & Africa Time Division Multiple Access Revenue Share (%), by Types 2025 & 2033
- Figure 24: Middle East & Africa Time Division Multiple Access Revenue (undefined), by Country 2025 & 2033
- Figure 25: Middle East & Africa Time Division Multiple Access Revenue Share (%), by Country 2025 & 2033
- Figure 26: Asia Pacific Time Division Multiple Access Revenue (undefined), by Application 2025 & 2033
- Figure 27: Asia Pacific Time Division Multiple Access Revenue Share (%), by Application 2025 & 2033
- Figure 28: Asia Pacific Time Division Multiple Access Revenue (undefined), by Types 2025 & 2033
- Figure 29: Asia Pacific Time Division Multiple Access Revenue Share (%), by Types 2025 & 2033
- Figure 30: Asia Pacific Time Division Multiple Access Revenue (undefined), by Country 2025 & 2033
- Figure 31: Asia Pacific Time Division Multiple Access Revenue Share (%), by Country 2025 & 2033
List of Tables
- Table 1: Global Time Division Multiple Access Revenue undefined Forecast, by Application 2020 & 2033
- Table 2: Global Time Division Multiple Access Revenue undefined Forecast, by Types 2020 & 2033
- Table 3: Global Time Division Multiple Access Revenue undefined Forecast, by Region 2020 & 2033
- Table 4: Global Time Division Multiple Access Revenue undefined Forecast, by Application 2020 & 2033
- Table 5: Global Time Division Multiple Access Revenue undefined Forecast, by Types 2020 & 2033
- Table 6: Global Time Division Multiple Access Revenue undefined Forecast, by Country 2020 & 2033
- Table 7: United States Time Division Multiple Access Revenue (undefined) Forecast, by Application 2020 & 2033
- Table 8: Canada Time Division Multiple Access Revenue (undefined) Forecast, by Application 2020 & 2033
- Table 9: Mexico Time Division Multiple Access Revenue (undefined) Forecast, by Application 2020 & 2033
- Table 10: Global Time Division Multiple Access Revenue undefined Forecast, by Application 2020 & 2033
- Table 11: Global Time Division Multiple Access Revenue undefined Forecast, by Types 2020 & 2033
- Table 12: Global Time Division Multiple Access Revenue undefined Forecast, by Country 2020 & 2033
- Table 13: Brazil Time Division Multiple Access Revenue (undefined) Forecast, by Application 2020 & 2033
- Table 14: Argentina Time Division Multiple Access Revenue (undefined) Forecast, by Application 2020 & 2033
- Table 15: Rest of South America Time Division Multiple Access Revenue (undefined) Forecast, by Application 2020 & 2033
- Table 16: Global Time Division Multiple Access Revenue undefined Forecast, by Application 2020 & 2033
- Table 17: Global Time Division Multiple Access Revenue undefined Forecast, by Types 2020 & 2033
- Table 18: Global Time Division Multiple Access Revenue undefined Forecast, by Country 2020 & 2033
- Table 19: United Kingdom Time Division Multiple Access Revenue (undefined) Forecast, by Application 2020 & 2033
- Table 20: Germany Time Division Multiple Access Revenue (undefined) Forecast, by Application 2020 & 2033
- Table 21: France Time Division Multiple Access Revenue (undefined) Forecast, by Application 2020 & 2033
- Table 22: Italy Time Division Multiple Access Revenue (undefined) Forecast, by Application 2020 & 2033
- Table 23: Spain Time Division Multiple Access Revenue (undefined) Forecast, by Application 2020 & 2033
- Table 24: Russia Time Division Multiple Access Revenue (undefined) Forecast, by Application 2020 & 2033
- Table 25: Benelux Time Division Multiple Access Revenue (undefined) Forecast, by Application 2020 & 2033
- Table 26: Nordics Time Division Multiple Access Revenue (undefined) Forecast, by Application 2020 & 2033
- Table 27: Rest of Europe Time Division Multiple Access Revenue (undefined) Forecast, by Application 2020 & 2033
- Table 28: Global Time Division Multiple Access Revenue undefined Forecast, by Application 2020 & 2033
- Table 29: Global Time Division Multiple Access Revenue undefined Forecast, by Types 2020 & 2033
- Table 30: Global Time Division Multiple Access Revenue undefined Forecast, by Country 2020 & 2033
- Table 31: Turkey Time Division Multiple Access Revenue (undefined) Forecast, by Application 2020 & 2033
- Table 32: Israel Time Division Multiple Access Revenue (undefined) Forecast, by Application 2020 & 2033
- Table 33: GCC Time Division Multiple Access Revenue (undefined) Forecast, by Application 2020 & 2033
- Table 34: North Africa Time Division Multiple Access Revenue (undefined) Forecast, by Application 2020 & 2033
- Table 35: South Africa Time Division Multiple Access Revenue (undefined) Forecast, by Application 2020 & 2033
- Table 36: Rest of Middle East & Africa Time Division Multiple Access Revenue (undefined) Forecast, by Application 2020 & 2033
- Table 37: Global Time Division Multiple Access Revenue undefined Forecast, by Application 2020 & 2033
- Table 38: Global Time Division Multiple Access Revenue undefined Forecast, by Types 2020 & 2033
- Table 39: Global Time Division Multiple Access Revenue undefined Forecast, by Country 2020 & 2033
- Table 40: China Time Division Multiple Access Revenue (undefined) Forecast, by Application 2020 & 2033
- Table 41: India Time Division Multiple Access Revenue (undefined) Forecast, by Application 2020 & 2033
- Table 42: Japan Time Division Multiple Access Revenue (undefined) Forecast, by Application 2020 & 2033
- Table 43: South Korea Time Division Multiple Access Revenue (undefined) Forecast, by Application 2020 & 2033
- Table 44: ASEAN Time Division Multiple Access Revenue (undefined) Forecast, by Application 2020 & 2033
- Table 45: Oceania Time Division Multiple Access Revenue (undefined) Forecast, by Application 2020 & 2033
- Table 46: Rest of Asia Pacific Time Division Multiple Access Revenue (undefined) Forecast, by Application 2020 & 2033
Frequently Asked Questions
1. What is the projected Compound Annual Growth Rate (CAGR) of the Time Division Multiple Access?
The projected CAGR is approximately 9.26%.
2. Which companies are prominent players in the Time Division Multiple Access?
Key companies in the market include Nokia Corporation, Ericsson, Huawei, ZTE Corporation, Motorola Solutions, NEC Corporation, Qualcomm Technologies, Harris Corporation, Thales Group, Alcatel-Lucent.
3. What are the main segments of the Time Division Multiple Access?
The market segments include Application, Types.
4. Can you provide details about the market size?
The market size is estimated to be USD XXX N/A as of 2022.
5. What are some drivers contributing to market growth?
N/A
6. What are the notable trends driving market growth?
N/A
7. Are there any restraints impacting market growth?
N/A
8. Can you provide examples of recent developments in the market?
N/A
9. What pricing options are available for accessing the report?
Pricing options include single-user, multi-user, and enterprise licenses priced at USD 2900.00, USD 4350.00, and USD 5800.00 respectively.
10. Is the market size provided in terms of value or volume?
The market size is provided in terms of value, measured in N/A.
11. Are there any specific market keywords associated with the report?
Yes, the market keyword associated with the report is "Time Division Multiple Access," which aids in identifying and referencing the specific market segment covered.
12. How do I determine which pricing option suits my needs best?
The pricing options vary based on user requirements and access needs. Individual users may opt for single-user licenses, while businesses requiring broader access may choose multi-user or enterprise licenses for cost-effective access to the report.
13. Are there any additional resources or data provided in the Time Division Multiple Access report?
While the report offers comprehensive insights, it's advisable to review the specific contents or supplementary materials provided to ascertain if additional resources or data are available.
14. How can I stay updated on further developments or reports in the Time Division Multiple Access?
To stay informed about further developments, trends, and reports in the Time Division Multiple Access, consider subscribing to industry newsletters, following relevant companies and organizations, or regularly checking reputable industry news sources and publications.
Methodology
Step 1 - Identification of Relevant Samples Size from Population Database


Step 2 - Approaches for Defining Global Market Size (Value, Volume* & Price*)

Note*: In applicable scenarios
Step 3 - Data Sources
Primary Research
- Web Analytics
- Survey Reports
- Research Institute
- Latest Research Reports
- Opinion Leaders
Secondary Research
- Annual Reports
- White Paper
- Latest Press Release
- Industry Association
- Paid Database
- Investor Presentations

Step 4 - Data Triangulation
Involves using different sources of information in order to increase the validity of a study
These sources are likely to be stakeholders in a program - participants, other researchers, program staff, other community members, and so on.
Then we put all data in single framework & apply various statistical tools to find out the dynamic on the market.
During the analysis stage, feedback from the stakeholder groups would be compared to determine areas of agreement as well as areas of divergence