
Key Insights
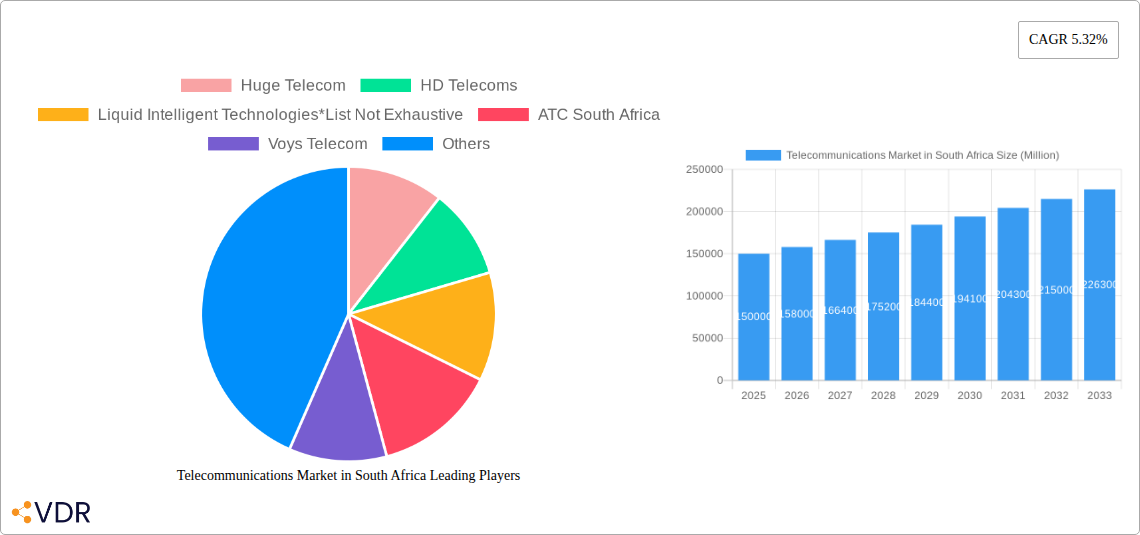
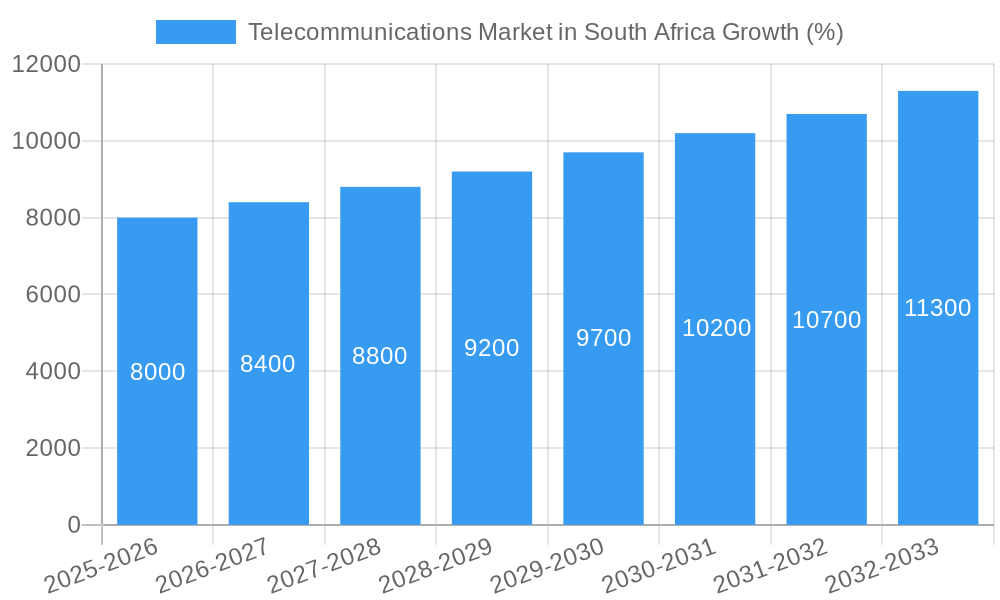
The South African telecommunications market, valued at approximately ZAR 150 billion in 2025, is experiencing robust growth, projected to maintain a Compound Annual Growth Rate (CAGR) of 5.32% between 2025 and 2033. This expansion is fueled by increasing smartphone penetration, rising data consumption driven by the adoption of mobile internet and OTT services, and the ongoing expansion of 4G and 5G networks across the country. Key market segments include voice services, which remain significant despite the rise of data, and wireless data and messaging, experiencing exponential growth due to the affordability and accessibility of data packages and attractive bundled offers. The burgeoning OTT and PayTV market further contributes to market expansion, presenting significant opportunities for telecom operators. However, challenges persist, including regulatory hurdles, infrastructure limitations in rural areas, and competition among established players like MTN South Africa, Vodacom South Africa, Telkom SA SOC Limited, Cell C Limited, and others, including smaller but significant players like Liquid Intelligent Technologies and Saicom South Africa. The average revenue per user (ARPU) for services is expected to remain relatively stable, with growth driven mainly by increased subscriber numbers and data consumption. Furthermore, the market is witnessing innovation in areas such as mobile financial services, enhancing the overall value proposition for customers.
The competitive landscape is dynamic, with established players constantly vying for market share through innovative offerings and strategic partnerships. The expansion into underserved areas, focusing on affordable connectivity solutions, and leveraging technological advancements like 5G, will be crucial for future success. The South African market demonstrates resilience despite economic fluctuations, underpinned by a large and increasingly digitally-savvy population. Growth will be influenced by factors such as government initiatives promoting digital inclusion, economic growth, and the evolving consumer preferences for affordable and high-quality telecommunication services. This necessitates a strong focus on infrastructure development, effective regulation and fostering innovation in order for the South African telecommunications market to continue its upward trajectory.
Telecommunications Market in South Africa: A Comprehensive Report (2019-2033)
This in-depth report provides a comprehensive analysis of the South African telecommunications market, encompassing market dynamics, growth trends, competitive landscape, and future outlook. With a study period spanning 2019-2033, a base year of 2025, and a forecast period of 2025-2033, this report is an invaluable resource for industry professionals, investors, and strategic planners. The report features detailed segmentation by services, including Voice Services, Wireless Data & Messaging Services (Internet & Handset Data packages, Package Discounts), and OTT & PayTV Services, providing granular insights into market size (in Million units) and Average Revenue Per User (ARPU). Key players like Vodacom South Africa, MTN South Africa, Telkom SA SOC Limited, and Cell C Limited are thoroughly examined.
Telecommunications Market in South Africa Market Dynamics & Structure
The South African telecommunications market is characterized by a high degree of market concentration amongst a few dominant players and significant technological innovation, shaped by a dynamic regulatory framework. The market exhibits robust competition, with substitute products continually emerging, and is influenced by evolving end-user demographics and a steady stream of M&A activity.
- Market Concentration: The market is dominated by a few large players, with Vodacom and MTN holding significant market share. Smaller players compete intensely for market share. Precise market share percentages are detailed within the full report. (xx% for Vodacom, xx% for MTN, and xx% for others in 2024, for example).
- Technological Innovation: The rapid adoption of 5G technology and the expansion of fiber optic networks are key drivers of innovation. However, barriers such as high infrastructure costs and regulatory complexities hinder widespread adoption in certain areas.
- Regulatory Framework: The Independent Communications Authority of South Africa (ICASA) plays a pivotal role in shaping the market through licensing, spectrum allocation, and consumer protection regulations. Recent policy shifts impacting data pricing and infrastructure development are analyzed in the report.
- Competitive Substitutes: Over-the-top (OTT) services, such as WhatsApp and Skype, pose a significant challenge to traditional voice and messaging services. The rise of VoIP technology further intensifies competition.
- End-User Demographics: The report examines the influence of demographics – including age, income, and location – on service consumption patterns and demand.
- M&A Trends: The South African telecommunications market has witnessed several significant mergers and acquisitions in recent years, driven by consolidation and expansion strategies. The report quantifies these trends, detailing deal volumes and their impact on the competitive landscape. (e.g., xx M&A deals in the past 5 years).
Telecommunications Market in South Africa Growth Trends & Insights
The South African telecommunications market has experienced considerable growth over the past few years, driven by increasing mobile penetration, rising data consumption, and ongoing investments in network infrastructure. The Compound Annual Growth Rate (CAGR) for the overall market during the historical period (2019-2024) is estimated at xx%. The report details the evolution of market size across different segments, highlighting the transition from voice to data services. Technological disruptions, particularly the roll-out of 5G and the growth of fiber optic networks, have profoundly impacted market dynamics. Consumer behavior shifts, such as increased demand for bundled services and mobile money transactions, are also analyzed, providing detailed market penetration metrics for various services.
Dominant Regions, Countries, or Segments in Telecommunications Market in South Africa
Market dominance is largely concentrated in major urban centers, reflecting higher population density and better infrastructure. The Wireless Data and Messaging Services segment shows the highest growth, driven by the increasing demand for mobile internet access and data-intensive applications.
- Key Growth Drivers:
- Economic Growth: Economic expansion fuels higher disposable income, increasing spending on telecommunications services.
- Government Policies: Regulatory frameworks promoting competition and infrastructure investment influence market expansion.
- Infrastructure Development: Investments in 5G and fiber optics networks significantly increase service accessibility and quality.
The report details market share and growth potential for each segment (Voice, Data & Messaging, OTT & PayTV) across different regions of South Africa, identifying the leading regions and the factors contributing to their dominance. Average Revenue Per User (ARPU) trends within each segment are also analysed. Detailed market size estimates for each segment from 2020-2027 are included within the full report.
Telecommunications Market in South Africa Product Landscape
The South African telecommunications market is characterized by a wide range of products and services, including prepaid and postpaid mobile plans, fixed-line broadband services, and various value-added services. The key focus is on innovative data packages, bundled offerings combining voice, data, and other services, and the introduction of advanced technologies such as 5G. Competition is fierce, pushing companies to develop unique selling propositions (USPs) focused on price competitiveness, data allowances, and network reliability.
Key Drivers, Barriers & Challenges in Telecommunications Market in South Africa
Key Drivers: Increasing mobile penetration, rising data consumption, government investment in infrastructure, and the expansion of 5G networks are among the primary factors driving market growth.
Challenges: High infrastructure costs, the digital divide, regulatory hurdles, and competition from OTT services pose significant challenges to the market. For instance, limited access to reliable broadband infrastructure in rural areas impacts market expansion and the achievement of universal service. The impact of these challenges on market growth is quantified within the report.
Emerging Opportunities in Telecommunications Market in South Africa
The expansion of 5G networks and the growing adoption of IoT present substantial opportunities. The demand for fixed wireless access services (FWAS) is also expected to increase. Moreover, the development of digital financial services and the integration of telecommunications with other sectors, such as healthcare and education, create further growth avenues.
Growth Accelerators in the Telecommunications Market in South Africa Industry
Strategic partnerships, investments in infrastructure development, and technological advancements like the implementation of 5G and improved network coverage will be crucial for accelerating market growth. This, combined with the ongoing shift towards data-centric services and the potential for expanding services to underserved markets, promises considerable long-term expansion.
Key Players Shaping the Telecommunications Market in South Africa Market
- Huge Telecom (If applicable, replace with actual link)
- HD Telecoms (If applicable, replace with actual link)
- Liquid Intelligent Technologies
- ATC South Africa
- Voys Telecom
- Cell C Limited
- MTN South Africa
- Telkom SA SOC Limited
- Saicom South Africa
- Vodacom South Africa
Notable Milestones in Telecommunications Market in South Africa Sector
- October 2022: Vodacom South Africa extends its SD-WAN solution across 47 African nations.
- October 2022: Telkom SA launches its 5G high-speed internet network using Huawei technology.
In-Depth Telecommunications Market in South Africa Market Outlook
The South African telecommunications market presents significant long-term growth potential, driven by technological advancements, strategic investments, and expanding service offerings. The continued rollout of 5G, the expansion of fiber optic networks, and the increasing adoption of IoT and digital financial services create ample opportunities for market players. Strategic partnerships and innovative business models will be key to unlocking this potential.
Telecommunications Market in South Africa Segmentation
-
1. Segmenta
-
1.1. Voice Services
- 1.1.1. Wired
- 1.1.2. Wireless
- 1.2. Data and
- 1.3. OTT and PayTV Services
-
1.1. Voice Services
Telecommunications Market in South Africa Segmentation By Geography
-
1. North America
- 1.1. United States
- 1.2. Canada
- 1.3. Mexico
-
2. South America
- 2.1. Brazil
- 2.2. Argentina
- 2.3. Rest of South America
-
3. Europe
- 3.1. United Kingdom
- 3.2. Germany
- 3.3. France
- 3.4. Italy
- 3.5. Spain
- 3.6. Russia
- 3.7. Benelux
- 3.8. Nordics
- 3.9. Rest of Europe
-
4. Middle East & Africa
- 4.1. Turkey
- 4.2. Israel
- 4.3. GCC
- 4.4. North Africa
- 4.5. South Africa
- 4.6. Rest of Middle East & Africa
-
5. Asia Pacific
- 5.1. China
- 5.2. India
- 5.3. Japan
- 5.4. South Korea
- 5.5. ASEAN
- 5.6. Oceania
- 5.7. Rest of Asia Pacific
Telecommunications Market in South Africa REPORT HIGHLIGHTS
| Aspects | Details |
|---|---|
| Study Period | 2019-2033 |
| Base Year | 2024 |
| Estimated Year | 2025 |
| Forecast Period | 2025-2033 |
| Historical Period | 2019-2024 |
| Growth Rate | CAGR of 5.32% from 2019-2033 |
| Segmentation |
|
Table of Contents
- 1. Introduction
- 1.1. Research Scope
- 1.2. Market Segmentation
- 1.3. Research Methodology
- 1.4. Definitions and Assumptions
- 2. Executive Summary
- 2.1. Introduction
- 3. Market Dynamics
- 3.1. Introduction
- 3.2. Market Drivers
- 3.2.1. Demand of Mobile Phones; Active 5G Roll Out
- 3.3. Market Restrains
- 3.3.1. Combining Data from Multiple Data Sources
- 3.4. Market Trends
- 3.4.1. Roll Out of 5G
- 4. Market Factor Analysis
- 4.1. Porters Five Forces
- 4.2. Supply/Value Chain
- 4.3. PESTEL analysis
- 4.4. Market Entropy
- 4.5. Patent/Trademark Analysis
- 5. Global Telecommunications Market in South Africa Analysis, Insights and Forecast, 2019-2031
- 5.1. Market Analysis, Insights and Forecast - by Segmenta
- 5.1.1. Voice Services
- 5.1.1.1. Wired
- 5.1.1.2. Wireless
- 5.1.2. Data and
- 5.1.3. OTT and PayTV Services
- 5.1.1. Voice Services
- 5.2. Market Analysis, Insights and Forecast - by Region
- 5.2.1. North America
- 5.2.2. South America
- 5.2.3. Europe
- 5.2.4. Middle East & Africa
- 5.2.5. Asia Pacific
- 5.1. Market Analysis, Insights and Forecast - by Segmenta
- 6. North America Telecommunications Market in South Africa Analysis, Insights and Forecast, 2019-2031
- 6.1. Market Analysis, Insights and Forecast - by Segmenta
- 6.1.1. Voice Services
- 6.1.1.1. Wired
- 6.1.1.2. Wireless
- 6.1.2. Data and
- 6.1.3. OTT and PayTV Services
- 6.1.1. Voice Services
- 6.1. Market Analysis, Insights and Forecast - by Segmenta
- 7. South America Telecommunications Market in South Africa Analysis, Insights and Forecast, 2019-2031
- 7.1. Market Analysis, Insights and Forecast - by Segmenta
- 7.1.1. Voice Services
- 7.1.1.1. Wired
- 7.1.1.2. Wireless
- 7.1.2. Data and
- 7.1.3. OTT and PayTV Services
- 7.1.1. Voice Services
- 7.1. Market Analysis, Insights and Forecast - by Segmenta
- 8. Europe Telecommunications Market in South Africa Analysis, Insights and Forecast, 2019-2031
- 8.1. Market Analysis, Insights and Forecast - by Segmenta
- 8.1.1. Voice Services
- 8.1.1.1. Wired
- 8.1.1.2. Wireless
- 8.1.2. Data and
- 8.1.3. OTT and PayTV Services
- 8.1.1. Voice Services
- 8.1. Market Analysis, Insights and Forecast - by Segmenta
- 9. Middle East & Africa Telecommunications Market in South Africa Analysis, Insights and Forecast, 2019-2031
- 9.1. Market Analysis, Insights and Forecast - by Segmenta
- 9.1.1. Voice Services
- 9.1.1.1. Wired
- 9.1.1.2. Wireless
- 9.1.2. Data and
- 9.1.3. OTT and PayTV Services
- 9.1.1. Voice Services
- 9.1. Market Analysis, Insights and Forecast - by Segmenta
- 10. Asia Pacific Telecommunications Market in South Africa Analysis, Insights and Forecast, 2019-2031
- 10.1. Market Analysis, Insights and Forecast - by Segmenta
- 10.1.1. Voice Services
- 10.1.1.1. Wired
- 10.1.1.2. Wireless
- 10.1.2. Data and
- 10.1.3. OTT and PayTV Services
- 10.1.1. Voice Services
- 10.1. Market Analysis, Insights and Forecast - by Segmenta
- 11. South Africa Telecommunications Market in South Africa Analysis, Insights and Forecast, 2019-2031
- 12. Sudan Telecommunications Market in South Africa Analysis, Insights and Forecast, 2019-2031
- 13. Uganda Telecommunications Market in South Africa Analysis, Insights and Forecast, 2019-2031
- 14. Tanzania Telecommunications Market in South Africa Analysis, Insights and Forecast, 2019-2031
- 15. Kenya Telecommunications Market in South Africa Analysis, Insights and Forecast, 2019-2031
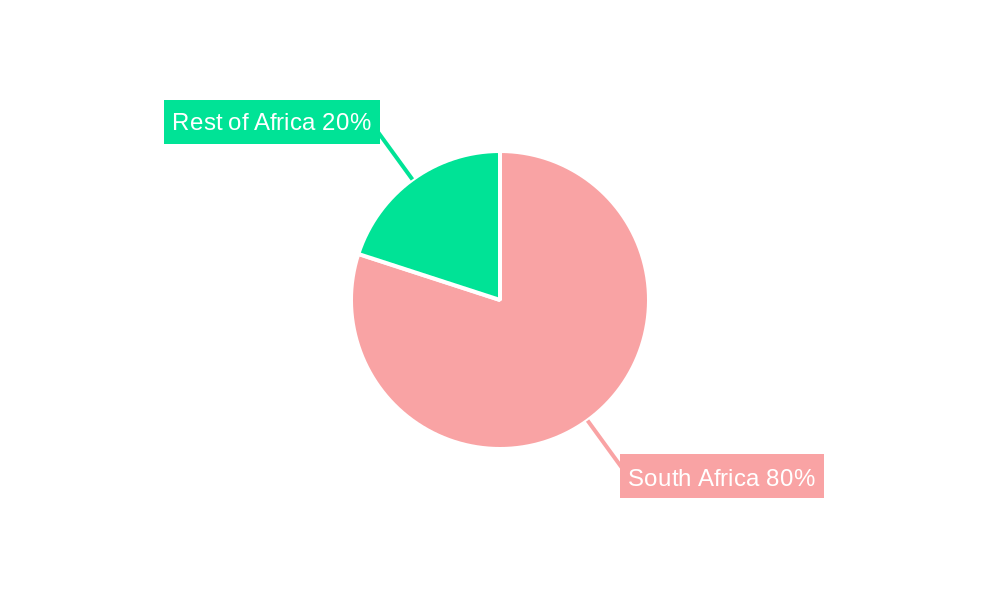
- 16. Rest of Africa Telecommunications Market in South Africa Analysis, Insights and Forecast, 2019-2031
- 17. Competitive Analysis
- 17.1. Global Market Share Analysis 2024
- 17.2. Company Profiles
- 17.2.1 Huge Telecom
- 17.2.1.1. Overview
- 17.2.1.2. Products
- 17.2.1.3. SWOT Analysis
- 17.2.1.4. Recent Developments
- 17.2.1.5. Financials (Based on Availability)
- 17.2.2 HD Telecoms
- 17.2.2.1. Overview
- 17.2.2.2. Products
- 17.2.2.3. SWOT Analysis
- 17.2.2.4. Recent Developments
- 17.2.2.5. Financials (Based on Availability)
- 17.2.3 Liquid Intelligent Technologies*List Not Exhaustive
- 17.2.3.1. Overview
- 17.2.3.2. Products
- 17.2.3.3. SWOT Analysis
- 17.2.3.4. Recent Developments
- 17.2.3.5. Financials (Based on Availability)
- 17.2.4 ATC South Africa
- 17.2.4.1. Overview
- 17.2.4.2. Products
- 17.2.4.3. SWOT Analysis
- 17.2.4.4. Recent Developments
- 17.2.4.5. Financials (Based on Availability)
- 17.2.5 Voys Telecom
- 17.2.5.1. Overview
- 17.2.5.2. Products
- 17.2.5.3. SWOT Analysis
- 17.2.5.4. Recent Developments
- 17.2.5.5. Financials (Based on Availability)
- 17.2.6 Cell C Limited
- 17.2.6.1. Overview
- 17.2.6.2. Products
- 17.2.6.3. SWOT Analysis
- 17.2.6.4. Recent Developments
- 17.2.6.5. Financials (Based on Availability)
- 17.2.7 MTN South Africa
- 17.2.7.1. Overview
- 17.2.7.2. Products
- 17.2.7.3. SWOT Analysis
- 17.2.7.4. Recent Developments
- 17.2.7.5. Financials (Based on Availability)
- 17.2.8 Telkom SA SOC Limited
- 17.2.8.1. Overview
- 17.2.8.2. Products
- 17.2.8.3. SWOT Analysis
- 17.2.8.4. Recent Developments
- 17.2.8.5. Financials (Based on Availability)
- 17.2.9 Saicom South Africa
- 17.2.9.1. Overview
- 17.2.9.2. Products
- 17.2.9.3. SWOT Analysis
- 17.2.9.4. Recent Developments
- 17.2.9.5. Financials (Based on Availability)
- 17.2.10 Vodacom South Africa
- 17.2.10.1. Overview
- 17.2.10.2. Products
- 17.2.10.3. SWOT Analysis
- 17.2.10.4. Recent Developments
- 17.2.10.5. Financials (Based on Availability)
- 17.2.1 Huge Telecom
List of Figures
- Figure 1: Global Telecommunications Market in South Africa Revenue Breakdown (Million, %) by Region 2024 & 2032
- Figure 2: Africa Telecommunications Market in South Africa Revenue (Million), by Country 2024 & 2032
- Figure 3: Africa Telecommunications Market in South Africa Revenue Share (%), by Country 2024 & 2032
- Figure 4: North America Telecommunications Market in South Africa Revenue (Million), by Segmenta 2024 & 2032
- Figure 5: North America Telecommunications Market in South Africa Revenue Share (%), by Segmenta 2024 & 2032
- Figure 6: North America Telecommunications Market in South Africa Revenue (Million), by Country 2024 & 2032
- Figure 7: North America Telecommunications Market in South Africa Revenue Share (%), by Country 2024 & 2032
- Figure 8: South America Telecommunications Market in South Africa Revenue (Million), by Segmenta 2024 & 2032
- Figure 9: South America Telecommunications Market in South Africa Revenue Share (%), by Segmenta 2024 & 2032
- Figure 10: South America Telecommunications Market in South Africa Revenue (Million), by Country 2024 & 2032
- Figure 11: South America Telecommunications Market in South Africa Revenue Share (%), by Country 2024 & 2032
- Figure 12: Europe Telecommunications Market in South Africa Revenue (Million), by Segmenta 2024 & 2032
- Figure 13: Europe Telecommunications Market in South Africa Revenue Share (%), by Segmenta 2024 & 2032
- Figure 14: Europe Telecommunications Market in South Africa Revenue (Million), by Country 2024 & 2032
- Figure 15: Europe Telecommunications Market in South Africa Revenue Share (%), by Country 2024 & 2032
- Figure 16: Middle East & Africa Telecommunications Market in South Africa Revenue (Million), by Segmenta 2024 & 2032
- Figure 17: Middle East & Africa Telecommunications Market in South Africa Revenue Share (%), by Segmenta 2024 & 2032
- Figure 18: Middle East & Africa Telecommunications Market in South Africa Revenue (Million), by Country 2024 & 2032
- Figure 19: Middle East & Africa Telecommunications Market in South Africa Revenue Share (%), by Country 2024 & 2032
- Figure 20: Asia Pacific Telecommunications Market in South Africa Revenue (Million), by Segmenta 2024 & 2032
- Figure 21: Asia Pacific Telecommunications Market in South Africa Revenue Share (%), by Segmenta 2024 & 2032
- Figure 22: Asia Pacific Telecommunications Market in South Africa Revenue (Million), by Country 2024 & 2032
- Figure 23: Asia Pacific Telecommunications Market in South Africa Revenue Share (%), by Country 2024 & 2032
List of Tables
- Table 1: Global Telecommunications Market in South Africa Revenue Million Forecast, by Region 2019 & 2032
- Table 2: Global Telecommunications Market in South Africa Revenue Million Forecast, by Segmenta 2019 & 2032
- Table 3: Global Telecommunications Market in South Africa Revenue Million Forecast, by Region 2019 & 2032
- Table 4: Global Telecommunications Market in South Africa Revenue Million Forecast, by Country 2019 & 2032
- Table 5: South Africa Telecommunications Market in South Africa Revenue (Million) Forecast, by Application 2019 & 2032
- Table 6: Sudan Telecommunications Market in South Africa Revenue (Million) Forecast, by Application 2019 & 2032
- Table 7: Uganda Telecommunications Market in South Africa Revenue (Million) Forecast, by Application 2019 & 2032
- Table 8: Tanzania Telecommunications Market in South Africa Revenue (Million) Forecast, by Application 2019 & 2032
- Table 9: Kenya Telecommunications Market in South Africa Revenue (Million) Forecast, by Application 2019 & 2032
- Table 10: Rest of Africa Telecommunications Market in South Africa Revenue (Million) Forecast, by Application 2019 & 2032
- Table 11: Global Telecommunications Market in South Africa Revenue Million Forecast, by Segmenta 2019 & 2032
- Table 12: Global Telecommunications Market in South Africa Revenue Million Forecast, by Country 2019 & 2032
- Table 13: United States Telecommunications Market in South Africa Revenue (Million) Forecast, by Application 2019 & 2032
- Table 14: Canada Telecommunications Market in South Africa Revenue (Million) Forecast, by Application 2019 & 2032
- Table 15: Mexico Telecommunications Market in South Africa Revenue (Million) Forecast, by Application 2019 & 2032
- Table 16: Global Telecommunications Market in South Africa Revenue Million Forecast, by Segmenta 2019 & 2032
- Table 17: Global Telecommunications Market in South Africa Revenue Million Forecast, by Country 2019 & 2032
- Table 18: Brazil Telecommunications Market in South Africa Revenue (Million) Forecast, by Application 2019 & 2032
- Table 19: Argentina Telecommunications Market in South Africa Revenue (Million) Forecast, by Application 2019 & 2032
- Table 20: Rest of South America Telecommunications Market in South Africa Revenue (Million) Forecast, by Application 2019 & 2032
- Table 21: Global Telecommunications Market in South Africa Revenue Million Forecast, by Segmenta 2019 & 2032
- Table 22: Global Telecommunications Market in South Africa Revenue Million Forecast, by Country 2019 & 2032
- Table 23: United Kingdom Telecommunications Market in South Africa Revenue (Million) Forecast, by Application 2019 & 2032
- Table 24: Germany Telecommunications Market in South Africa Revenue (Million) Forecast, by Application 2019 & 2032
- Table 25: France Telecommunications Market in South Africa Revenue (Million) Forecast, by Application 2019 & 2032
- Table 26: Italy Telecommunications Market in South Africa Revenue (Million) Forecast, by Application 2019 & 2032
- Table 27: Spain Telecommunications Market in South Africa Revenue (Million) Forecast, by Application 2019 & 2032
- Table 28: Russia Telecommunications Market in South Africa Revenue (Million) Forecast, by Application 2019 & 2032
- Table 29: Benelux Telecommunications Market in South Africa Revenue (Million) Forecast, by Application 2019 & 2032
- Table 30: Nordics Telecommunications Market in South Africa Revenue (Million) Forecast, by Application 2019 & 2032
- Table 31: Rest of Europe Telecommunications Market in South Africa Revenue (Million) Forecast, by Application 2019 & 2032
- Table 32: Global Telecommunications Market in South Africa Revenue Million Forecast, by Segmenta 2019 & 2032
- Table 33: Global Telecommunications Market in South Africa Revenue Million Forecast, by Country 2019 & 2032
- Table 34: Turkey Telecommunications Market in South Africa Revenue (Million) Forecast, by Application 2019 & 2032
- Table 35: Israel Telecommunications Market in South Africa Revenue (Million) Forecast, by Application 2019 & 2032
- Table 36: GCC Telecommunications Market in South Africa Revenue (Million) Forecast, by Application 2019 & 2032
- Table 37: North Africa Telecommunications Market in South Africa Revenue (Million) Forecast, by Application 2019 & 2032
- Table 38: South Africa Telecommunications Market in South Africa Revenue (Million) Forecast, by Application 2019 & 2032
- Table 39: Rest of Middle East & Africa Telecommunications Market in South Africa Revenue (Million) Forecast, by Application 2019 & 2032
- Table 40: Global Telecommunications Market in South Africa Revenue Million Forecast, by Segmenta 2019 & 2032
- Table 41: Global Telecommunications Market in South Africa Revenue Million Forecast, by Country 2019 & 2032
- Table 42: China Telecommunications Market in South Africa Revenue (Million) Forecast, by Application 2019 & 2032
- Table 43: India Telecommunications Market in South Africa Revenue (Million) Forecast, by Application 2019 & 2032
- Table 44: Japan Telecommunications Market in South Africa Revenue (Million) Forecast, by Application 2019 & 2032
- Table 45: South Korea Telecommunications Market in South Africa Revenue (Million) Forecast, by Application 2019 & 2032
- Table 46: ASEAN Telecommunications Market in South Africa Revenue (Million) Forecast, by Application 2019 & 2032
- Table 47: Oceania Telecommunications Market in South Africa Revenue (Million) Forecast, by Application 2019 & 2032
- Table 48: Rest of Asia Pacific Telecommunications Market in South Africa Revenue (Million) Forecast, by Application 2019 & 2032
Frequently Asked Questions
1. What is the projected Compound Annual Growth Rate (CAGR) of the Telecommunications Market in South Africa?
The projected CAGR is approximately 5.32%.
2. Which companies are prominent players in the Telecommunications Market in South Africa?
Key companies in the market include Huge Telecom, HD Telecoms, Liquid Intelligent Technologies*List Not Exhaustive, ATC South Africa, Voys Telecom, Cell C Limited, MTN South Africa, Telkom SA SOC Limited, Saicom South Africa, Vodacom South Africa.
3. What are the main segments of the Telecommunications Market in South Africa?
The market segments include Segmenta.
4. Can you provide details about the market size?
The market size is estimated to be USD XX Million as of 2022.
5. What are some drivers contributing to market growth?
Demand of Mobile Phones; Active 5G Roll Out.
6. What are the notable trends driving market growth?
Roll Out of 5G.
7. Are there any restraints impacting market growth?
Combining Data from Multiple Data Sources.
8. Can you provide examples of recent developments in the market?
In October 2022, Vodacom South Africa unveiled the extension of the SD-WAN solution in the country. After successfully deploying its SD-WAN solution to several companies in South Africa, Vodacom Business Africa is now making the service available to customers in all 47 operational nations across its African territory.
9. What pricing options are available for accessing the report?
Pricing options include single-user, multi-user, and enterprise licenses priced at USD 3800, USD 4500, and USD 5800 respectively.
10. Is the market size provided in terms of value or volume?
The market size is provided in terms of value, measured in Million.
11. Are there any specific market keywords associated with the report?
Yes, the market keyword associated with the report is "Telecommunications Market in South Africa," which aids in identifying and referencing the specific market segment covered.
12. How do I determine which pricing option suits my needs best?
The pricing options vary based on user requirements and access needs. Individual users may opt for single-user licenses, while businesses requiring broader access may choose multi-user or enterprise licenses for cost-effective access to the report.
13. Are there any additional resources or data provided in the Telecommunications Market in South Africa report?
While the report offers comprehensive insights, it's advisable to review the specific contents or supplementary materials provided to ascertain if additional resources or data are available.
14. How can I stay updated on further developments or reports in the Telecommunications Market in South Africa?
To stay informed about further developments, trends, and reports in the Telecommunications Market in South Africa, consider subscribing to industry newsletters, following relevant companies and organizations, or regularly checking reputable industry news sources and publications.
Methodology
Step 1 - Identification of Relevant Samples Size from Population Database


Step 2 - Approaches for Defining Global Market Size (Value, Volume* & Price*)

Note*: In applicable scenarios
Step 3 - Data Sources
Primary Research
- Web Analytics
- Survey Reports
- Research Institute
- Latest Research Reports
- Opinion Leaders
Secondary Research
- Annual Reports
- White Paper
- Latest Press Release
- Industry Association
- Paid Database
- Investor Presentations

Step 4 - Data Triangulation
Involves using different sources of information in order to increase the validity of a study
These sources are likely to be stakeholders in a program - participants, other researchers, program staff, other community members, and so on.
Then we put all data in single framework & apply various statistical tools to find out the dynamic on the market.
During the analysis stage, feedback from the stakeholder groups would be compared to determine areas of agreement as well as areas of divergence


