
Key Insights
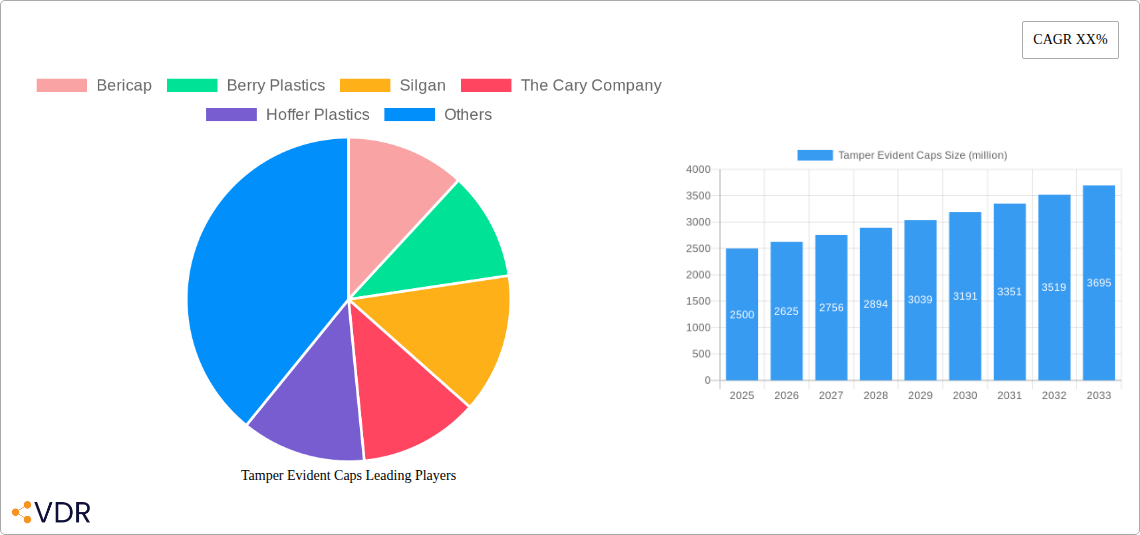
The tamper-evident caps market is experiencing robust growth, driven by increasing consumer demand for product authenticity and safety across various industries. The market, estimated at $2.5 billion in 2025, is projected to witness a Compound Annual Growth Rate (CAGR) of 5% from 2025 to 2033, reaching an estimated value of $3.8 billion by 2033. This growth is fueled by several key factors, including the rising prevalence of counterfeit products, stringent government regulations regarding product safety and traceability, and the expanding adoption of tamper-evident packaging across diverse sectors such as pharmaceuticals, food and beverages, and cosmetics. Furthermore, technological advancements leading to the development of innovative tamper-evident cap designs, including those incorporating advanced security features like RFID tags and unique serial numbers, are also contributing to market expansion.
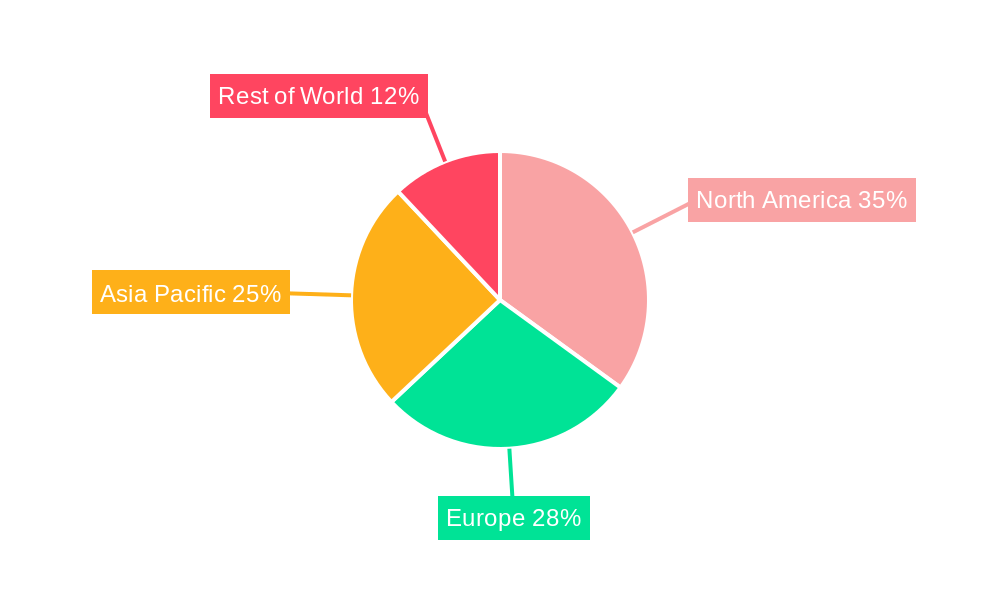
Major players like Bericap, Berry Plastics, and Silgan are actively shaping the market through strategic partnerships, acquisitions, and product innovation. However, challenges such as fluctuating raw material prices and increasing competition from regional players could pose restraints to the market's growth trajectory. Market segmentation by material type (plastic, metal, etc.), application (pharmaceutical, food and beverage, etc.), and region (North America, Europe, Asia Pacific, etc.) reveals varied growth potential. North America currently holds a significant market share, primarily driven by stringent regulatory requirements and high consumer awareness regarding product authenticity. However, the Asia-Pacific region is expected to demonstrate considerable growth in the coming years, fueled by rapid economic development and rising disposable incomes. The future of the tamper-evident caps market looks promising, with continuous innovation and a growing emphasis on product security and consumer trust expected to propel its growth in the long term.
Tamper Evident Caps Market Report: 2019-2033
This comprehensive report provides a detailed analysis of the global Tamper Evident Caps market, encompassing historical data (2019-2024), current estimates (2025), and future projections (2025-2033). The study delves into market dynamics, growth trends, regional segmentation, product landscape, key players, and emerging opportunities within the parent market of Packaging and the child market of Pharmaceutical Packaging. This report is crucial for industry professionals, investors, and stakeholders seeking a comprehensive understanding of this vital sector. The market size is expected to reach xx million units by 2033.
Tamper Evident Caps Market Dynamics & Structure
The Tamper Evident Caps market is characterized by moderate concentration, with key players like Bericap, Berry Plastics, and Silgan holding significant market shares. Technological innovation, driven by increasing demand for secure and reliable packaging solutions across various industries, is a major growth driver. Stringent regulatory frameworks, particularly in the pharmaceutical and food sectors, mandate the use of tamper-evident caps, fueling market expansion. Competitive substitutes, such as alternative sealing mechanisms, pose a challenge, but the inherent security features of tamper-evident caps maintain their dominant position. End-user demographics are diverse, spanning pharmaceutical, food & beverage, personal care, and industrial chemical sectors. M&A activity in the packaging industry is relatively frequent, with an estimated xx deals per year in the historical period.
- Market Concentration: Moderately concentrated, with top 5 players holding approximately xx% market share in 2025.
- Technological Innovation: Focus on improved sealing mechanisms, material advancements (e.g., sustainable plastics), and smart packaging integration.
- Regulatory Landscape: Stringent regulations in pharmaceutical and food sectors drive demand.
- Competitive Substitutes: Alternative sealing technologies, but tamper-evident caps maintain market dominance due to security features.
- M&A Activity: xx deals annually (2019-2024), driven by consolidation and expansion strategies.
Tamper Evident Caps Growth Trends & Insights
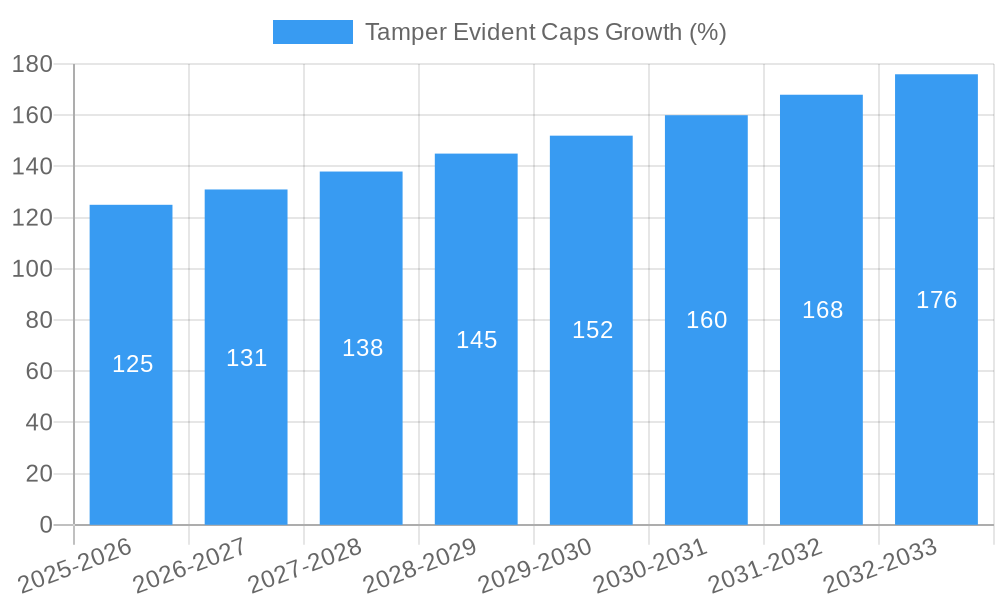
The global Tamper Evident Caps market exhibited steady growth during the historical period (2019-2024), driven by increasing consumer awareness of product authenticity and safety. The market is projected to experience a CAGR of xx% during the forecast period (2025-2033), reaching xx million units by 2033. This growth is fueled by rising demand across various end-use sectors, particularly pharmaceutical and food & beverage. Technological advancements, such as the integration of smart packaging technologies and sustainable material options, are further accelerating market adoption. Consumer behavior shifts towards premium and tamper-resistant products are also contributing to the growth trajectory. Market penetration in developing economies is expected to increase significantly, while mature markets witness steady growth driven by product innovation and premiumization.
Dominant Regions, Countries, or Segments in Tamper Evident Caps
North America currently holds the largest market share in the Tamper Evident Caps market, followed by Europe and Asia-Pacific. The dominance of North America stems from robust pharmaceutical and food & beverage industries, high consumer awareness, and stringent regulatory frameworks. Europe's mature market also contributes significantly to global demand. The Asia-Pacific region demonstrates high growth potential driven by expanding manufacturing industries and a rising middle class with increasing disposable income.
- Key Drivers in North America: Strong regulatory environment, large pharmaceutical and food & beverage sectors, high consumer awareness.
- Key Drivers in Europe: Mature market, established infrastructure, robust consumer demand.
- Key Drivers in Asia-Pacific: Rapid industrialization, expanding middle class, rising consumer spending.
Tamper Evident Caps Product Landscape
The Tamper Evident Caps market offers a wide range of products catering to diverse industry needs. Innovations include improved sealing mechanisms for enhanced security, the use of eco-friendly materials like bioplastics, and the integration of smart features for product traceability and authentication. These advancements enhance product safety, improve supply chain efficiency, and provide consumers with greater confidence in product authenticity. Unique selling propositions focus on security features, ease of use, and sustainability.
Key Drivers, Barriers & Challenges in Tamper Evident Caps
Key Drivers: Rising consumer demand for secure packaging, stringent government regulations, growth in the pharmaceutical and food & beverage industries, and technological advancements in sealing mechanisms and materials.
Challenges & Restraints: Fluctuations in raw material prices, intense competition from alternative sealing technologies, potential supply chain disruptions, and the need for continuous innovation to meet evolving consumer and regulatory demands. The impact of these challenges is estimated to reduce the overall market growth by xx% during the forecast period.
Emerging Opportunities in Tamper Evident Caps
Emerging opportunities lie in the adoption of sustainable materials, integration of smart packaging technologies, expansion into untapped markets in developing economies, and catering to niche applications like medical devices and high-value consumer goods. The focus on eco-friendly solutions and enhanced product security presents significant growth avenues.
Growth Accelerators in the Tamper Evident Caps Industry
Strategic partnerships, technological breakthroughs in material science and sealing mechanisms, and expansion into new geographical markets with strong regulatory frameworks are major catalysts for long-term growth. Further innovation in smart packaging, incorporating traceability and anti-counterfeiting measures, will further propel market expansion.
Key Players Shaping the Tamper Evident Caps Market
- Bericap
- Berry Plastics
- Silgan
- The Cary Company
- Hoffer Plastics
- Marijuana Packaging
- Aptar
- Oriental Containers
- Blackhawk Molding
- ALWSCI
- Crown Equipment Corporation
- Gil Plastic Products
- Sailor Plastic Bottles
- Heinlein Plastik-Technik
- H&K Müller
Notable Milestones in Tamper Evident Caps Sector
- 2021 Q3: Bericap launched a new line of sustainable tamper-evident caps made from recycled materials.
- 2022 Q1: Silgan acquired a smaller competitor, expanding its market share.
- 2023 Q2: Berry Plastics introduced a tamper-evident cap with integrated RFID technology for enhanced product traceability. (Further milestones can be added here as needed)
In-Depth Tamper Evident Caps Market Outlook
The Tamper Evident Caps market is poised for continued growth, driven by ongoing technological innovations, increasing consumer demand for secure packaging, and expanding regulatory requirements. Strategic partnerships, investments in research and development, and expansion into high-growth markets present significant opportunities for market players. The focus on sustainable and smart packaging solutions will shape future market dynamics, promising a robust and evolving landscape in the coming years.
Tamper Evident Caps Segmentation
-
1. Application
- 1.1. Drink Bottle
- 1.2. Medicine Bottle
- 1.3. Industrial Chemicals
- 1.4. Others
-
2. Types
- 2.1. PP Caps
- 2.2. PE Caps
- 2.3. Other Materials
Tamper Evident Caps Segmentation By Geography
-
1. North America
- 1.1. United States
- 1.2. Canada
- 1.3. Mexico
-
2. South America
- 2.1. Brazil
- 2.2. Argentina
- 2.3. Rest of South America
-
3. Europe
- 3.1. United Kingdom
- 3.2. Germany
- 3.3. France
- 3.4. Italy
- 3.5. Spain
- 3.6. Russia
- 3.7. Benelux
- 3.8. Nordics
- 3.9. Rest of Europe
-
4. Middle East & Africa
- 4.1. Turkey
- 4.2. Israel
- 4.3. GCC
- 4.4. North Africa
- 4.5. South Africa
- 4.6. Rest of Middle East & Africa
-
5. Asia Pacific
- 5.1. China
- 5.2. India
- 5.3. Japan
- 5.4. South Korea
- 5.5. ASEAN
- 5.6. Oceania
- 5.7. Rest of Asia Pacific
Tamper Evident Caps REPORT HIGHLIGHTS
| Aspects | Details |
|---|---|
| Study Period | 2019-2033 |
| Base Year | 2024 |
| Estimated Year | 2025 |
| Forecast Period | 2025-2033 |
| Historical Period | 2019-2024 |
| Growth Rate | CAGR of XX% from 2019-2033 |
| Segmentation |
|
Table of Contents
- 1. Introduction
- 1.1. Research Scope
- 1.2. Market Segmentation
- 1.3. Research Methodology
- 1.4. Definitions and Assumptions
- 2. Executive Summary
- 2.1. Introduction
- 3. Market Dynamics
- 3.1. Introduction
- 3.2. Market Drivers
- 3.3. Market Restrains
- 3.4. Market Trends
- 4. Market Factor Analysis
- 4.1. Porters Five Forces
- 4.2. Supply/Value Chain
- 4.3. PESTEL analysis
- 4.4. Market Entropy
- 4.5. Patent/Trademark Analysis
- 5. Global Tamper Evident Caps Analysis, Insights and Forecast, 2019-2031
- 5.1. Market Analysis, Insights and Forecast - by Application
- 5.1.1. Drink Bottle
- 5.1.2. Medicine Bottle
- 5.1.3. Industrial Chemicals
- 5.1.4. Others
- 5.2. Market Analysis, Insights and Forecast - by Types
- 5.2.1. PP Caps
- 5.2.2. PE Caps
- 5.2.3. Other Materials
- 5.3. Market Analysis, Insights and Forecast - by Region
- 5.3.1. North America
- 5.3.2. South America
- 5.3.3. Europe
- 5.3.4. Middle East & Africa
- 5.3.5. Asia Pacific
- 5.1. Market Analysis, Insights and Forecast - by Application
- 6. North America Tamper Evident Caps Analysis, Insights and Forecast, 2019-2031
- 6.1. Market Analysis, Insights and Forecast - by Application
- 6.1.1. Drink Bottle
- 6.1.2. Medicine Bottle
- 6.1.3. Industrial Chemicals
- 6.1.4. Others
- 6.2. Market Analysis, Insights and Forecast - by Types
- 6.2.1. PP Caps
- 6.2.2. PE Caps
- 6.2.3. Other Materials
- 6.1. Market Analysis, Insights and Forecast - by Application
- 7. South America Tamper Evident Caps Analysis, Insights and Forecast, 2019-2031
- 7.1. Market Analysis, Insights and Forecast - by Application
- 7.1.1. Drink Bottle
- 7.1.2. Medicine Bottle
- 7.1.3. Industrial Chemicals
- 7.1.4. Others
- 7.2. Market Analysis, Insights and Forecast - by Types
- 7.2.1. PP Caps
- 7.2.2. PE Caps
- 7.2.3. Other Materials
- 7.1. Market Analysis, Insights and Forecast - by Application
- 8. Europe Tamper Evident Caps Analysis, Insights and Forecast, 2019-2031
- 8.1. Market Analysis, Insights and Forecast - by Application
- 8.1.1. Drink Bottle
- 8.1.2. Medicine Bottle
- 8.1.3. Industrial Chemicals
- 8.1.4. Others
- 8.2. Market Analysis, Insights and Forecast - by Types
- 8.2.1. PP Caps
- 8.2.2. PE Caps
- 8.2.3. Other Materials
- 8.1. Market Analysis, Insights and Forecast - by Application
- 9. Middle East & Africa Tamper Evident Caps Analysis, Insights and Forecast, 2019-2031
- 9.1. Market Analysis, Insights and Forecast - by Application
- 9.1.1. Drink Bottle
- 9.1.2. Medicine Bottle
- 9.1.3. Industrial Chemicals
- 9.1.4. Others
- 9.2. Market Analysis, Insights and Forecast - by Types
- 9.2.1. PP Caps
- 9.2.2. PE Caps
- 9.2.3. Other Materials
- 9.1. Market Analysis, Insights and Forecast - by Application
- 10. Asia Pacific Tamper Evident Caps Analysis, Insights and Forecast, 2019-2031
- 10.1. Market Analysis, Insights and Forecast - by Application
- 10.1.1. Drink Bottle
- 10.1.2. Medicine Bottle
- 10.1.3. Industrial Chemicals
- 10.1.4. Others
- 10.2. Market Analysis, Insights and Forecast - by Types
- 10.2.1. PP Caps
- 10.2.2. PE Caps
- 10.2.3. Other Materials
- 10.1. Market Analysis, Insights and Forecast - by Application
- 11. Competitive Analysis
- 11.1. Global Market Share Analysis 2024
- 11.2. Company Profiles
- 11.2.1 Bericap
- 11.2.1.1. Overview
- 11.2.1.2. Products
- 11.2.1.3. SWOT Analysis
- 11.2.1.4. Recent Developments
- 11.2.1.5. Financials (Based on Availability)
- 11.2.2 Berry Plastics
- 11.2.2.1. Overview
- 11.2.2.2. Products
- 11.2.2.3. SWOT Analysis
- 11.2.2.4. Recent Developments
- 11.2.2.5. Financials (Based on Availability)
- 11.2.3 Silgan
- 11.2.3.1. Overview
- 11.2.3.2. Products
- 11.2.3.3. SWOT Analysis
- 11.2.3.4. Recent Developments
- 11.2.3.5. Financials (Based on Availability)
- 11.2.4 The Cary Company
- 11.2.4.1. Overview
- 11.2.4.2. Products
- 11.2.4.3. SWOT Analysis
- 11.2.4.4. Recent Developments
- 11.2.4.5. Financials (Based on Availability)
- 11.2.5 Hoffer Plastics
- 11.2.5.1. Overview
- 11.2.5.2. Products
- 11.2.5.3. SWOT Analysis
- 11.2.5.4. Recent Developments
- 11.2.5.5. Financials (Based on Availability)
- 11.2.6 Marijuana Packaging
- 11.2.6.1. Overview
- 11.2.6.2. Products
- 11.2.6.3. SWOT Analysis
- 11.2.6.4. Recent Developments
- 11.2.6.5. Financials (Based on Availability)
- 11.2.7 Aptar
- 11.2.7.1. Overview
- 11.2.7.2. Products
- 11.2.7.3. SWOT Analysis
- 11.2.7.4. Recent Developments
- 11.2.7.5. Financials (Based on Availability)
- 11.2.8 Oriental Containers
- 11.2.8.1. Overview
- 11.2.8.2. Products
- 11.2.8.3. SWOT Analysis
- 11.2.8.4. Recent Developments
- 11.2.8.5. Financials (Based on Availability)
- 11.2.9 Blackhawk Molding
- 11.2.9.1. Overview
- 11.2.9.2. Products
- 11.2.9.3. SWOT Analysis
- 11.2.9.4. Recent Developments
- 11.2.9.5. Financials (Based on Availability)
- 11.2.10 ALWSCI
- 11.2.10.1. Overview
- 11.2.10.2. Products
- 11.2.10.3. SWOT Analysis
- 11.2.10.4. Recent Developments
- 11.2.10.5. Financials (Based on Availability)
- 11.2.11 Crown Equipment Corporation
- 11.2.11.1. Overview
- 11.2.11.2. Products
- 11.2.11.3. SWOT Analysis
- 11.2.11.4. Recent Developments
- 11.2.11.5. Financials (Based on Availability)
- 11.2.12 Gil Plastic Products
- 11.2.12.1. Overview
- 11.2.12.2. Products
- 11.2.12.3. SWOT Analysis
- 11.2.12.4. Recent Developments
- 11.2.12.5. Financials (Based on Availability)
- 11.2.13 Sailor Plastic Bottles
- 11.2.13.1. Overview
- 11.2.13.2. Products
- 11.2.13.3. SWOT Analysis
- 11.2.13.4. Recent Developments
- 11.2.13.5. Financials (Based on Availability)
- 11.2.14 Heinlein Plastik-Technik
- 11.2.14.1. Overview
- 11.2.14.2. Products
- 11.2.14.3. SWOT Analysis
- 11.2.14.4. Recent Developments
- 11.2.14.5. Financials (Based on Availability)
- 11.2.15 H&K Müller
- 11.2.15.1. Overview
- 11.2.15.2. Products
- 11.2.15.3. SWOT Analysis
- 11.2.15.4. Recent Developments
- 11.2.15.5. Financials (Based on Availability)
- 11.2.1 Bericap
List of Figures
- Figure 1: Global Tamper Evident Caps Revenue Breakdown (million, %) by Region 2024 & 2032
- Figure 2: North America Tamper Evident Caps Revenue (million), by Application 2024 & 2032
- Figure 3: North America Tamper Evident Caps Revenue Share (%), by Application 2024 & 2032
- Figure 4: North America Tamper Evident Caps Revenue (million), by Types 2024 & 2032
- Figure 5: North America Tamper Evident Caps Revenue Share (%), by Types 2024 & 2032
- Figure 6: North America Tamper Evident Caps Revenue (million), by Country 2024 & 2032
- Figure 7: North America Tamper Evident Caps Revenue Share (%), by Country 2024 & 2032
- Figure 8: South America Tamper Evident Caps Revenue (million), by Application 2024 & 2032
- Figure 9: South America Tamper Evident Caps Revenue Share (%), by Application 2024 & 2032
- Figure 10: South America Tamper Evident Caps Revenue (million), by Types 2024 & 2032
- Figure 11: South America Tamper Evident Caps Revenue Share (%), by Types 2024 & 2032
- Figure 12: South America Tamper Evident Caps Revenue (million), by Country 2024 & 2032
- Figure 13: South America Tamper Evident Caps Revenue Share (%), by Country 2024 & 2032
- Figure 14: Europe Tamper Evident Caps Revenue (million), by Application 2024 & 2032
- Figure 15: Europe Tamper Evident Caps Revenue Share (%), by Application 2024 & 2032
- Figure 16: Europe Tamper Evident Caps Revenue (million), by Types 2024 & 2032
- Figure 17: Europe Tamper Evident Caps Revenue Share (%), by Types 2024 & 2032
- Figure 18: Europe Tamper Evident Caps Revenue (million), by Country 2024 & 2032
- Figure 19: Europe Tamper Evident Caps Revenue Share (%), by Country 2024 & 2032
- Figure 20: Middle East & Africa Tamper Evident Caps Revenue (million), by Application 2024 & 2032
- Figure 21: Middle East & Africa Tamper Evident Caps Revenue Share (%), by Application 2024 & 2032
- Figure 22: Middle East & Africa Tamper Evident Caps Revenue (million), by Types 2024 & 2032
- Figure 23: Middle East & Africa Tamper Evident Caps Revenue Share (%), by Types 2024 & 2032
- Figure 24: Middle East & Africa Tamper Evident Caps Revenue (million), by Country 2024 & 2032
- Figure 25: Middle East & Africa Tamper Evident Caps Revenue Share (%), by Country 2024 & 2032
- Figure 26: Asia Pacific Tamper Evident Caps Revenue (million), by Application 2024 & 2032
- Figure 27: Asia Pacific Tamper Evident Caps Revenue Share (%), by Application 2024 & 2032
- Figure 28: Asia Pacific Tamper Evident Caps Revenue (million), by Types 2024 & 2032
- Figure 29: Asia Pacific Tamper Evident Caps Revenue Share (%), by Types 2024 & 2032
- Figure 30: Asia Pacific Tamper Evident Caps Revenue (million), by Country 2024 & 2032
- Figure 31: Asia Pacific Tamper Evident Caps Revenue Share (%), by Country 2024 & 2032
List of Tables
- Table 1: Global Tamper Evident Caps Revenue million Forecast, by Region 2019 & 2032
- Table 2: Global Tamper Evident Caps Revenue million Forecast, by Application 2019 & 2032
- Table 3: Global Tamper Evident Caps Revenue million Forecast, by Types 2019 & 2032
- Table 4: Global Tamper Evident Caps Revenue million Forecast, by Region 2019 & 2032
- Table 5: Global Tamper Evident Caps Revenue million Forecast, by Application 2019 & 2032
- Table 6: Global Tamper Evident Caps Revenue million Forecast, by Types 2019 & 2032
- Table 7: Global Tamper Evident Caps Revenue million Forecast, by Country 2019 & 2032
- Table 8: United States Tamper Evident Caps Revenue (million) Forecast, by Application 2019 & 2032
- Table 9: Canada Tamper Evident Caps Revenue (million) Forecast, by Application 2019 & 2032
- Table 10: Mexico Tamper Evident Caps Revenue (million) Forecast, by Application 2019 & 2032
- Table 11: Global Tamper Evident Caps Revenue million Forecast, by Application 2019 & 2032
- Table 12: Global Tamper Evident Caps Revenue million Forecast, by Types 2019 & 2032
- Table 13: Global Tamper Evident Caps Revenue million Forecast, by Country 2019 & 2032
- Table 14: Brazil Tamper Evident Caps Revenue (million) Forecast, by Application 2019 & 2032
- Table 15: Argentina Tamper Evident Caps Revenue (million) Forecast, by Application 2019 & 2032
- Table 16: Rest of South America Tamper Evident Caps Revenue (million) Forecast, by Application 2019 & 2032
- Table 17: Global Tamper Evident Caps Revenue million Forecast, by Application 2019 & 2032
- Table 18: Global Tamper Evident Caps Revenue million Forecast, by Types 2019 & 2032
- Table 19: Global Tamper Evident Caps Revenue million Forecast, by Country 2019 & 2032
- Table 20: United Kingdom Tamper Evident Caps Revenue (million) Forecast, by Application 2019 & 2032
- Table 21: Germany Tamper Evident Caps Revenue (million) Forecast, by Application 2019 & 2032
- Table 22: France Tamper Evident Caps Revenue (million) Forecast, by Application 2019 & 2032
- Table 23: Italy Tamper Evident Caps Revenue (million) Forecast, by Application 2019 & 2032
- Table 24: Spain Tamper Evident Caps Revenue (million) Forecast, by Application 2019 & 2032
- Table 25: Russia Tamper Evident Caps Revenue (million) Forecast, by Application 2019 & 2032
- Table 26: Benelux Tamper Evident Caps Revenue (million) Forecast, by Application 2019 & 2032
- Table 27: Nordics Tamper Evident Caps Revenue (million) Forecast, by Application 2019 & 2032
- Table 28: Rest of Europe Tamper Evident Caps Revenue (million) Forecast, by Application 2019 & 2032
- Table 29: Global Tamper Evident Caps Revenue million Forecast, by Application 2019 & 2032
- Table 30: Global Tamper Evident Caps Revenue million Forecast, by Types 2019 & 2032
- Table 31: Global Tamper Evident Caps Revenue million Forecast, by Country 2019 & 2032
- Table 32: Turkey Tamper Evident Caps Revenue (million) Forecast, by Application 2019 & 2032
- Table 33: Israel Tamper Evident Caps Revenue (million) Forecast, by Application 2019 & 2032
- Table 34: GCC Tamper Evident Caps Revenue (million) Forecast, by Application 2019 & 2032
- Table 35: North Africa Tamper Evident Caps Revenue (million) Forecast, by Application 2019 & 2032
- Table 36: South Africa Tamper Evident Caps Revenue (million) Forecast, by Application 2019 & 2032
- Table 37: Rest of Middle East & Africa Tamper Evident Caps Revenue (million) Forecast, by Application 2019 & 2032
- Table 38: Global Tamper Evident Caps Revenue million Forecast, by Application 2019 & 2032
- Table 39: Global Tamper Evident Caps Revenue million Forecast, by Types 2019 & 2032
- Table 40: Global Tamper Evident Caps Revenue million Forecast, by Country 2019 & 2032
- Table 41: China Tamper Evident Caps Revenue (million) Forecast, by Application 2019 & 2032
- Table 42: India Tamper Evident Caps Revenue (million) Forecast, by Application 2019 & 2032
- Table 43: Japan Tamper Evident Caps Revenue (million) Forecast, by Application 2019 & 2032
- Table 44: South Korea Tamper Evident Caps Revenue (million) Forecast, by Application 2019 & 2032
- Table 45: ASEAN Tamper Evident Caps Revenue (million) Forecast, by Application 2019 & 2032
- Table 46: Oceania Tamper Evident Caps Revenue (million) Forecast, by Application 2019 & 2032
- Table 47: Rest of Asia Pacific Tamper Evident Caps Revenue (million) Forecast, by Application 2019 & 2032
Frequently Asked Questions
1. What is the projected Compound Annual Growth Rate (CAGR) of the Tamper Evident Caps?
The projected CAGR is approximately XX%.
2. Which companies are prominent players in the Tamper Evident Caps?
Key companies in the market include Bericap, Berry Plastics, Silgan, The Cary Company, Hoffer Plastics, Marijuana Packaging, Aptar, Oriental Containers, Blackhawk Molding, ALWSCI, Crown Equipment Corporation, Gil Plastic Products, Sailor Plastic Bottles, Heinlein Plastik-Technik, H&K Müller.
3. What are the main segments of the Tamper Evident Caps?
The market segments include Application, Types.
4. Can you provide details about the market size?
The market size is estimated to be USD XXX million as of 2022.
5. What are some drivers contributing to market growth?
N/A
6. What are the notable trends driving market growth?
N/A
7. Are there any restraints impacting market growth?
N/A
8. Can you provide examples of recent developments in the market?
N/A
9. What pricing options are available for accessing the report?
Pricing options include single-user, multi-user, and enterprise licenses priced at USD 4900.00, USD 7350.00, and USD 9800.00 respectively.
10. Is the market size provided in terms of value or volume?
The market size is provided in terms of value, measured in million.
11. Are there any specific market keywords associated with the report?
Yes, the market keyword associated with the report is "Tamper Evident Caps," which aids in identifying and referencing the specific market segment covered.
12. How do I determine which pricing option suits my needs best?
The pricing options vary based on user requirements and access needs. Individual users may opt for single-user licenses, while businesses requiring broader access may choose multi-user or enterprise licenses for cost-effective access to the report.
13. Are there any additional resources or data provided in the Tamper Evident Caps report?
While the report offers comprehensive insights, it's advisable to review the specific contents or supplementary materials provided to ascertain if additional resources or data are available.
14. How can I stay updated on further developments or reports in the Tamper Evident Caps?
To stay informed about further developments, trends, and reports in the Tamper Evident Caps, consider subscribing to industry newsletters, following relevant companies and organizations, or regularly checking reputable industry news sources and publications.
Methodology
Step 1 - Identification of Relevant Samples Size from Population Database


Step 2 - Approaches for Defining Global Market Size (Value, Volume* & Price*)

Note*: In applicable scenarios
Step 3 - Data Sources
Primary Research
- Web Analytics
- Survey Reports
- Research Institute
- Latest Research Reports
- Opinion Leaders
Secondary Research
- Annual Reports
- White Paper
- Latest Press Release
- Industry Association
- Paid Database
- Investor Presentations

Step 4 - Data Triangulation
Involves using different sources of information in order to increase the validity of a study
These sources are likely to be stakeholders in a program - participants, other researchers, program staff, other community members, and so on.
Then we put all data in single framework & apply various statistical tools to find out the dynamic on the market.
During the analysis stage, feedback from the stakeholder groups would be compared to determine areas of agreement as well as areas of divergence


