
Key Insights
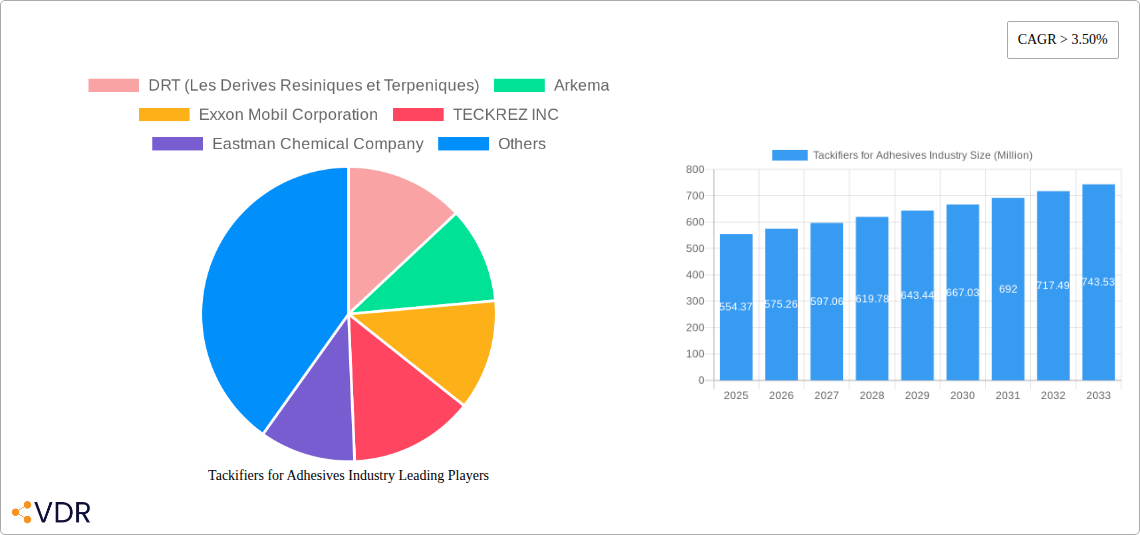
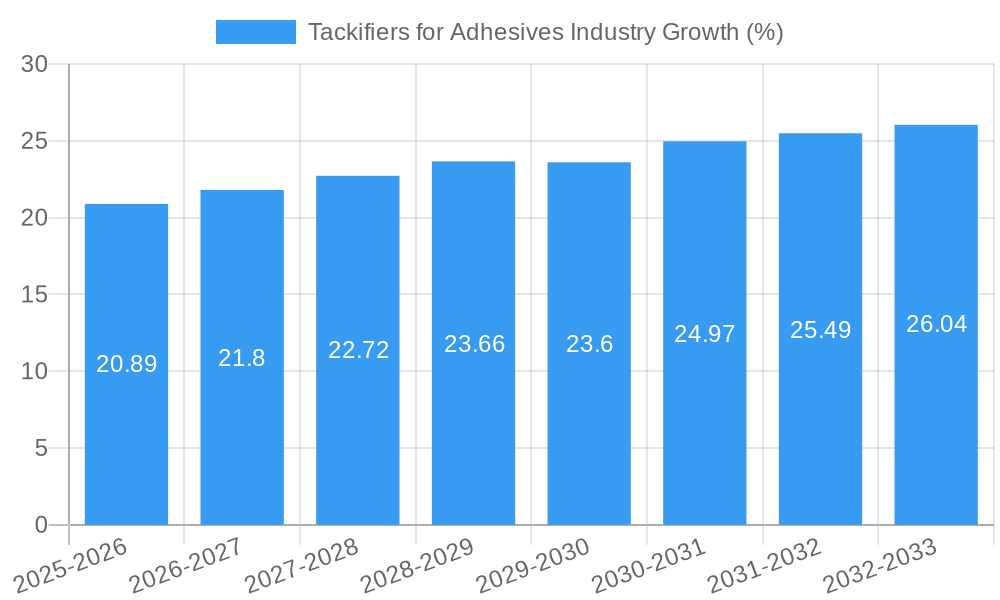
The global tackifiers for adhesives market, valued at $554.37 million in 2025, is projected to experience robust growth, driven by a compound annual growth rate (CAGR) exceeding 3.50% from 2025 to 2033. This expansion is fueled by several key factors. The increasing demand for adhesives in diverse end-use industries, including automotive, packaging, and construction, is a primary driver. Growth in the construction sector, particularly in developing economies, fuels demand for high-performance adhesives, thus boosting the tackifier market. Furthermore, advancements in adhesive technology, leading to the development of more specialized and efficient adhesives with improved tack and adhesion properties, are contributing to market expansion. The rising adoption of sustainable and eco-friendly adhesive formulations, driven by growing environmental concerns, presents a significant opportunity for manufacturers to develop bio-based tackifiers derived from renewable resources such as rosin resins and terpene resins. This shift towards sustainability is expected to positively influence market growth in the coming years. The market is segmented by feedstock (rosin resins, petroleum resins, terpene resins), form (solid, liquid, resin dispersion), type (synthetic, natural), application (tapes and labels, assembly, bookbinding, footwear, leather, and rubber articles, other applications), and end-user industry (automotive, building and construction, non-wovens, packaging, footwear, other end-user industries). Competition within the market is intense, with major players like Arkema, ExxonMobil, and Kraton Corporation vying for market share through innovation and strategic partnerships.
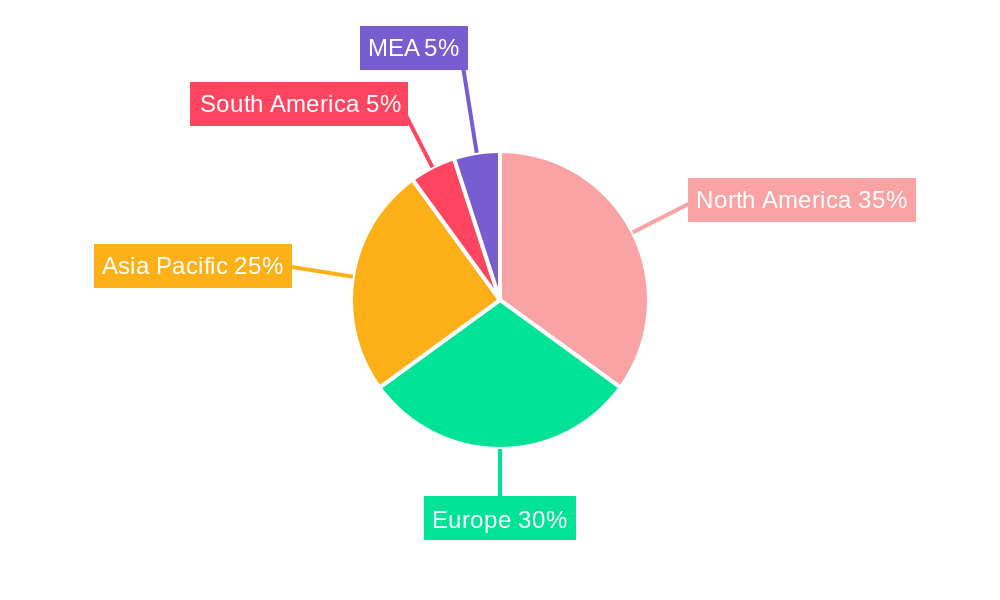
The geographical distribution of the market reveals significant regional variations. North America and Europe currently hold substantial market shares, driven by established industries and high per capita consumption of adhesive products. However, the Asia-Pacific region is poised for rapid growth due to its expanding manufacturing sector and increasing infrastructure development. The region’s burgeoning automotive and packaging industries are expected to significantly contribute to market expansion in the coming years. South America and the Middle East and Africa regions also present growth opportunities, albeit at a potentially slower pace compared to Asia-Pacific. Market players are strategically focusing on expanding their presence in high-growth regions, investing in local manufacturing facilities, and adapting their product offerings to cater to regional specific demands. The long-term outlook for the tackifiers for adhesives market remains positive, with continued growth expected throughout the forecast period due to the aforementioned factors.
Tackifiers for Adhesives Industry: A Comprehensive Market Report (2019-2033)
This in-depth report provides a comprehensive analysis of the Tackifiers for Adhesives market, encompassing market dynamics, growth trends, regional dominance, product landscape, challenges, opportunities, and key players. The study period covers 2019-2033, with a base year of 2025 and a forecast period of 2025-2033. The report leverages extensive primary and secondary research to deliver actionable insights for industry professionals. The global tackifiers market size is projected to reach xx Million by 2033.
Tackifiers for Adhesives Industry Market Dynamics & Structure
The tackifiers market is characterized by moderate concentration, with key players holding significant market share. Technological innovation, particularly in sustainable and high-performance tackifiers, is a major driver. Stringent environmental regulations are shaping product development, pushing manufacturers towards eco-friendly solutions. Competitive pressure from substitute materials, such as silicone-based adhesives, necessitates continuous innovation. The end-user demographics are diverse, with significant demand from packaging, automotive, and construction sectors. M&A activity, as exemplified by Arkema's acquisition of Shanghai Zhiguan Polymer Materials in 2022, reflects industry consolidation and expansion strategies.
- Market Concentration: Moderately concentrated, with top 10 players holding approximately 65% market share in 2024.
- Technological Innovation: Focus on bio-based resins, improved tack strength, and water-based formulations.
- Regulatory Framework: Increasing emphasis on VOC emissions and sustainability compliance.
- Competitive Substitutes: Silicone-based adhesives, pressure-sensitive adhesives (PSAs) pose competitive pressure.
- M&A Activity: xx deals recorded between 2019-2024, indicating consolidation and expansion strategies.
- Innovation Barriers: High R&D costs, regulatory compliance complexities, and market acceptance of novel materials.
Tackifiers for Adhesives Industry Growth Trends & Insights
The tackifiers market has witnessed steady growth during the historical period (2019-2024), driven by increasing demand from diverse end-use sectors. The CAGR during this period was approximately xx%. Growth is projected to continue during the forecast period (2025-2033), albeit at a slightly moderated pace, with a projected CAGR of xx%. This moderation is partially attributed to economic fluctuations and the potential impact of substitute materials. However, ongoing innovation in tackifier technology, particularly in the development of high-performance, sustainable options, is expected to support market expansion. The adoption rate of innovative tackifiers is influenced by factors such as cost, performance characteristics, and regulatory requirements. Consumer behavior shifts towards eco-friendly products will further drive growth in the segment of bio-based tackifiers.
Dominant Regions, Countries, or Segments in Tackifiers for Adhesives Industry
North America and Asia-Pacific currently dominate the tackifiers market, driven by robust industrial activity and significant demand from various end-use sectors. Within these regions, specific countries like the US, China, and Japan display high growth potential. Among segments, the Packaging end-user industry remains a dominant segment, followed by the Automotive and Building & Construction sectors. The Rosin Resins feedstock segment currently holds the largest market share. The Liquid form dominates due to its ease of application in various adhesive formulations. In terms of type, synthetic tackifiers hold a majority market share, attributed to their superior performance characteristics.
- Key Drivers: Strong economic growth in developing economies, infrastructure development, and increasing consumer demand for packaged goods.
- Dominant Regions: North America, Asia-Pacific.
- Dominant Segments: Packaging, Automotive, and Building & Construction (End-user); Rosin Resins (Feedstock); Liquid (Form); Synthetic (Type).
- Growth Potential: High in emerging economies due to industrialization and rising construction activities.
Tackifiers for Adhesives Industry Product Landscape
Tackifiers are undergoing significant advancements, with a focus on enhanced tack strength, improved adhesion properties, and environmentally friendly formulations. Innovative products incorporating bio-based resins and water-borne dispersions are gaining traction. These advancements are aimed at meeting the evolving needs of various adhesive applications, from pressure-sensitive adhesives to hot-melt adhesives. Unique selling propositions include superior performance, enhanced durability, and reduced environmental impact.
Key Drivers, Barriers & Challenges in Tackifiers for Adhesives Industry
Key Drivers:
- Increasing demand from packaging and automotive industries.
- Technological advancements leading to superior performance and eco-friendly options.
- Growing demand for sustainable and bio-based tackifiers.
Challenges:
- Fluctuations in raw material prices (rosin, petroleum) affecting profitability.
- Stringent environmental regulations increasing compliance costs.
- Intense competition from established and new market entrants. This competitive pressure is estimated to reduce average profit margins by approximately xx% by 2033.
Emerging Opportunities in Tackifiers for Adhesives Industry
- Expanding into niche applications, such as medical adhesives and electronics.
- Developing specialized tackifiers for sustainable packaging solutions.
- Leveraging nanotechnology to enhance tackifier performance.
- Focus on developing high-performance, eco-friendly tackifiers for the growing renewable energy sector.
Growth Accelerators in the Tackifiers for Adhesives Industry Industry
Technological breakthroughs, particularly in bio-based resin technology and water-borne dispersions, will drive long-term growth. Strategic partnerships and collaborations between tackifier manufacturers and adhesive producers are expected to enhance market penetration. Expansion into emerging markets, particularly in developing economies, offers substantial growth potential.
Key Players Shaping the Tackifiers for Adhesives Industry Market
- DRT (Les Derives Resiniques et Terpeniques)
- Arkema
- Exxon Mobil Corporation
- TECKREZ INC
- Eastman Chemical Company
- Neville Chemicals Company
- Lawter A Harima Chemicals Inc Company
- Arakawa Chemical Industries Ltd
- KRATON CORPORATION
- Natrochem Inc
- TWC Group
Notable Milestones in Tackifiers for Adhesives Industry Sector
- October 2023: Lawter introduced Snowtack HS80, a novel water-borne resin tackifier dispersion, expanding its product portfolio and targeting the water-based pressure-sensitive adhesive market.
- February 2022: Arkema's acquisition of Shanghai Zhiguan Polymer Materials (PMP) strengthened its position in the engineering adhesives market, significantly increasing its presence in the Asia-Pacific region.
In-Depth Tackifiers for Adhesives Industry Market Outlook
The tackifiers market is poised for continued growth, driven by technological advancements, sustainable solutions, and expansion into new applications. Strategic partnerships and investment in R&D will be crucial for manufacturers to maintain a competitive edge. The market is projected to experience healthy growth, with opportunities particularly abundant in emerging markets and specialized application segments. Companies focusing on innovation, sustainability, and strong supply chain management will be best positioned to capitalize on the market's future potential.
Tackifiers for Adhesives Industry Segmentation
-
1. Feedstock
- 1.1. Rosin Resins
- 1.2. Petroleum Resins
- 1.3. Terepene Resins
-
2. Form
- 2.1. Solid
- 2.2. Liquid
- 2.3. Resin Dispersion
-
3. Type
- 3.1. Synthetic
- 3.2. Natural
-
4. Application
- 4.1. Tapes and Labels
- 4.2. Assembly
- 4.3. Bookbinding
- 4.4. Footwear, Leather, and Rubber Articles
- 4.5. Other Applications (Profile Wrapping, Etc.)
-
5. End-user Industry
- 5.1. Automotive
- 5.2. Building and Construction
- 5.3. Non-Wovens
- 5.4. Packaging
- 5.5. Footwear
- 5.6. Other End-user Industries (Pulp and Paper, Etc.)
Tackifiers for Adhesives Industry Segmentation By Geography
-
1. Asia Pacific
- 1.1. China
- 1.2. India
- 1.3. Japan
- 1.4. South Korea
- 1.5. Rest of Asia Pacific
-
2. North America
- 2.1. United States
- 2.2. Canada
- 2.3. Mexico
-
3. Europe
- 3.1. Germany
- 3.2. United Kingdom
- 3.3. France
- 3.4. Italy
- 3.5. Rest of Europe
-
4. South America
- 4.1. Brazil
- 4.2. Argentina
- 4.3. Rest of South America
-
5. Middle East and Africa
- 5.1. Saudi Arabia
- 5.2. South Africa
- 5.3. Rest of Middle East and Africa
Tackifiers for Adhesives Industry REPORT HIGHLIGHTS
| Aspects | Details |
|---|---|
| Study Period | 2019-2033 |
| Base Year | 2024 |
| Estimated Year | 2025 |
| Forecast Period | 2025-2033 |
| Historical Period | 2019-2024 |
| Growth Rate | CAGR of > 3.50% from 2019-2033 |
| Segmentation |
|
Table of Contents
- 1. Introduction
- 1.1. Research Scope
- 1.2. Market Segmentation
- 1.3. Research Methodology
- 1.4. Definitions and Assumptions
- 2. Executive Summary
- 2.1. Introduction
- 3. Market Dynamics
- 3.1. Introduction
- 3.2. Market Drivers
- 3.2.1. Growing Urban Infrastructure in Developing Countries; Growing Demand for Hot-melt Adhesives in Asia-Pacific; Other Drivers
- 3.3. Market Restrains
- 3.3.1. Emerging Tackifier Free Adhesives Market; Other Restraints
- 3.4. Market Trends
- 3.4.1. Building and Construction Industry to Dominate the Market
- 4. Market Factor Analysis
- 4.1. Porters Five Forces
- 4.2. Supply/Value Chain
- 4.3. PESTEL analysis
- 4.4. Market Entropy
- 4.5. Patent/Trademark Analysis
- 5. Global Tackifiers for Adhesives Industry Analysis, Insights and Forecast, 2019-2031
- 5.1. Market Analysis, Insights and Forecast - by Feedstock
- 5.1.1. Rosin Resins
- 5.1.2. Petroleum Resins
- 5.1.3. Terepene Resins
- 5.2. Market Analysis, Insights and Forecast - by Form
- 5.2.1. Solid
- 5.2.2. Liquid
- 5.2.3. Resin Dispersion
- 5.3. Market Analysis, Insights and Forecast - by Type
- 5.3.1. Synthetic
- 5.3.2. Natural
- 5.4. Market Analysis, Insights and Forecast - by Application
- 5.4.1. Tapes and Labels
- 5.4.2. Assembly
- 5.4.3. Bookbinding
- 5.4.4. Footwear, Leather, and Rubber Articles
- 5.4.5. Other Applications (Profile Wrapping, Etc.)
- 5.5. Market Analysis, Insights and Forecast - by End-user Industry
- 5.5.1. Automotive
- 5.5.2. Building and Construction
- 5.5.3. Non-Wovens
- 5.5.4. Packaging
- 5.5.5. Footwear
- 5.5.6. Other End-user Industries (Pulp and Paper, Etc.)
- 5.6. Market Analysis, Insights and Forecast - by Region
- 5.6.1. Asia Pacific
- 5.6.2. North America
- 5.6.3. Europe
- 5.6.4. South America
- 5.6.5. Middle East and Africa
- 5.1. Market Analysis, Insights and Forecast - by Feedstock
- 6. Asia Pacific Tackifiers for Adhesives Industry Analysis, Insights and Forecast, 2019-2031
- 6.1. Market Analysis, Insights and Forecast - by Feedstock
- 6.1.1. Rosin Resins
- 6.1.2. Petroleum Resins
- 6.1.3. Terepene Resins
- 6.2. Market Analysis, Insights and Forecast - by Form
- 6.2.1. Solid
- 6.2.2. Liquid
- 6.2.3. Resin Dispersion
- 6.3. Market Analysis, Insights and Forecast - by Type
- 6.3.1. Synthetic
- 6.3.2. Natural
- 6.4. Market Analysis, Insights and Forecast - by Application
- 6.4.1. Tapes and Labels
- 6.4.2. Assembly
- 6.4.3. Bookbinding
- 6.4.4. Footwear, Leather, and Rubber Articles
- 6.4.5. Other Applications (Profile Wrapping, Etc.)
- 6.5. Market Analysis, Insights and Forecast - by End-user Industry
- 6.5.1. Automotive
- 6.5.2. Building and Construction
- 6.5.3. Non-Wovens
- 6.5.4. Packaging
- 6.5.5. Footwear
- 6.5.6. Other End-user Industries (Pulp and Paper, Etc.)
- 6.1. Market Analysis, Insights and Forecast - by Feedstock
- 7. North America Tackifiers for Adhesives Industry Analysis, Insights and Forecast, 2019-2031
- 7.1. Market Analysis, Insights and Forecast - by Feedstock
- 7.1.1. Rosin Resins
- 7.1.2. Petroleum Resins
- 7.1.3. Terepene Resins
- 7.2. Market Analysis, Insights and Forecast - by Form
- 7.2.1. Solid
- 7.2.2. Liquid
- 7.2.3. Resin Dispersion
- 7.3. Market Analysis, Insights and Forecast - by Type
- 7.3.1. Synthetic
- 7.3.2. Natural
- 7.4. Market Analysis, Insights and Forecast - by Application
- 7.4.1. Tapes and Labels
- 7.4.2. Assembly
- 7.4.3. Bookbinding
- 7.4.4. Footwear, Leather, and Rubber Articles
- 7.4.5. Other Applications (Profile Wrapping, Etc.)
- 7.5. Market Analysis, Insights and Forecast - by End-user Industry
- 7.5.1. Automotive
- 7.5.2. Building and Construction
- 7.5.3. Non-Wovens
- 7.5.4. Packaging
- 7.5.5. Footwear
- 7.5.6. Other End-user Industries (Pulp and Paper, Etc.)
- 7.1. Market Analysis, Insights and Forecast - by Feedstock
- 8. Europe Tackifiers for Adhesives Industry Analysis, Insights and Forecast, 2019-2031
- 8.1. Market Analysis, Insights and Forecast - by Feedstock
- 8.1.1. Rosin Resins
- 8.1.2. Petroleum Resins
- 8.1.3. Terepene Resins
- 8.2. Market Analysis, Insights and Forecast - by Form
- 8.2.1. Solid
- 8.2.2. Liquid
- 8.2.3. Resin Dispersion
- 8.3. Market Analysis, Insights and Forecast - by Type
- 8.3.1. Synthetic
- 8.3.2. Natural
- 8.4. Market Analysis, Insights and Forecast - by Application
- 8.4.1. Tapes and Labels
- 8.4.2. Assembly
- 8.4.3. Bookbinding
- 8.4.4. Footwear, Leather, and Rubber Articles
- 8.4.5. Other Applications (Profile Wrapping, Etc.)
- 8.5. Market Analysis, Insights and Forecast - by End-user Industry
- 8.5.1. Automotive
- 8.5.2. Building and Construction
- 8.5.3. Non-Wovens
- 8.5.4. Packaging
- 8.5.5. Footwear
- 8.5.6. Other End-user Industries (Pulp and Paper, Etc.)
- 8.1. Market Analysis, Insights and Forecast - by Feedstock
- 9. South America Tackifiers for Adhesives Industry Analysis, Insights and Forecast, 2019-2031
- 9.1. Market Analysis, Insights and Forecast - by Feedstock
- 9.1.1. Rosin Resins
- 9.1.2. Petroleum Resins
- 9.1.3. Terepene Resins
- 9.2. Market Analysis, Insights and Forecast - by Form
- 9.2.1. Solid
- 9.2.2. Liquid
- 9.2.3. Resin Dispersion
- 9.3. Market Analysis, Insights and Forecast - by Type
- 9.3.1. Synthetic
- 9.3.2. Natural
- 9.4. Market Analysis, Insights and Forecast - by Application
- 9.4.1. Tapes and Labels
- 9.4.2. Assembly
- 9.4.3. Bookbinding
- 9.4.4. Footwear, Leather, and Rubber Articles
- 9.4.5. Other Applications (Profile Wrapping, Etc.)
- 9.5. Market Analysis, Insights and Forecast - by End-user Industry
- 9.5.1. Automotive
- 9.5.2. Building and Construction
- 9.5.3. Non-Wovens
- 9.5.4. Packaging
- 9.5.5. Footwear
- 9.5.6. Other End-user Industries (Pulp and Paper, Etc.)
- 9.1. Market Analysis, Insights and Forecast - by Feedstock
- 10. Middle East and Africa Tackifiers for Adhesives Industry Analysis, Insights and Forecast, 2019-2031
- 10.1. Market Analysis, Insights and Forecast - by Feedstock
- 10.1.1. Rosin Resins
- 10.1.2. Petroleum Resins
- 10.1.3. Terepene Resins
- 10.2. Market Analysis, Insights and Forecast - by Form
- 10.2.1. Solid
- 10.2.2. Liquid
- 10.2.3. Resin Dispersion
- 10.3. Market Analysis, Insights and Forecast - by Type
- 10.3.1. Synthetic
- 10.3.2. Natural
- 10.4. Market Analysis, Insights and Forecast - by Application
- 10.4.1. Tapes and Labels
- 10.4.2. Assembly
- 10.4.3. Bookbinding
- 10.4.4. Footwear, Leather, and Rubber Articles
- 10.4.5. Other Applications (Profile Wrapping, Etc.)
- 10.5. Market Analysis, Insights and Forecast - by End-user Industry
- 10.5.1. Automotive
- 10.5.2. Building and Construction
- 10.5.3. Non-Wovens
- 10.5.4. Packaging
- 10.5.5. Footwear
- 10.5.6. Other End-user Industries (Pulp and Paper, Etc.)
- 10.1. Market Analysis, Insights and Forecast - by Feedstock
- 11. North America Tackifiers for Adhesives Industry Analysis, Insights and Forecast, 2019-2031
- 11.1. Market Analysis, Insights and Forecast - By Country/Sub-region
- 11.1.1 United States
- 11.1.2 Canada
- 11.1.3 Mexico
- 12. Europe Tackifiers for Adhesives Industry Analysis, Insights and Forecast, 2019-2031
- 12.1. Market Analysis, Insights and Forecast - By Country/Sub-region
- 12.1.1 Germany
- 12.1.2 France
- 12.1.3 Italy
- 12.1.4 United Kingdom
- 12.1.5 Netherlands
- 12.1.6 Rest of Europe
- 13. Asia Pacific Tackifiers for Adhesives Industry Analysis, Insights and Forecast, 2019-2031
- 13.1. Market Analysis, Insights and Forecast - By Country/Sub-region
- 13.1.1 China
- 13.1.2 Japan
- 13.1.3 India
- 13.1.4 South Korea
- 13.1.5 Taiwan
- 13.1.6 Australia
- 13.1.7 Rest of Asia-Pacific
- 14. South America Tackifiers for Adhesives Industry Analysis, Insights and Forecast, 2019-2031
- 14.1. Market Analysis, Insights and Forecast - By Country/Sub-region
- 14.1.1 Brazil
- 14.1.2 Argentina
- 14.1.3 Rest of South America
- 15. MEA Tackifiers for Adhesives Industry Analysis, Insights and Forecast, 2019-2031
- 15.1. Market Analysis, Insights and Forecast - By Country/Sub-region
- 15.1.1 Middle East
- 15.1.2 Africa
- 16. Competitive Analysis
- 16.1. Global Market Share Analysis 2024
- 16.2. Company Profiles
- 16.2.1 DRT (Les Derives Resiniques et Terpeniques)
- 16.2.1.1. Overview
- 16.2.1.2. Products
- 16.2.1.3. SWOT Analysis
- 16.2.1.4. Recent Developments
- 16.2.1.5. Financials (Based on Availability)
- 16.2.2 Arkema
- 16.2.2.1. Overview
- 16.2.2.2. Products
- 16.2.2.3. SWOT Analysis
- 16.2.2.4. Recent Developments
- 16.2.2.5. Financials (Based on Availability)
- 16.2.3 Exxon Mobil Corporation
- 16.2.3.1. Overview
- 16.2.3.2. Products
- 16.2.3.3. SWOT Analysis
- 16.2.3.4. Recent Developments
- 16.2.3.5. Financials (Based on Availability)
- 16.2.4 TECKREZ INC
- 16.2.4.1. Overview
- 16.2.4.2. Products
- 16.2.4.3. SWOT Analysis
- 16.2.4.4. Recent Developments
- 16.2.4.5. Financials (Based on Availability)
- 16.2.5 Eastman Chemical Company
- 16.2.5.1. Overview
- 16.2.5.2. Products
- 16.2.5.3. SWOT Analysis
- 16.2.5.4. Recent Developments
- 16.2.5.5. Financials (Based on Availability)
- 16.2.6 Neville Chemicals Company
- 16.2.6.1. Overview
- 16.2.6.2. Products
- 16.2.6.3. SWOT Analysis
- 16.2.6.4. Recent Developments
- 16.2.6.5. Financials (Based on Availability)
- 16.2.7 Lawter A Harima Chemicals Inc Company
- 16.2.7.1. Overview
- 16.2.7.2. Products
- 16.2.7.3. SWOT Analysis
- 16.2.7.4. Recent Developments
- 16.2.7.5. Financials (Based on Availability)
- 16.2.8 Arakawa Chemical IndustriesLtd
- 16.2.8.1. Overview
- 16.2.8.2. Products
- 16.2.8.3. SWOT Analysis
- 16.2.8.4. Recent Developments
- 16.2.8.5. Financials (Based on Availability)
- 16.2.9 KRATON CORPORATION
- 16.2.9.1. Overview
- 16.2.9.2. Products
- 16.2.9.3. SWOT Analysis
- 16.2.9.4. Recent Developments
- 16.2.9.5. Financials (Based on Availability)
- 16.2.10 Natrochem Inc
- 16.2.10.1. Overview
- 16.2.10.2. Products
- 16.2.10.3. SWOT Analysis
- 16.2.10.4. Recent Developments
- 16.2.10.5. Financials (Based on Availability)
- 16.2.11 TWC Group
- 16.2.11.1. Overview
- 16.2.11.2. Products
- 16.2.11.3. SWOT Analysis
- 16.2.11.4. Recent Developments
- 16.2.11.5. Financials (Based on Availability)
- 16.2.1 DRT (Les Derives Resiniques et Terpeniques)
List of Figures
- Figure 1: Global Tackifiers for Adhesives Industry Revenue Breakdown (Million, %) by Region 2024 & 2032
- Figure 2: Global Tackifiers for Adhesives Industry Volume Breakdown (K Tons, %) by Region 2024 & 2032
- Figure 3: North America Tackifiers for Adhesives Industry Revenue (Million), by Country 2024 & 2032
- Figure 4: North America Tackifiers for Adhesives Industry Volume (K Tons), by Country 2024 & 2032
- Figure 5: North America Tackifiers for Adhesives Industry Revenue Share (%), by Country 2024 & 2032
- Figure 6: North America Tackifiers for Adhesives Industry Volume Share (%), by Country 2024 & 2032
- Figure 7: Europe Tackifiers for Adhesives Industry Revenue (Million), by Country 2024 & 2032
- Figure 8: Europe Tackifiers for Adhesives Industry Volume (K Tons), by Country 2024 & 2032
- Figure 9: Europe Tackifiers for Adhesives Industry Revenue Share (%), by Country 2024 & 2032
- Figure 10: Europe Tackifiers for Adhesives Industry Volume Share (%), by Country 2024 & 2032
- Figure 11: Asia Pacific Tackifiers for Adhesives Industry Revenue (Million), by Country 2024 & 2032
- Figure 12: Asia Pacific Tackifiers for Adhesives Industry Volume (K Tons), by Country 2024 & 2032
- Figure 13: Asia Pacific Tackifiers for Adhesives Industry Revenue Share (%), by Country 2024 & 2032
- Figure 14: Asia Pacific Tackifiers for Adhesives Industry Volume Share (%), by Country 2024 & 2032
- Figure 15: South America Tackifiers for Adhesives Industry Revenue (Million), by Country 2024 & 2032
- Figure 16: South America Tackifiers for Adhesives Industry Volume (K Tons), by Country 2024 & 2032
- Figure 17: South America Tackifiers for Adhesives Industry Revenue Share (%), by Country 2024 & 2032
- Figure 18: South America Tackifiers for Adhesives Industry Volume Share (%), by Country 2024 & 2032
- Figure 19: MEA Tackifiers for Adhesives Industry Revenue (Million), by Country 2024 & 2032
- Figure 20: MEA Tackifiers for Adhesives Industry Volume (K Tons), by Country 2024 & 2032
- Figure 21: MEA Tackifiers for Adhesives Industry Revenue Share (%), by Country 2024 & 2032
- Figure 22: MEA Tackifiers for Adhesives Industry Volume Share (%), by Country 2024 & 2032
- Figure 23: Asia Pacific Tackifiers for Adhesives Industry Revenue (Million), by Feedstock 2024 & 2032
- Figure 24: Asia Pacific Tackifiers for Adhesives Industry Volume (K Tons), by Feedstock 2024 & 2032
- Figure 25: Asia Pacific Tackifiers for Adhesives Industry Revenue Share (%), by Feedstock 2024 & 2032
- Figure 26: Asia Pacific Tackifiers for Adhesives Industry Volume Share (%), by Feedstock 2024 & 2032
- Figure 27: Asia Pacific Tackifiers for Adhesives Industry Revenue (Million), by Form 2024 & 2032
- Figure 28: Asia Pacific Tackifiers for Adhesives Industry Volume (K Tons), by Form 2024 & 2032
- Figure 29: Asia Pacific Tackifiers for Adhesives Industry Revenue Share (%), by Form 2024 & 2032
- Figure 30: Asia Pacific Tackifiers for Adhesives Industry Volume Share (%), by Form 2024 & 2032
- Figure 31: Asia Pacific Tackifiers for Adhesives Industry Revenue (Million), by Type 2024 & 2032
- Figure 32: Asia Pacific Tackifiers for Adhesives Industry Volume (K Tons), by Type 2024 & 2032
- Figure 33: Asia Pacific Tackifiers for Adhesives Industry Revenue Share (%), by Type 2024 & 2032
- Figure 34: Asia Pacific Tackifiers for Adhesives Industry Volume Share (%), by Type 2024 & 2032
- Figure 35: Asia Pacific Tackifiers for Adhesives Industry Revenue (Million), by Application 2024 & 2032
- Figure 36: Asia Pacific Tackifiers for Adhesives Industry Volume (K Tons), by Application 2024 & 2032
- Figure 37: Asia Pacific Tackifiers for Adhesives Industry Revenue Share (%), by Application 2024 & 2032
- Figure 38: Asia Pacific Tackifiers for Adhesives Industry Volume Share (%), by Application 2024 & 2032
- Figure 39: Asia Pacific Tackifiers for Adhesives Industry Revenue (Million), by End-user Industry 2024 & 2032
- Figure 40: Asia Pacific Tackifiers for Adhesives Industry Volume (K Tons), by End-user Industry 2024 & 2032
- Figure 41: Asia Pacific Tackifiers for Adhesives Industry Revenue Share (%), by End-user Industry 2024 & 2032
- Figure 42: Asia Pacific Tackifiers for Adhesives Industry Volume Share (%), by End-user Industry 2024 & 2032
- Figure 43: Asia Pacific Tackifiers for Adhesives Industry Revenue (Million), by Country 2024 & 2032
- Figure 44: Asia Pacific Tackifiers for Adhesives Industry Volume (K Tons), by Country 2024 & 2032
- Figure 45: Asia Pacific Tackifiers for Adhesives Industry Revenue Share (%), by Country 2024 & 2032
- Figure 46: Asia Pacific Tackifiers for Adhesives Industry Volume Share (%), by Country 2024 & 2032
- Figure 47: North America Tackifiers for Adhesives Industry Revenue (Million), by Feedstock 2024 & 2032
- Figure 48: North America Tackifiers for Adhesives Industry Volume (K Tons), by Feedstock 2024 & 2032
- Figure 49: North America Tackifiers for Adhesives Industry Revenue Share (%), by Feedstock 2024 & 2032
- Figure 50: North America Tackifiers for Adhesives Industry Volume Share (%), by Feedstock 2024 & 2032
- Figure 51: North America Tackifiers for Adhesives Industry Revenue (Million), by Form 2024 & 2032
- Figure 52: North America Tackifiers for Adhesives Industry Volume (K Tons), by Form 2024 & 2032
- Figure 53: North America Tackifiers for Adhesives Industry Revenue Share (%), by Form 2024 & 2032
- Figure 54: North America Tackifiers for Adhesives Industry Volume Share (%), by Form 2024 & 2032
- Figure 55: North America Tackifiers for Adhesives Industry Revenue (Million), by Type 2024 & 2032
- Figure 56: North America Tackifiers for Adhesives Industry Volume (K Tons), by Type 2024 & 2032
- Figure 57: North America Tackifiers for Adhesives Industry Revenue Share (%), by Type 2024 & 2032
- Figure 58: North America Tackifiers for Adhesives Industry Volume Share (%), by Type 2024 & 2032
- Figure 59: North America Tackifiers for Adhesives Industry Revenue (Million), by Application 2024 & 2032
- Figure 60: North America Tackifiers for Adhesives Industry Volume (K Tons), by Application 2024 & 2032
- Figure 61: North America Tackifiers for Adhesives Industry Revenue Share (%), by Application 2024 & 2032
- Figure 62: North America Tackifiers for Adhesives Industry Volume Share (%), by Application 2024 & 2032
- Figure 63: North America Tackifiers for Adhesives Industry Revenue (Million), by End-user Industry 2024 & 2032
- Figure 64: North America Tackifiers for Adhesives Industry Volume (K Tons), by End-user Industry 2024 & 2032
- Figure 65: North America Tackifiers for Adhesives Industry Revenue Share (%), by End-user Industry 2024 & 2032
- Figure 66: North America Tackifiers for Adhesives Industry Volume Share (%), by End-user Industry 2024 & 2032
- Figure 67: North America Tackifiers for Adhesives Industry Revenue (Million), by Country 2024 & 2032
- Figure 68: North America Tackifiers for Adhesives Industry Volume (K Tons), by Country 2024 & 2032
- Figure 69: North America Tackifiers for Adhesives Industry Revenue Share (%), by Country 2024 & 2032
- Figure 70: North America Tackifiers for Adhesives Industry Volume Share (%), by Country 2024 & 2032
- Figure 71: Europe Tackifiers for Adhesives Industry Revenue (Million), by Feedstock 2024 & 2032
- Figure 72: Europe Tackifiers for Adhesives Industry Volume (K Tons), by Feedstock 2024 & 2032
- Figure 73: Europe Tackifiers for Adhesives Industry Revenue Share (%), by Feedstock 2024 & 2032
- Figure 74: Europe Tackifiers for Adhesives Industry Volume Share (%), by Feedstock 2024 & 2032
- Figure 75: Europe Tackifiers for Adhesives Industry Revenue (Million), by Form 2024 & 2032
- Figure 76: Europe Tackifiers for Adhesives Industry Volume (K Tons), by Form 2024 & 2032
- Figure 77: Europe Tackifiers for Adhesives Industry Revenue Share (%), by Form 2024 & 2032
- Figure 78: Europe Tackifiers for Adhesives Industry Volume Share (%), by Form 2024 & 2032
- Figure 79: Europe Tackifiers for Adhesives Industry Revenue (Million), by Type 2024 & 2032
- Figure 80: Europe Tackifiers for Adhesives Industry Volume (K Tons), by Type 2024 & 2032
- Figure 81: Europe Tackifiers for Adhesives Industry Revenue Share (%), by Type 2024 & 2032
- Figure 82: Europe Tackifiers for Adhesives Industry Volume Share (%), by Type 2024 & 2032
- Figure 83: Europe Tackifiers for Adhesives Industry Revenue (Million), by Application 2024 & 2032
- Figure 84: Europe Tackifiers for Adhesives Industry Volume (K Tons), by Application 2024 & 2032
- Figure 85: Europe Tackifiers for Adhesives Industry Revenue Share (%), by Application 2024 & 2032
- Figure 86: Europe Tackifiers for Adhesives Industry Volume Share (%), by Application 2024 & 2032
- Figure 87: Europe Tackifiers for Adhesives Industry Revenue (Million), by End-user Industry 2024 & 2032
- Figure 88: Europe Tackifiers for Adhesives Industry Volume (K Tons), by End-user Industry 2024 & 2032
- Figure 89: Europe Tackifiers for Adhesives Industry Revenue Share (%), by End-user Industry 2024 & 2032
- Figure 90: Europe Tackifiers for Adhesives Industry Volume Share (%), by End-user Industry 2024 & 2032
- Figure 91: Europe Tackifiers for Adhesives Industry Revenue (Million), by Country 2024 & 2032
- Figure 92: Europe Tackifiers for Adhesives Industry Volume (K Tons), by Country 2024 & 2032
- Figure 93: Europe Tackifiers for Adhesives Industry Revenue Share (%), by Country 2024 & 2032
- Figure 94: Europe Tackifiers for Adhesives Industry Volume Share (%), by Country 2024 & 2032
- Figure 95: South America Tackifiers for Adhesives Industry Revenue (Million), by Feedstock 2024 & 2032
- Figure 96: South America Tackifiers for Adhesives Industry Volume (K Tons), by Feedstock 2024 & 2032
- Figure 97: South America Tackifiers for Adhesives Industry Revenue Share (%), by Feedstock 2024 & 2032
- Figure 98: South America Tackifiers for Adhesives Industry Volume Share (%), by Feedstock 2024 & 2032
- Figure 99: South America Tackifiers for Adhesives Industry Revenue (Million), by Form 2024 & 2032
- Figure 100: South America Tackifiers for Adhesives Industry Volume (K Tons), by Form 2024 & 2032
- Figure 101: South America Tackifiers for Adhesives Industry Revenue Share (%), by Form 2024 & 2032
- Figure 102: South America Tackifiers for Adhesives Industry Volume Share (%), by Form 2024 & 2032
- Figure 103: South America Tackifiers for Adhesives Industry Revenue (Million), by Type 2024 & 2032
- Figure 104: South America Tackifiers for Adhesives Industry Volume (K Tons), by Type 2024 & 2032
- Figure 105: South America Tackifiers for Adhesives Industry Revenue Share (%), by Type 2024 & 2032
- Figure 106: South America Tackifiers for Adhesives Industry Volume Share (%), by Type 2024 & 2032
- Figure 107: South America Tackifiers for Adhesives Industry Revenue (Million), by Application 2024 & 2032
- Figure 108: South America Tackifiers for Adhesives Industry Volume (K Tons), by Application 2024 & 2032
- Figure 109: South America Tackifiers for Adhesives Industry Revenue Share (%), by Application 2024 & 2032
- Figure 110: South America Tackifiers for Adhesives Industry Volume Share (%), by Application 2024 & 2032
- Figure 111: South America Tackifiers for Adhesives Industry Revenue (Million), by End-user Industry 2024 & 2032
- Figure 112: South America Tackifiers for Adhesives Industry Volume (K Tons), by End-user Industry 2024 & 2032
- Figure 113: South America Tackifiers for Adhesives Industry Revenue Share (%), by End-user Industry 2024 & 2032
- Figure 114: South America Tackifiers for Adhesives Industry Volume Share (%), by End-user Industry 2024 & 2032
- Figure 115: South America Tackifiers for Adhesives Industry Revenue (Million), by Country 2024 & 2032
- Figure 116: South America Tackifiers for Adhesives Industry Volume (K Tons), by Country 2024 & 2032
- Figure 117: South America Tackifiers for Adhesives Industry Revenue Share (%), by Country 2024 & 2032
- Figure 118: South America Tackifiers for Adhesives Industry Volume Share (%), by Country 2024 & 2032
- Figure 119: Middle East and Africa Tackifiers for Adhesives Industry Revenue (Million), by Feedstock 2024 & 2032
- Figure 120: Middle East and Africa Tackifiers for Adhesives Industry Volume (K Tons), by Feedstock 2024 & 2032
- Figure 121: Middle East and Africa Tackifiers for Adhesives Industry Revenue Share (%), by Feedstock 2024 & 2032
- Figure 122: Middle East and Africa Tackifiers for Adhesives Industry Volume Share (%), by Feedstock 2024 & 2032
- Figure 123: Middle East and Africa Tackifiers for Adhesives Industry Revenue (Million), by Form 2024 & 2032
- Figure 124: Middle East and Africa Tackifiers for Adhesives Industry Volume (K Tons), by Form 2024 & 2032
- Figure 125: Middle East and Africa Tackifiers for Adhesives Industry Revenue Share (%), by Form 2024 & 2032
- Figure 126: Middle East and Africa Tackifiers for Adhesives Industry Volume Share (%), by Form 2024 & 2032
- Figure 127: Middle East and Africa Tackifiers for Adhesives Industry Revenue (Million), by Type 2024 & 2032
- Figure 128: Middle East and Africa Tackifiers for Adhesives Industry Volume (K Tons), by Type 2024 & 2032
- Figure 129: Middle East and Africa Tackifiers for Adhesives Industry Revenue Share (%), by Type 2024 & 2032
- Figure 130: Middle East and Africa Tackifiers for Adhesives Industry Volume Share (%), by Type 2024 & 2032
- Figure 131: Middle East and Africa Tackifiers for Adhesives Industry Revenue (Million), by Application 2024 & 2032
- Figure 132: Middle East and Africa Tackifiers for Adhesives Industry Volume (K Tons), by Application 2024 & 2032
- Figure 133: Middle East and Africa Tackifiers for Adhesives Industry Revenue Share (%), by Application 2024 & 2032
- Figure 134: Middle East and Africa Tackifiers for Adhesives Industry Volume Share (%), by Application 2024 & 2032
- Figure 135: Middle East and Africa Tackifiers for Adhesives Industry Revenue (Million), by End-user Industry 2024 & 2032
- Figure 136: Middle East and Africa Tackifiers for Adhesives Industry Volume (K Tons), by End-user Industry 2024 & 2032
- Figure 137: Middle East and Africa Tackifiers for Adhesives Industry Revenue Share (%), by End-user Industry 2024 & 2032
- Figure 138: Middle East and Africa Tackifiers for Adhesives Industry Volume Share (%), by End-user Industry 2024 & 2032
- Figure 139: Middle East and Africa Tackifiers for Adhesives Industry Revenue (Million), by Country 2024 & 2032
- Figure 140: Middle East and Africa Tackifiers for Adhesives Industry Volume (K Tons), by Country 2024 & 2032
- Figure 141: Middle East and Africa Tackifiers for Adhesives Industry Revenue Share (%), by Country 2024 & 2032
- Figure 142: Middle East and Africa Tackifiers for Adhesives Industry Volume Share (%), by Country 2024 & 2032
List of Tables
- Table 1: Global Tackifiers for Adhesives Industry Revenue Million Forecast, by Region 2019 & 2032
- Table 2: Global Tackifiers for Adhesives Industry Volume K Tons Forecast, by Region 2019 & 2032
- Table 3: Global Tackifiers for Adhesives Industry Revenue Million Forecast, by Feedstock 2019 & 2032
- Table 4: Global Tackifiers for Adhesives Industry Volume K Tons Forecast, by Feedstock 2019 & 2032
- Table 5: Global Tackifiers for Adhesives Industry Revenue Million Forecast, by Form 2019 & 2032
- Table 6: Global Tackifiers for Adhesives Industry Volume K Tons Forecast, by Form 2019 & 2032
- Table 7: Global Tackifiers for Adhesives Industry Revenue Million Forecast, by Type 2019 & 2032
- Table 8: Global Tackifiers for Adhesives Industry Volume K Tons Forecast, by Type 2019 & 2032
- Table 9: Global Tackifiers for Adhesives Industry Revenue Million Forecast, by Application 2019 & 2032
- Table 10: Global Tackifiers for Adhesives Industry Volume K Tons Forecast, by Application 2019 & 2032
- Table 11: Global Tackifiers for Adhesives Industry Revenue Million Forecast, by End-user Industry 2019 & 2032
- Table 12: Global Tackifiers for Adhesives Industry Volume K Tons Forecast, by End-user Industry 2019 & 2032
- Table 13: Global Tackifiers for Adhesives Industry Revenue Million Forecast, by Region 2019 & 2032
- Table 14: Global Tackifiers for Adhesives Industry Volume K Tons Forecast, by Region 2019 & 2032
- Table 15: Global Tackifiers for Adhesives Industry Revenue Million Forecast, by Country 2019 & 2032
- Table 16: Global Tackifiers for Adhesives Industry Volume K Tons Forecast, by Country 2019 & 2032
- Table 17: United States Tackifiers for Adhesives Industry Revenue (Million) Forecast, by Application 2019 & 2032
- Table 18: United States Tackifiers for Adhesives Industry Volume (K Tons) Forecast, by Application 2019 & 2032
- Table 19: Canada Tackifiers for Adhesives Industry Revenue (Million) Forecast, by Application 2019 & 2032
- Table 20: Canada Tackifiers for Adhesives Industry Volume (K Tons) Forecast, by Application 2019 & 2032
- Table 21: Mexico Tackifiers for Adhesives Industry Revenue (Million) Forecast, by Application 2019 & 2032
- Table 22: Mexico Tackifiers for Adhesives Industry Volume (K Tons) Forecast, by Application 2019 & 2032
- Table 23: Global Tackifiers for Adhesives Industry Revenue Million Forecast, by Country 2019 & 2032
- Table 24: Global Tackifiers for Adhesives Industry Volume K Tons Forecast, by Country 2019 & 2032
- Table 25: Germany Tackifiers for Adhesives Industry Revenue (Million) Forecast, by Application 2019 & 2032
- Table 26: Germany Tackifiers for Adhesives Industry Volume (K Tons) Forecast, by Application 2019 & 2032
- Table 27: France Tackifiers for Adhesives Industry Revenue (Million) Forecast, by Application 2019 & 2032
- Table 28: France Tackifiers for Adhesives Industry Volume (K Tons) Forecast, by Application 2019 & 2032
- Table 29: Italy Tackifiers for Adhesives Industry Revenue (Million) Forecast, by Application 2019 & 2032
- Table 30: Italy Tackifiers for Adhesives Industry Volume (K Tons) Forecast, by Application 2019 & 2032
- Table 31: United Kingdom Tackifiers for Adhesives Industry Revenue (Million) Forecast, by Application 2019 & 2032
- Table 32: United Kingdom Tackifiers for Adhesives Industry Volume (K Tons) Forecast, by Application 2019 & 2032
- Table 33: Netherlands Tackifiers for Adhesives Industry Revenue (Million) Forecast, by Application 2019 & 2032
- Table 34: Netherlands Tackifiers for Adhesives Industry Volume (K Tons) Forecast, by Application 2019 & 2032
- Table 35: Rest of Europe Tackifiers for Adhesives Industry Revenue (Million) Forecast, by Application 2019 & 2032
- Table 36: Rest of Europe Tackifiers for Adhesives Industry Volume (K Tons) Forecast, by Application 2019 & 2032
- Table 37: Global Tackifiers for Adhesives Industry Revenue Million Forecast, by Country 2019 & 2032
- Table 38: Global Tackifiers for Adhesives Industry Volume K Tons Forecast, by Country 2019 & 2032
- Table 39: China Tackifiers for Adhesives Industry Revenue (Million) Forecast, by Application 2019 & 2032
- Table 40: China Tackifiers for Adhesives Industry Volume (K Tons) Forecast, by Application 2019 & 2032
- Table 41: Japan Tackifiers for Adhesives Industry Revenue (Million) Forecast, by Application 2019 & 2032
- Table 42: Japan Tackifiers for Adhesives Industry Volume (K Tons) Forecast, by Application 2019 & 2032
- Table 43: India Tackifiers for Adhesives Industry Revenue (Million) Forecast, by Application 2019 & 2032
- Table 44: India Tackifiers for Adhesives Industry Volume (K Tons) Forecast, by Application 2019 & 2032
- Table 45: South Korea Tackifiers for Adhesives Industry Revenue (Million) Forecast, by Application 2019 & 2032
- Table 46: South Korea Tackifiers for Adhesives Industry Volume (K Tons) Forecast, by Application 2019 & 2032
- Table 47: Taiwan Tackifiers for Adhesives Industry Revenue (Million) Forecast, by Application 2019 & 2032
- Table 48: Taiwan Tackifiers for Adhesives Industry Volume (K Tons) Forecast, by Application 2019 & 2032
- Table 49: Australia Tackifiers for Adhesives Industry Revenue (Million) Forecast, by Application 2019 & 2032
- Table 50: Australia Tackifiers for Adhesives Industry Volume (K Tons) Forecast, by Application 2019 & 2032
- Table 51: Rest of Asia-Pacific Tackifiers for Adhesives Industry Revenue (Million) Forecast, by Application 2019 & 2032
- Table 52: Rest of Asia-Pacific Tackifiers for Adhesives Industry Volume (K Tons) Forecast, by Application 2019 & 2032
- Table 53: Global Tackifiers for Adhesives Industry Revenue Million Forecast, by Country 2019 & 2032
- Table 54: Global Tackifiers for Adhesives Industry Volume K Tons Forecast, by Country 2019 & 2032
- Table 55: Brazil Tackifiers for Adhesives Industry Revenue (Million) Forecast, by Application 2019 & 2032
- Table 56: Brazil Tackifiers for Adhesives Industry Volume (K Tons) Forecast, by Application 2019 & 2032
- Table 57: Argentina Tackifiers for Adhesives Industry Revenue (Million) Forecast, by Application 2019 & 2032
- Table 58: Argentina Tackifiers for Adhesives Industry Volume (K Tons) Forecast, by Application 2019 & 2032
- Table 59: Rest of South America Tackifiers for Adhesives Industry Revenue (Million) Forecast, by Application 2019 & 2032
- Table 60: Rest of South America Tackifiers for Adhesives Industry Volume (K Tons) Forecast, by Application 2019 & 2032
- Table 61: Global Tackifiers for Adhesives Industry Revenue Million Forecast, by Country 2019 & 2032
- Table 62: Global Tackifiers for Adhesives Industry Volume K Tons Forecast, by Country 2019 & 2032
- Table 63: Middle East Tackifiers for Adhesives Industry Revenue (Million) Forecast, by Application 2019 & 2032
- Table 64: Middle East Tackifiers for Adhesives Industry Volume (K Tons) Forecast, by Application 2019 & 2032
- Table 65: Africa Tackifiers for Adhesives Industry Revenue (Million) Forecast, by Application 2019 & 2032
- Table 66: Africa Tackifiers for Adhesives Industry Volume (K Tons) Forecast, by Application 2019 & 2032
- Table 67: Global Tackifiers for Adhesives Industry Revenue Million Forecast, by Feedstock 2019 & 2032
- Table 68: Global Tackifiers for Adhesives Industry Volume K Tons Forecast, by Feedstock 2019 & 2032
- Table 69: Global Tackifiers for Adhesives Industry Revenue Million Forecast, by Form 2019 & 2032
- Table 70: Global Tackifiers for Adhesives Industry Volume K Tons Forecast, by Form 2019 & 2032
- Table 71: Global Tackifiers for Adhesives Industry Revenue Million Forecast, by Type 2019 & 2032
- Table 72: Global Tackifiers for Adhesives Industry Volume K Tons Forecast, by Type 2019 & 2032
- Table 73: Global Tackifiers for Adhesives Industry Revenue Million Forecast, by Application 2019 & 2032
- Table 74: Global Tackifiers for Adhesives Industry Volume K Tons Forecast, by Application 2019 & 2032
- Table 75: Global Tackifiers for Adhesives Industry Revenue Million Forecast, by End-user Industry 2019 & 2032
- Table 76: Global Tackifiers for Adhesives Industry Volume K Tons Forecast, by End-user Industry 2019 & 2032
- Table 77: Global Tackifiers for Adhesives Industry Revenue Million Forecast, by Country 2019 & 2032
- Table 78: Global Tackifiers for Adhesives Industry Volume K Tons Forecast, by Country 2019 & 2032
- Table 79: China Tackifiers for Adhesives Industry Revenue (Million) Forecast, by Application 2019 & 2032
- Table 80: China Tackifiers for Adhesives Industry Volume (K Tons) Forecast, by Application 2019 & 2032
- Table 81: India Tackifiers for Adhesives Industry Revenue (Million) Forecast, by Application 2019 & 2032
- Table 82: India Tackifiers for Adhesives Industry Volume (K Tons) Forecast, by Application 2019 & 2032
- Table 83: Japan Tackifiers for Adhesives Industry Revenue (Million) Forecast, by Application 2019 & 2032
- Table 84: Japan Tackifiers for Adhesives Industry Volume (K Tons) Forecast, by Application 2019 & 2032
- Table 85: South Korea Tackifiers for Adhesives Industry Revenue (Million) Forecast, by Application 2019 & 2032
- Table 86: South Korea Tackifiers for Adhesives Industry Volume (K Tons) Forecast, by Application 2019 & 2032
- Table 87: Rest of Asia Pacific Tackifiers for Adhesives Industry Revenue (Million) Forecast, by Application 2019 & 2032
- Table 88: Rest of Asia Pacific Tackifiers for Adhesives Industry Volume (K Tons) Forecast, by Application 2019 & 2032
- Table 89: Global Tackifiers for Adhesives Industry Revenue Million Forecast, by Feedstock 2019 & 2032
- Table 90: Global Tackifiers for Adhesives Industry Volume K Tons Forecast, by Feedstock 2019 & 2032
- Table 91: Global Tackifiers for Adhesives Industry Revenue Million Forecast, by Form 2019 & 2032
- Table 92: Global Tackifiers for Adhesives Industry Volume K Tons Forecast, by Form 2019 & 2032
- Table 93: Global Tackifiers for Adhesives Industry Revenue Million Forecast, by Type 2019 & 2032
- Table 94: Global Tackifiers for Adhesives Industry Volume K Tons Forecast, by Type 2019 & 2032
- Table 95: Global Tackifiers for Adhesives Industry Revenue Million Forecast, by Application 2019 & 2032
- Table 96: Global Tackifiers for Adhesives Industry Volume K Tons Forecast, by Application 2019 & 2032
- Table 97: Global Tackifiers for Adhesives Industry Revenue Million Forecast, by End-user Industry 2019 & 2032
- Table 98: Global Tackifiers for Adhesives Industry Volume K Tons Forecast, by End-user Industry 2019 & 2032
- Table 99: Global Tackifiers for Adhesives Industry Revenue Million Forecast, by Country 2019 & 2032
- Table 100: Global Tackifiers for Adhesives Industry Volume K Tons Forecast, by Country 2019 & 2032
- Table 101: United States Tackifiers for Adhesives Industry Revenue (Million) Forecast, by Application 2019 & 2032
- Table 102: United States Tackifiers for Adhesives Industry Volume (K Tons) Forecast, by Application 2019 & 2032
- Table 103: Canada Tackifiers for Adhesives Industry Revenue (Million) Forecast, by Application 2019 & 2032
- Table 104: Canada Tackifiers for Adhesives Industry Volume (K Tons) Forecast, by Application 2019 & 2032
- Table 105: Mexico Tackifiers for Adhesives Industry Revenue (Million) Forecast, by Application 2019 & 2032
- Table 106: Mexico Tackifiers for Adhesives Industry Volume (K Tons) Forecast, by Application 2019 & 2032
- Table 107: Global Tackifiers for Adhesives Industry Revenue Million Forecast, by Feedstock 2019 & 2032
- Table 108: Global Tackifiers for Adhesives Industry Volume K Tons Forecast, by Feedstock 2019 & 2032
- Table 109: Global Tackifiers for Adhesives Industry Revenue Million Forecast, by Form 2019 & 2032
- Table 110: Global Tackifiers for Adhesives Industry Volume K Tons Forecast, by Form 2019 & 2032
- Table 111: Global Tackifiers for Adhesives Industry Revenue Million Forecast, by Type 2019 & 2032
- Table 112: Global Tackifiers for Adhesives Industry Volume K Tons Forecast, by Type 2019 & 2032
- Table 113: Global Tackifiers for Adhesives Industry Revenue Million Forecast, by Application 2019 & 2032
- Table 114: Global Tackifiers for Adhesives Industry Volume K Tons Forecast, by Application 2019 & 2032
- Table 115: Global Tackifiers for Adhesives Industry Revenue Million Forecast, by End-user Industry 2019 & 2032
- Table 116: Global Tackifiers for Adhesives Industry Volume K Tons Forecast, by End-user Industry 2019 & 2032
- Table 117: Global Tackifiers for Adhesives Industry Revenue Million Forecast, by Country 2019 & 2032
- Table 118: Global Tackifiers for Adhesives Industry Volume K Tons Forecast, by Country 2019 & 2032
- Table 119: Germany Tackifiers for Adhesives Industry Revenue (Million) Forecast, by Application 2019 & 2032
- Table 120: Germany Tackifiers for Adhesives Industry Volume (K Tons) Forecast, by Application 2019 & 2032
- Table 121: United Kingdom Tackifiers for Adhesives Industry Revenue (Million) Forecast, by Application 2019 & 2032
- Table 122: United Kingdom Tackifiers for Adhesives Industry Volume (K Tons) Forecast, by Application 2019 & 2032
- Table 123: France Tackifiers for Adhesives Industry Revenue (Million) Forecast, by Application 2019 & 2032
- Table 124: France Tackifiers for Adhesives Industry Volume (K Tons) Forecast, by Application 2019 & 2032
- Table 125: Italy Tackifiers for Adhesives Industry Revenue (Million) Forecast, by Application 2019 & 2032
- Table 126: Italy Tackifiers for Adhesives Industry Volume (K Tons) Forecast, by Application 2019 & 2032
- Table 127: Rest of Europe Tackifiers for Adhesives Industry Revenue (Million) Forecast, by Application 2019 & 2032
- Table 128: Rest of Europe Tackifiers for Adhesives Industry Volume (K Tons) Forecast, by Application 2019 & 2032
- Table 129: Global Tackifiers for Adhesives Industry Revenue Million Forecast, by Feedstock 2019 & 2032
- Table 130: Global Tackifiers for Adhesives Industry Volume K Tons Forecast, by Feedstock 2019 & 2032
- Table 131: Global Tackifiers for Adhesives Industry Revenue Million Forecast, by Form 2019 & 2032
- Table 132: Global Tackifiers for Adhesives Industry Volume K Tons Forecast, by Form 2019 & 2032
- Table 133: Global Tackifiers for Adhesives Industry Revenue Million Forecast, by Type 2019 & 2032
- Table 134: Global Tackifiers for Adhesives Industry Volume K Tons Forecast, by Type 2019 & 2032
- Table 135: Global Tackifiers for Adhesives Industry Revenue Million Forecast, by Application 2019 & 2032
- Table 136: Global Tackifiers for Adhesives Industry Volume K Tons Forecast, by Application 2019 & 2032
- Table 137: Global Tackifiers for Adhesives Industry Revenue Million Forecast, by End-user Industry 2019 & 2032
- Table 138: Global Tackifiers for Adhesives Industry Volume K Tons Forecast, by End-user Industry 2019 & 2032
- Table 139: Global Tackifiers for Adhesives Industry Revenue Million Forecast, by Country 2019 & 2032
- Table 140: Global Tackifiers for Adhesives Industry Volume K Tons Forecast, by Country 2019 & 2032
- Table 141: Brazil Tackifiers for Adhesives Industry Revenue (Million) Forecast, by Application 2019 & 2032
- Table 142: Brazil Tackifiers for Adhesives Industry Volume (K Tons) Forecast, by Application 2019 & 2032
- Table 143: Argentina Tackifiers for Adhesives Industry Revenue (Million) Forecast, by Application 2019 & 2032
- Table 144: Argentina Tackifiers for Adhesives Industry Volume (K Tons) Forecast, by Application 2019 & 2032
- Table 145: Rest of South America Tackifiers for Adhesives Industry Revenue (Million) Forecast, by Application 2019 & 2032
- Table 146: Rest of South America Tackifiers for Adhesives Industry Volume (K Tons) Forecast, by Application 2019 & 2032
- Table 147: Global Tackifiers for Adhesives Industry Revenue Million Forecast, by Feedstock 2019 & 2032
- Table 148: Global Tackifiers for Adhesives Industry Volume K Tons Forecast, by Feedstock 2019 & 2032
- Table 149: Global Tackifiers for Adhesives Industry Revenue Million Forecast, by Form 2019 & 2032
- Table 150: Global Tackifiers for Adhesives Industry Volume K Tons Forecast, by Form 2019 & 2032
- Table 151: Global Tackifiers for Adhesives Industry Revenue Million Forecast, by Type 2019 & 2032
- Table 152: Global Tackifiers for Adhesives Industry Volume K Tons Forecast, by Type 2019 & 2032
- Table 153: Global Tackifiers for Adhesives Industry Revenue Million Forecast, by Application 2019 & 2032
- Table 154: Global Tackifiers for Adhesives Industry Volume K Tons Forecast, by Application 2019 & 2032
- Table 155: Global Tackifiers for Adhesives Industry Revenue Million Forecast, by End-user Industry 2019 & 2032
- Table 156: Global Tackifiers for Adhesives Industry Volume K Tons Forecast, by End-user Industry 2019 & 2032
- Table 157: Global Tackifiers for Adhesives Industry Revenue Million Forecast, by Country 2019 & 2032
- Table 158: Global Tackifiers for Adhesives Industry Volume K Tons Forecast, by Country 2019 & 2032
- Table 159: Saudi Arabia Tackifiers for Adhesives Industry Revenue (Million) Forecast, by Application 2019 & 2032
- Table 160: Saudi Arabia Tackifiers for Adhesives Industry Volume (K Tons) Forecast, by Application 2019 & 2032
- Table 161: South Africa Tackifiers for Adhesives Industry Revenue (Million) Forecast, by Application 2019 & 2032
- Table 162: South Africa Tackifiers for Adhesives Industry Volume (K Tons) Forecast, by Application 2019 & 2032
- Table 163: Rest of Middle East and Africa Tackifiers for Adhesives Industry Revenue (Million) Forecast, by Application 2019 & 2032
- Table 164: Rest of Middle East and Africa Tackifiers for Adhesives Industry Volume (K Tons) Forecast, by Application 2019 & 2032
Frequently Asked Questions
1. What is the projected Compound Annual Growth Rate (CAGR) of the Tackifiers for Adhesives Industry?
The projected CAGR is approximately > 3.50%.
2. Which companies are prominent players in the Tackifiers for Adhesives Industry?
Key companies in the market include DRT (Les Derives Resiniques et Terpeniques), Arkema, Exxon Mobil Corporation, TECKREZ INC, Eastman Chemical Company, Neville Chemicals Company, Lawter A Harima Chemicals Inc Company, Arakawa Chemical IndustriesLtd, KRATON CORPORATION, Natrochem Inc, TWC Group.
3. What are the main segments of the Tackifiers for Adhesives Industry?
The market segments include Feedstock, Form, Type, Application, End-user Industry.
4. Can you provide details about the market size?
The market size is estimated to be USD 554.37 Million as of 2022.
5. What are some drivers contributing to market growth?
Growing Urban Infrastructure in Developing Countries; Growing Demand for Hot-melt Adhesives in Asia-Pacific; Other Drivers.
6. What are the notable trends driving market growth?
Building and Construction Industry to Dominate the Market.
7. Are there any restraints impacting market growth?
Emerging Tackifier Free Adhesives Market; Other Restraints.
8. Can you provide examples of recent developments in the market?
October 2023: Lawter introduced Snowtack HS80, its new novel 66% high solids grade water-borne resin tackifier dispersion. It is designed for labeling and taping water-based pressure-sensitive adhesives.
9. What pricing options are available for accessing the report?
Pricing options include single-user, multi-user, and enterprise licenses priced at USD 4750, USD 5250, and USD 8750 respectively.
10. Is the market size provided in terms of value or volume?
The market size is provided in terms of value, measured in Million and volume, measured in K Tons.
11. Are there any specific market keywords associated with the report?
Yes, the market keyword associated with the report is "Tackifiers for Adhesives Industry," which aids in identifying and referencing the specific market segment covered.
12. How do I determine which pricing option suits my needs best?
The pricing options vary based on user requirements and access needs. Individual users may opt for single-user licenses, while businesses requiring broader access may choose multi-user or enterprise licenses for cost-effective access to the report.
13. Are there any additional resources or data provided in the Tackifiers for Adhesives Industry report?
While the report offers comprehensive insights, it's advisable to review the specific contents or supplementary materials provided to ascertain if additional resources or data are available.
14. How can I stay updated on further developments or reports in the Tackifiers for Adhesives Industry?
To stay informed about further developments, trends, and reports in the Tackifiers for Adhesives Industry, consider subscribing to industry newsletters, following relevant companies and organizations, or regularly checking reputable industry news sources and publications.
Methodology
Step 1 - Identification of Relevant Samples Size from Population Database


Step 2 - Approaches for Defining Global Market Size (Value, Volume* & Price*)

Note*: In applicable scenarios
Step 3 - Data Sources
Primary Research
- Web Analytics
- Survey Reports
- Research Institute
- Latest Research Reports
- Opinion Leaders
Secondary Research
- Annual Reports
- White Paper
- Latest Press Release
- Industry Association
- Paid Database
- Investor Presentations

Step 4 - Data Triangulation
Involves using different sources of information in order to increase the validity of a study
These sources are likely to be stakeholders in a program - participants, other researchers, program staff, other community members, and so on.
Then we put all data in single framework & apply various statistical tools to find out the dynamic on the market.
During the analysis stage, feedback from the stakeholder groups would be compared to determine areas of agreement as well as areas of divergence


