
Key Insights
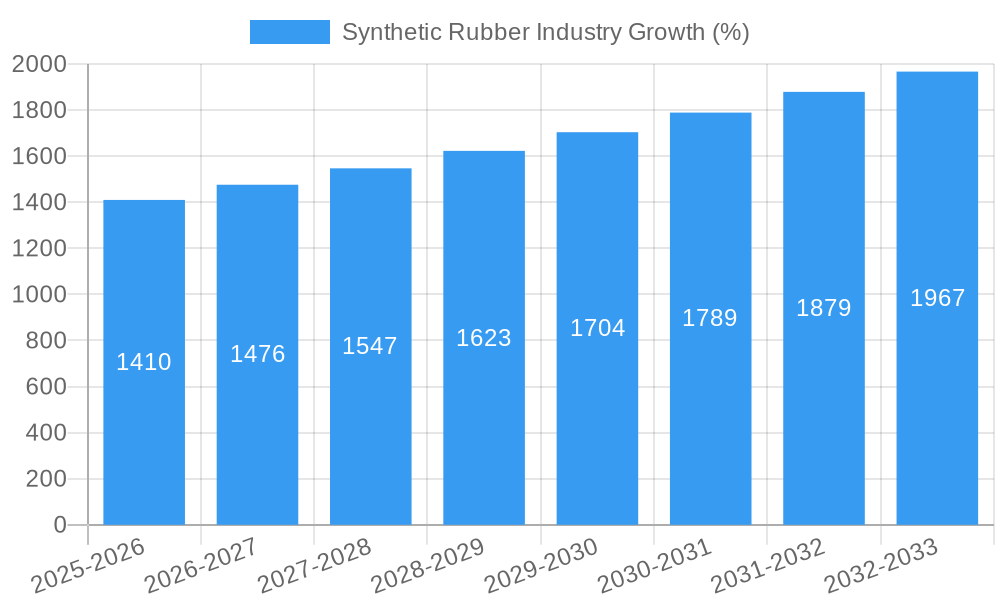
The global synthetic rubber market, valued at $33.48 billion in 2025, is projected to experience robust growth, driven by a compound annual growth rate (CAGR) of 4.21% from 2025 to 2033. This expansion is fueled by several key factors. The automotive industry, a major consumer of synthetic rubber in tire and non-tire applications, is experiencing consistent growth globally, particularly in developing economies. Increased demand for high-performance tires, featuring enhanced durability and fuel efficiency, further boosts the market. The burgeoning footwear industry, utilizing synthetic rubbers for sole manufacturing, contributes significantly to market demand. Furthermore, the rising adoption of synthetic rubber in various industrial goods, such as hoses, belts, and seals, contributes to overall market expansion. Growth is also expected to be influenced by innovations in synthetic rubber formulations, leading to enhanced product properties like improved elasticity, strength, and chemical resistance, opening new application possibilities.
However, the market faces certain challenges. Fluctuations in raw material prices, particularly those of petroleum-based feedstocks, can impact profitability. Stringent environmental regulations regarding the manufacturing and disposal of synthetic rubbers present another constraint. Competitive pressures from natural rubber alternatives, particularly in certain applications, also need consideration. Despite these challenges, the ongoing advancements in material science and the increasing demand from key sectors suggest a positive outlook for the synthetic rubber market over the forecast period. Strategic partnerships, technological advancements focused on sustainable production, and geographical expansion into emerging markets will be crucial for companies to maintain a competitive edge and capitalize on future market opportunities. The segment analysis suggests that styrene butadiene rubber (SBR) and EPDM currently dominate the market in terms of volume, with steady growth expected across all types. Geographically, the Asia-Pacific region, driven by strong growth in China and India, is likely to remain the largest market, followed by North America and Europe.

Synthetic Rubber Industry Market Report: 2019-2033
This comprehensive report provides an in-depth analysis of the global synthetic rubber industry, encompassing market dynamics, growth trends, regional landscapes, product innovations, and key players. With a focus on the period 2019-2033, including a base year of 2025 and a forecast period of 2025-2033, this report is an essential resource for industry professionals, investors, and researchers seeking to understand and navigate this dynamic market. The report covers key segments including Styrene Butadiene Rubber (SBR), Ethylene Propylene Diene Rubber (EPDM), Polyisoprene (IR), Polybutadiene Rubber (BR), Isobutylene Isoprene Rubber (IIR), and other types, across applications in Tires & Tire Components, Non-Tire Automobile Applications, Footwear, Industrial Goods, and Other Applications. Major players analyzed include Versalis S.p.A., Goodyear, Synthos, Sinopec, ExxonMobil, Mitsubishi Chemical, Reliance Industries, ENEOS, LANXESS, SIBUR, SABIC, LG Chem, Aramco, Dow, Apcotex, Kumho Petrochemical, and TSRC.
Synthetic Rubber Industry Market Dynamics & Structure
This section analyzes the competitive landscape of the synthetic rubber market, examining market concentration, technological advancements, regulatory frameworks, and the influence of substitute products. The report explores the changing end-user demographics and the impact of mergers and acquisitions (M&A) activities. Quantitative data on market share percentages and M&A deal volumes is included, alongside qualitative analysis of innovation barriers and competitive pressures.
- Market Concentration: Analysis of market share distribution among leading players, revealing the degree of competition and potential for consolidation. (xx% market share held by top 5 players in 2024)
- Technological Innovation: Examination of R&D investments, emerging technologies (e.g., eco-friendly rubbers), and their impact on market dynamics.
- Regulatory Landscape: Assessment of environmental regulations, safety standards, and their influence on production processes and material selection.
- Substitute Products: Evaluation of competing materials and their impact on synthetic rubber demand.
- End-User Demographics: Analysis of shifts in end-user demand across key application segments (e.g., automotive, footwear).
- M&A Activity: Review of recent mergers, acquisitions, and joint ventures, analyzing their implications for market consolidation and technological advancements. (xx M&A deals in the last 5 years, totaling xx million USD)
Synthetic Rubber Industry Growth Trends & Insights
This section provides a detailed analysis of the synthetic rubber market's size evolution, adoption rates, and impact of technological disruptions. The analysis uses comprehensive data to calculate the Compound Annual Growth Rate (CAGR) and market penetration rates, highlighting consumer behavior shifts and their effect on market demand. The section leverages detailed market sizing and forecasting data to provide a comprehensive view of market evolution and future potential.
Market size evolution from 2019-2024 (in million USD): xx, xx, xx, xx, xx, xx
- Projected market size from 2025-2033 (in million USD): xx, xx, xx, xx, xx, xx, xx, xx, xx
- CAGR for the forecast period: xx%
- Market penetration rate in key application segments:
Dominant Regions, Countries, or Segments in Synthetic Rubber Industry
This section identifies leading regions, countries, and segments within the synthetic rubber market driving overall growth. It analyzes market share, growth potential, and key factors contributing to dominance, such as economic policies, infrastructure development, and government incentives.
- Leading Regions: (e.g., Asia Pacific, North America, Europe) - Analysis of market share and growth drivers in each region. (Asia Pacific holding xx% of the market in 2024)
- Leading Countries: (e.g., China, USA, Japan, South Korea) – Detailed analysis of individual country performance and contributing factors. (China accounting for xx million USD in 2024)
- Leading Segments by Type: Analysis of growth rates and market share for SBR, EPDM, IR, BR, IIR, and other types. (SBR holding xx% of the market in 2024)
- Leading Segments by Application: Analysis of growth rates and market share for tires, non-tire automotive applications, footwear, industrial goods and other applications. (Tire and tire components holding xx% of the market in 2024)
Synthetic Rubber Industry Product Landscape
This section offers a concise overview of product innovations, applications, and key performance indicators within the synthetic rubber industry. It highlights unique selling propositions, technological advancements, and the evolution of product features to meet evolving market demands.
The synthetic rubber market showcases continuous product development with enhanced material properties such as improved durability, elasticity, and resistance to extreme conditions. The key focus areas include eco-friendly solutions, high-performance specialty rubbers tailored to specific application requirements, and advancements in manufacturing processes to improve efficiency and reduce costs.
Key Drivers, Barriers & Challenges in Synthetic Rubber Industry
This section analyzes the key factors driving market growth and the challenges hindering its expansion.
Key Drivers:
- Increasing demand from the automotive industry, particularly for tires and non-tire applications.
- Growth in the construction and infrastructure sectors driving demand for industrial rubber goods.
- Expanding footwear market boosting demand for synthetic rubbers.
- Advancements in synthetic rubber technology leading to improved material properties.
Key Challenges:
- Fluctuations in raw material prices impacting production costs.
- Stringent environmental regulations increasing compliance costs.
- Intense competition among existing and emerging players.
- Supply chain disruptions affecting production and delivery. (Estimated xx% impact on production in 2024 due to supply chain issues)
Emerging Opportunities in Synthetic Rubber Industry
This section explores potential areas of growth and innovation within the synthetic rubber industry.
- Development of sustainable and eco-friendly synthetic rubbers.
- Expanding applications in renewable energy and emerging technologies.
- Penetration into niche markets with specialized rubber products.
- Adoption of advanced manufacturing technologies to enhance efficiency and reduce costs.
Growth Accelerators in the Synthetic Rubber Industry
Long-term growth in the synthetic rubber industry is fueled by technological advancements such as the development of eco-friendly solutions and high-performance materials. Strategic partnerships and collaborations between industry players further propel market expansion. The development of innovative applications and exploration of untapped markets, especially in developing economies, also contribute significantly to sustained growth.
Key Players Shaping the Synthetic Rubber Industry Market
- Versalis S.p.A.
- The Goodyear Tire & Rubber Company
- Synthos
- China Petrochemical Corporation (Sinopec)
- Exxon Mobil Corporation
- Mitsubishi Chemical Corporation
- Reliance Industries Limited
- ENEOS Corporation
- LANXESS
- SIBUR
- SABIC
- LG Chem
- Saudi Arabian Oil Co (Aramco)
- Dow
- Apcotex
- Kumho Petrochemical
- TSRC
Notable Milestones in Synthetic Rubber Industry Sector
- December 2023: SIBUR's Nizhnekamskneftekhim upgraded its halobutyl rubber (HBR) capacity from 150 to 200 kilotons (USD 85.5 million investment).
- May 2023: Arlanxeo plans a new rubber production plant in Jubail, Saudi Arabia (140,000 metric tons annual capacity), part of the USD 11 billion Amiral complex.
- May 2023: Hankook Tire and Kumho Petrochemical collaborated on eco-friendly tires using eco-SSBR.
- April 2023: Sinopec launched a new SBC production facility in Hainan, China (170,000 tons annual capacity).
- March 2023: Aramco completed its USD 2.65 billion acquisition of Valvoline Inc.
- December 2022: Kumho Petrochemical planned to expand its SSBR capacity to 123 kilotons per annum.
In-Depth Synthetic Rubber Industry Market Outlook
The synthetic rubber market is poised for robust growth driven by the automotive industry's expansion, particularly in emerging economies. Technological advancements, such as the development of sustainable and high-performance materials, will continue to shape market dynamics. Strategic partnerships and collaborations focused on innovation and market expansion will play a significant role in shaping the future of this dynamic industry. The expanding applications of synthetic rubber in various sectors presents significant opportunities for market players to capitalize on.
Synthetic Rubber Industry Segmentation
-
1. Type
- 1.1. Styrene Butadiene Rubber (SBR)
- 1.2. Ethylene Propylenediene Rubber (EPDM)
- 1.3. Polyisoprene (IR)
- 1.4. Polybutadiene Rubber (BR)
- 1.5. Isobutylene Isoprene Rubber (IIR)
- 1.6. Other Types
-
2. Application
- 2.1. Tire and Tire Components
- 2.2. Non-tire Automobile Applications
- 2.3. Footwear
- 2.4. Industrial Goods
- 2.5. Other Applications
Synthetic Rubber Industry Segmentation By Geography
-
1. Asia Pacific
- 1.1. China
- 1.2. India
- 1.3. Japan
- 1.4. South Korea
- 1.5. Malaysia
- 1.6. Thailand
- 1.7. Vietnam
- 1.8. Indonesia
- 1.9. Rest of Asia Pacific
-
2. North America
- 2.1. United States
- 2.2. Canada
- 2.3. Mexico
-
3. Europe
- 3.1. Germany
- 3.2. United Kingdom
- 3.3. France
- 3.4. Italy
- 3.5. Spain
- 3.6. Russia
- 3.7. NORDIC
- 3.8. Turkey
- 3.9. Rest of Europe
-
4. South America
- 4.1. Brazil
- 4.2. Argentina
- 4.3. Colombia
- 4.4. Rest of South America
-
5. Middle East and Africa
- 5.1. Saudi Arabia
- 5.2. South Africa
- 5.3. United Arab Emirates
- 5.4. Nigeria
- 5.5. Qatar
- 5.6. Egypt
- 5.7. Rest of Middle East and Africa

Synthetic Rubber Industry REPORT HIGHLIGHTS
| Aspects | Details |
|---|---|
| Study Period | 2019-2033 |
| Base Year | 2024 |
| Estimated Year | 2025 |
| Forecast Period | 2025-2033 |
| Historical Period | 2019-2024 |
| Growth Rate | CAGR of 4.21% from 2019-2033 |
| Segmentation |
|
Table of Contents
- 1. Introduction
- 1.1. Research Scope
- 1.2. Market Segmentation
- 1.3. Research Methodology
- 1.4. Definitions and Assumptions
- 2. Executive Summary
- 2.1. Introduction
- 3. Market Dynamics
- 3.1. Introduction
- 3.2. Market Drivers
- 3.2.1. Increasing Demand from Rising Sales of Electric Vehicles; Other Drivers
- 3.3. Market Restrains
- 3.3.1. Replacement of Rubber by Polyurethanes in Some Applications; Other Restraints
- 3.4. Market Trends
- 3.4.1. Increasing Demand From Tire and Tire Components
- 4. Market Factor Analysis
- 4.1. Porters Five Forces
- 4.2. Supply/Value Chain
- 4.3. PESTEL analysis
- 4.4. Market Entropy
- 4.5. Patent/Trademark Analysis
- 5. Global Synthetic Rubber Industry Analysis, Insights and Forecast, 2019-2031
- 5.1. Market Analysis, Insights and Forecast - by Type
- 5.1.1. Styrene Butadiene Rubber (SBR)
- 5.1.2. Ethylene Propylenediene Rubber (EPDM)
- 5.1.3. Polyisoprene (IR)
- 5.1.4. Polybutadiene Rubber (BR)
- 5.1.5. Isobutylene Isoprene Rubber (IIR)
- 5.1.6. Other Types
- 5.2. Market Analysis, Insights and Forecast - by Application
- 5.2.1. Tire and Tire Components
- 5.2.2. Non-tire Automobile Applications
- 5.2.3. Footwear
- 5.2.4. Industrial Goods
- 5.2.5. Other Applications
- 5.3. Market Analysis, Insights and Forecast - by Region
- 5.3.1. Asia Pacific
- 5.3.2. North America
- 5.3.3. Europe
- 5.3.4. South America
- 5.3.5. Middle East and Africa
- 5.1. Market Analysis, Insights and Forecast - by Type
- 6. Asia Pacific Synthetic Rubber Industry Analysis, Insights and Forecast, 2019-2031
- 6.1. Market Analysis, Insights and Forecast - by Type
- 6.1.1. Styrene Butadiene Rubber (SBR)
- 6.1.2. Ethylene Propylenediene Rubber (EPDM)
- 6.1.3. Polyisoprene (IR)
- 6.1.4. Polybutadiene Rubber (BR)
- 6.1.5. Isobutylene Isoprene Rubber (IIR)
- 6.1.6. Other Types
- 6.2. Market Analysis, Insights and Forecast - by Application
- 6.2.1. Tire and Tire Components
- 6.2.2. Non-tire Automobile Applications
- 6.2.3. Footwear
- 6.2.4. Industrial Goods
- 6.2.5. Other Applications
- 6.1. Market Analysis, Insights and Forecast - by Type
- 7. North America Synthetic Rubber Industry Analysis, Insights and Forecast, 2019-2031
- 7.1. Market Analysis, Insights and Forecast - by Type
- 7.1.1. Styrene Butadiene Rubber (SBR)
- 7.1.2. Ethylene Propylenediene Rubber (EPDM)
- 7.1.3. Polyisoprene (IR)
- 7.1.4. Polybutadiene Rubber (BR)
- 7.1.5. Isobutylene Isoprene Rubber (IIR)
- 7.1.6. Other Types
- 7.2. Market Analysis, Insights and Forecast - by Application
- 7.2.1. Tire and Tire Components
- 7.2.2. Non-tire Automobile Applications
- 7.2.3. Footwear
- 7.2.4. Industrial Goods
- 7.2.5. Other Applications
- 7.1. Market Analysis, Insights and Forecast - by Type
- 8. Europe Synthetic Rubber Industry Analysis, Insights and Forecast, 2019-2031
- 8.1. Market Analysis, Insights and Forecast - by Type
- 8.1.1. Styrene Butadiene Rubber (SBR)
- 8.1.2. Ethylene Propylenediene Rubber (EPDM)
- 8.1.3. Polyisoprene (IR)
- 8.1.4. Polybutadiene Rubber (BR)
- 8.1.5. Isobutylene Isoprene Rubber (IIR)
- 8.1.6. Other Types
- 8.2. Market Analysis, Insights and Forecast - by Application
- 8.2.1. Tire and Tire Components
- 8.2.2. Non-tire Automobile Applications
- 8.2.3. Footwear
- 8.2.4. Industrial Goods
- 8.2.5. Other Applications
- 8.1. Market Analysis, Insights and Forecast - by Type
- 9. South America Synthetic Rubber Industry Analysis, Insights and Forecast, 2019-2031
- 9.1. Market Analysis, Insights and Forecast - by Type
- 9.1.1. Styrene Butadiene Rubber (SBR)
- 9.1.2. Ethylene Propylenediene Rubber (EPDM)
- 9.1.3. Polyisoprene (IR)
- 9.1.4. Polybutadiene Rubber (BR)
- 9.1.5. Isobutylene Isoprene Rubber (IIR)
- 9.1.6. Other Types
- 9.2. Market Analysis, Insights and Forecast - by Application
- 9.2.1. Tire and Tire Components
- 9.2.2. Non-tire Automobile Applications
- 9.2.3. Footwear
- 9.2.4. Industrial Goods
- 9.2.5. Other Applications
- 9.1. Market Analysis, Insights and Forecast - by Type
- 10. Middle East and Africa Synthetic Rubber Industry Analysis, Insights and Forecast, 2019-2031
- 10.1. Market Analysis, Insights and Forecast - by Type
- 10.1.1. Styrene Butadiene Rubber (SBR)
- 10.1.2. Ethylene Propylenediene Rubber (EPDM)
- 10.1.3. Polyisoprene (IR)
- 10.1.4. Polybutadiene Rubber (BR)
- 10.1.5. Isobutylene Isoprene Rubber (IIR)
- 10.1.6. Other Types
- 10.2. Market Analysis, Insights and Forecast - by Application
- 10.2.1. Tire and Tire Components
- 10.2.2. Non-tire Automobile Applications
- 10.2.3. Footwear
- 10.2.4. Industrial Goods
- 10.2.5. Other Applications
- 10.1. Market Analysis, Insights and Forecast - by Type
- 11. North America Synthetic Rubber Industry Analysis, Insights and Forecast, 2019-2031
- 11.1. Market Analysis, Insights and Forecast - By Country/Sub-region
- 11.1.1 United States
- 11.1.2 Canada
- 11.1.3 Mexico
- 12. Europe Synthetic Rubber Industry Analysis, Insights and Forecast, 2019-2031
- 12.1. Market Analysis, Insights and Forecast - By Country/Sub-region
- 12.1.1 Germany
- 12.1.2 France
- 12.1.3 Italy
- 12.1.4 United Kingdom
- 12.1.5 Netherlands
- 12.1.6 Rest of Europe
- 13. Asia Pacific Synthetic Rubber Industry Analysis, Insights and Forecast, 2019-2031
- 13.1. Market Analysis, Insights and Forecast - By Country/Sub-region
- 13.1.1 China
- 13.1.2 Japan
- 13.1.3 India
- 13.1.4 South Korea
- 13.1.5 Taiwan
- 13.1.6 Australia
- 13.1.7 Rest of Asia-Pacific
- 14. South America Synthetic Rubber Industry Analysis, Insights and Forecast, 2019-2031
- 14.1. Market Analysis, Insights and Forecast - By Country/Sub-region
- 14.1.1 Brazil
- 14.1.2 Argentina
- 14.1.3 Rest of South America
- 15. MEA Synthetic Rubber Industry Analysis, Insights and Forecast, 2019-2031
- 15.1. Market Analysis, Insights and Forecast - By Country/Sub-region
- 15.1.1 Middle East
- 15.1.2 Africa
- 16. Competitive Analysis
- 16.1. Global Market Share Analysis 2024
- 16.2. Company Profiles
- 16.2.1 Versalis S p A
- 16.2.1.1. Overview
- 16.2.1.2. Products
- 16.2.1.3. SWOT Analysis
- 16.2.1.4. Recent Developments
- 16.2.1.5. Financials (Based on Availability)
- 16.2.2 The Goodyear Tire & Rubber Company
- 16.2.2.1. Overview
- 16.2.2.2. Products
- 16.2.2.3. SWOT Analysis
- 16.2.2.4. Recent Developments
- 16.2.2.5. Financials (Based on Availability)
- 16.2.3 Synthos
- 16.2.3.1. Overview
- 16.2.3.2. Products
- 16.2.3.3. SWOT Analysis
- 16.2.3.4. Recent Developments
- 16.2.3.5. Financials (Based on Availability)
- 16.2.4 China Petrochemical Corporation
- 16.2.4.1. Overview
- 16.2.4.2. Products
- 16.2.4.3. SWOT Analysis
- 16.2.4.4. Recent Developments
- 16.2.4.5. Financials (Based on Availability)
- 16.2.5 Exxon Mobil Corporation
- 16.2.5.1. Overview
- 16.2.5.2. Products
- 16.2.5.3. SWOT Analysis
- 16.2.5.4. Recent Developments
- 16.2.5.5. Financials (Based on Availability)
- 16.2.6 Mitsubishi Chemical Corporation
- 16.2.6.1. Overview
- 16.2.6.2. Products
- 16.2.6.3. SWOT Analysis
- 16.2.6.4. Recent Developments
- 16.2.6.5. Financials (Based on Availability)
- 16.2.7 Reliance Industries Limited
- 16.2.7.1. Overview
- 16.2.7.2. Products
- 16.2.7.3. SWOT Analysis
- 16.2.7.4. Recent Developments
- 16.2.7.5. Financials (Based on Availability)
- 16.2.8 ENEOS Corporation
- 16.2.8.1. Overview
- 16.2.8.2. Products
- 16.2.8.3. SWOT Analysis
- 16.2.8.4. Recent Developments
- 16.2.8.5. Financials (Based on Availability)
- 16.2.9 LANXESS
- 16.2.9.1. Overview
- 16.2.9.2. Products
- 16.2.9.3. SWOT Analysis
- 16.2.9.4. Recent Developments
- 16.2.9.5. Financials (Based on Availability)
- 16.2.10 SIBUR
- 16.2.10.1. Overview
- 16.2.10.2. Products
- 16.2.10.3. SWOT Analysis
- 16.2.10.4. Recent Developments
- 16.2.10.5. Financials (Based on Availability)
- 16.2.11 SABIC
- 16.2.11.1. Overview
- 16.2.11.2. Products
- 16.2.11.3. SWOT Analysis
- 16.2.11.4. Recent Developments
- 16.2.11.5. Financials (Based on Availability)
- 16.2.12 LG Chem
- 16.2.12.1. Overview
- 16.2.12.2. Products
- 16.2.12.3. SWOT Analysis
- 16.2.12.4. Recent Developments
- 16.2.12.5. Financials (Based on Availability)
- 16.2.13 Saudi Arabian Oil Co
- 16.2.13.1. Overview
- 16.2.13.2. Products
- 16.2.13.3. SWOT Analysis
- 16.2.13.4. Recent Developments
- 16.2.13.5. Financials (Based on Availability)
- 16.2.14 Dow
- 16.2.14.1. Overview
- 16.2.14.2. Products
- 16.2.14.3. SWOT Analysis
- 16.2.14.4. Recent Developments
- 16.2.14.5. Financials (Based on Availability)
- 16.2.15 Apcotex
- 16.2.15.1. Overview
- 16.2.15.2. Products
- 16.2.15.3. SWOT Analysis
- 16.2.15.4. Recent Developments
- 16.2.15.5. Financials (Based on Availability)
- 16.2.16 Kumho Petrochemical
- 16.2.16.1. Overview
- 16.2.16.2. Products
- 16.2.16.3. SWOT Analysis
- 16.2.16.4. Recent Developments
- 16.2.16.5. Financials (Based on Availability)
- 16.2.17 TSRC
- 16.2.17.1. Overview
- 16.2.17.2. Products
- 16.2.17.3. SWOT Analysis
- 16.2.17.4. Recent Developments
- 16.2.17.5. Financials (Based on Availability)
- 16.2.1 Versalis S p A
List of Figures
- Figure 1: Global Synthetic Rubber Industry Revenue Breakdown (Million, %) by Region 2024 & 2032
- Figure 2: Global Synthetic Rubber Industry Volume Breakdown (K Tons, %) by Region 2024 & 2032
- Figure 3: North America Synthetic Rubber Industry Revenue (Million), by Country 2024 & 2032
- Figure 4: North America Synthetic Rubber Industry Volume (K Tons), by Country 2024 & 2032
- Figure 5: North America Synthetic Rubber Industry Revenue Share (%), by Country 2024 & 2032
- Figure 6: North America Synthetic Rubber Industry Volume Share (%), by Country 2024 & 2032
- Figure 7: Europe Synthetic Rubber Industry Revenue (Million), by Country 2024 & 2032
- Figure 8: Europe Synthetic Rubber Industry Volume (K Tons), by Country 2024 & 2032
- Figure 9: Europe Synthetic Rubber Industry Revenue Share (%), by Country 2024 & 2032
- Figure 10: Europe Synthetic Rubber Industry Volume Share (%), by Country 2024 & 2032
- Figure 11: Asia Pacific Synthetic Rubber Industry Revenue (Million), by Country 2024 & 2032
- Figure 12: Asia Pacific Synthetic Rubber Industry Volume (K Tons), by Country 2024 & 2032
- Figure 13: Asia Pacific Synthetic Rubber Industry Revenue Share (%), by Country 2024 & 2032
- Figure 14: Asia Pacific Synthetic Rubber Industry Volume Share (%), by Country 2024 & 2032
- Figure 15: South America Synthetic Rubber Industry Revenue (Million), by Country 2024 & 2032
- Figure 16: South America Synthetic Rubber Industry Volume (K Tons), by Country 2024 & 2032
- Figure 17: South America Synthetic Rubber Industry Revenue Share (%), by Country 2024 & 2032
- Figure 18: South America Synthetic Rubber Industry Volume Share (%), by Country 2024 & 2032
- Figure 19: MEA Synthetic Rubber Industry Revenue (Million), by Country 2024 & 2032
- Figure 20: MEA Synthetic Rubber Industry Volume (K Tons), by Country 2024 & 2032
- Figure 21: MEA Synthetic Rubber Industry Revenue Share (%), by Country 2024 & 2032
- Figure 22: MEA Synthetic Rubber Industry Volume Share (%), by Country 2024 & 2032
- Figure 23: Asia Pacific Synthetic Rubber Industry Revenue (Million), by Type 2024 & 2032
- Figure 24: Asia Pacific Synthetic Rubber Industry Volume (K Tons), by Type 2024 & 2032
- Figure 25: Asia Pacific Synthetic Rubber Industry Revenue Share (%), by Type 2024 & 2032
- Figure 26: Asia Pacific Synthetic Rubber Industry Volume Share (%), by Type 2024 & 2032
- Figure 27: Asia Pacific Synthetic Rubber Industry Revenue (Million), by Application 2024 & 2032
- Figure 28: Asia Pacific Synthetic Rubber Industry Volume (K Tons), by Application 2024 & 2032
- Figure 29: Asia Pacific Synthetic Rubber Industry Revenue Share (%), by Application 2024 & 2032
- Figure 30: Asia Pacific Synthetic Rubber Industry Volume Share (%), by Application 2024 & 2032
- Figure 31: Asia Pacific Synthetic Rubber Industry Revenue (Million), by Country 2024 & 2032
- Figure 32: Asia Pacific Synthetic Rubber Industry Volume (K Tons), by Country 2024 & 2032
- Figure 33: Asia Pacific Synthetic Rubber Industry Revenue Share (%), by Country 2024 & 2032
- Figure 34: Asia Pacific Synthetic Rubber Industry Volume Share (%), by Country 2024 & 2032
- Figure 35: North America Synthetic Rubber Industry Revenue (Million), by Type 2024 & 2032
- Figure 36: North America Synthetic Rubber Industry Volume (K Tons), by Type 2024 & 2032
- Figure 37: North America Synthetic Rubber Industry Revenue Share (%), by Type 2024 & 2032
- Figure 38: North America Synthetic Rubber Industry Volume Share (%), by Type 2024 & 2032
- Figure 39: North America Synthetic Rubber Industry Revenue (Million), by Application 2024 & 2032
- Figure 40: North America Synthetic Rubber Industry Volume (K Tons), by Application 2024 & 2032
- Figure 41: North America Synthetic Rubber Industry Revenue Share (%), by Application 2024 & 2032
- Figure 42: North America Synthetic Rubber Industry Volume Share (%), by Application 2024 & 2032
- Figure 43: North America Synthetic Rubber Industry Revenue (Million), by Country 2024 & 2032
- Figure 44: North America Synthetic Rubber Industry Volume (K Tons), by Country 2024 & 2032
- Figure 45: North America Synthetic Rubber Industry Revenue Share (%), by Country 2024 & 2032
- Figure 46: North America Synthetic Rubber Industry Volume Share (%), by Country 2024 & 2032
- Figure 47: Europe Synthetic Rubber Industry Revenue (Million), by Type 2024 & 2032
- Figure 48: Europe Synthetic Rubber Industry Volume (K Tons), by Type 2024 & 2032
- Figure 49: Europe Synthetic Rubber Industry Revenue Share (%), by Type 2024 & 2032
- Figure 50: Europe Synthetic Rubber Industry Volume Share (%), by Type 2024 & 2032
- Figure 51: Europe Synthetic Rubber Industry Revenue (Million), by Application 2024 & 2032
- Figure 52: Europe Synthetic Rubber Industry Volume (K Tons), by Application 2024 & 2032
- Figure 53: Europe Synthetic Rubber Industry Revenue Share (%), by Application 2024 & 2032
- Figure 54: Europe Synthetic Rubber Industry Volume Share (%), by Application 2024 & 2032
- Figure 55: Europe Synthetic Rubber Industry Revenue (Million), by Country 2024 & 2032
- Figure 56: Europe Synthetic Rubber Industry Volume (K Tons), by Country 2024 & 2032
- Figure 57: Europe Synthetic Rubber Industry Revenue Share (%), by Country 2024 & 2032
- Figure 58: Europe Synthetic Rubber Industry Volume Share (%), by Country 2024 & 2032
- Figure 59: South America Synthetic Rubber Industry Revenue (Million), by Type 2024 & 2032
- Figure 60: South America Synthetic Rubber Industry Volume (K Tons), by Type 2024 & 2032
- Figure 61: South America Synthetic Rubber Industry Revenue Share (%), by Type 2024 & 2032
- Figure 62: South America Synthetic Rubber Industry Volume Share (%), by Type 2024 & 2032
- Figure 63: South America Synthetic Rubber Industry Revenue (Million), by Application 2024 & 2032
- Figure 64: South America Synthetic Rubber Industry Volume (K Tons), by Application 2024 & 2032
- Figure 65: South America Synthetic Rubber Industry Revenue Share (%), by Application 2024 & 2032
- Figure 66: South America Synthetic Rubber Industry Volume Share (%), by Application 2024 & 2032
- Figure 67: South America Synthetic Rubber Industry Revenue (Million), by Country 2024 & 2032
- Figure 68: South America Synthetic Rubber Industry Volume (K Tons), by Country 2024 & 2032
- Figure 69: South America Synthetic Rubber Industry Revenue Share (%), by Country 2024 & 2032
- Figure 70: South America Synthetic Rubber Industry Volume Share (%), by Country 2024 & 2032
- Figure 71: Middle East and Africa Synthetic Rubber Industry Revenue (Million), by Type 2024 & 2032
- Figure 72: Middle East and Africa Synthetic Rubber Industry Volume (K Tons), by Type 2024 & 2032
- Figure 73: Middle East and Africa Synthetic Rubber Industry Revenue Share (%), by Type 2024 & 2032
- Figure 74: Middle East and Africa Synthetic Rubber Industry Volume Share (%), by Type 2024 & 2032
- Figure 75: Middle East and Africa Synthetic Rubber Industry Revenue (Million), by Application 2024 & 2032
- Figure 76: Middle East and Africa Synthetic Rubber Industry Volume (K Tons), by Application 2024 & 2032
- Figure 77: Middle East and Africa Synthetic Rubber Industry Revenue Share (%), by Application 2024 & 2032
- Figure 78: Middle East and Africa Synthetic Rubber Industry Volume Share (%), by Application 2024 & 2032
- Figure 79: Middle East and Africa Synthetic Rubber Industry Revenue (Million), by Country 2024 & 2032
- Figure 80: Middle East and Africa Synthetic Rubber Industry Volume (K Tons), by Country 2024 & 2032
- Figure 81: Middle East and Africa Synthetic Rubber Industry Revenue Share (%), by Country 2024 & 2032
- Figure 82: Middle East and Africa Synthetic Rubber Industry Volume Share (%), by Country 2024 & 2032
List of Tables
- Table 1: Global Synthetic Rubber Industry Revenue Million Forecast, by Region 2019 & 2032
- Table 2: Global Synthetic Rubber Industry Volume K Tons Forecast, by Region 2019 & 2032
- Table 3: Global Synthetic Rubber Industry Revenue Million Forecast, by Type 2019 & 2032
- Table 4: Global Synthetic Rubber Industry Volume K Tons Forecast, by Type 2019 & 2032
- Table 5: Global Synthetic Rubber Industry Revenue Million Forecast, by Application 2019 & 2032
- Table 6: Global Synthetic Rubber Industry Volume K Tons Forecast, by Application 2019 & 2032
- Table 7: Global Synthetic Rubber Industry Revenue Million Forecast, by Region 2019 & 2032
- Table 8: Global Synthetic Rubber Industry Volume K Tons Forecast, by Region 2019 & 2032
- Table 9: Global Synthetic Rubber Industry Revenue Million Forecast, by Country 2019 & 2032
- Table 10: Global Synthetic Rubber Industry Volume K Tons Forecast, by Country 2019 & 2032
- Table 11: United States Synthetic Rubber Industry Revenue (Million) Forecast, by Application 2019 & 2032
- Table 12: United States Synthetic Rubber Industry Volume (K Tons) Forecast, by Application 2019 & 2032
- Table 13: Canada Synthetic Rubber Industry Revenue (Million) Forecast, by Application 2019 & 2032
- Table 14: Canada Synthetic Rubber Industry Volume (K Tons) Forecast, by Application 2019 & 2032
- Table 15: Mexico Synthetic Rubber Industry Revenue (Million) Forecast, by Application 2019 & 2032
- Table 16: Mexico Synthetic Rubber Industry Volume (K Tons) Forecast, by Application 2019 & 2032
- Table 17: Global Synthetic Rubber Industry Revenue Million Forecast, by Country 2019 & 2032
- Table 18: Global Synthetic Rubber Industry Volume K Tons Forecast, by Country 2019 & 2032
- Table 19: Germany Synthetic Rubber Industry Revenue (Million) Forecast, by Application 2019 & 2032
- Table 20: Germany Synthetic Rubber Industry Volume (K Tons) Forecast, by Application 2019 & 2032
- Table 21: France Synthetic Rubber Industry Revenue (Million) Forecast, by Application 2019 & 2032
- Table 22: France Synthetic Rubber Industry Volume (K Tons) Forecast, by Application 2019 & 2032
- Table 23: Italy Synthetic Rubber Industry Revenue (Million) Forecast, by Application 2019 & 2032
- Table 24: Italy Synthetic Rubber Industry Volume (K Tons) Forecast, by Application 2019 & 2032
- Table 25: United Kingdom Synthetic Rubber Industry Revenue (Million) Forecast, by Application 2019 & 2032
- Table 26: United Kingdom Synthetic Rubber Industry Volume (K Tons) Forecast, by Application 2019 & 2032
- Table 27: Netherlands Synthetic Rubber Industry Revenue (Million) Forecast, by Application 2019 & 2032
- Table 28: Netherlands Synthetic Rubber Industry Volume (K Tons) Forecast, by Application 2019 & 2032
- Table 29: Rest of Europe Synthetic Rubber Industry Revenue (Million) Forecast, by Application 2019 & 2032
- Table 30: Rest of Europe Synthetic Rubber Industry Volume (K Tons) Forecast, by Application 2019 & 2032
- Table 31: Global Synthetic Rubber Industry Revenue Million Forecast, by Country 2019 & 2032
- Table 32: Global Synthetic Rubber Industry Volume K Tons Forecast, by Country 2019 & 2032
- Table 33: China Synthetic Rubber Industry Revenue (Million) Forecast, by Application 2019 & 2032
- Table 34: China Synthetic Rubber Industry Volume (K Tons) Forecast, by Application 2019 & 2032
- Table 35: Japan Synthetic Rubber Industry Revenue (Million) Forecast, by Application 2019 & 2032
- Table 36: Japan Synthetic Rubber Industry Volume (K Tons) Forecast, by Application 2019 & 2032
- Table 37: India Synthetic Rubber Industry Revenue (Million) Forecast, by Application 2019 & 2032
- Table 38: India Synthetic Rubber Industry Volume (K Tons) Forecast, by Application 2019 & 2032
- Table 39: South Korea Synthetic Rubber Industry Revenue (Million) Forecast, by Application 2019 & 2032
- Table 40: South Korea Synthetic Rubber Industry Volume (K Tons) Forecast, by Application 2019 & 2032
- Table 41: Taiwan Synthetic Rubber Industry Revenue (Million) Forecast, by Application 2019 & 2032
- Table 42: Taiwan Synthetic Rubber Industry Volume (K Tons) Forecast, by Application 2019 & 2032
- Table 43: Australia Synthetic Rubber Industry Revenue (Million) Forecast, by Application 2019 & 2032
- Table 44: Australia Synthetic Rubber Industry Volume (K Tons) Forecast, by Application 2019 & 2032
- Table 45: Rest of Asia-Pacific Synthetic Rubber Industry Revenue (Million) Forecast, by Application 2019 & 2032
- Table 46: Rest of Asia-Pacific Synthetic Rubber Industry Volume (K Tons) Forecast, by Application 2019 & 2032
- Table 47: Global Synthetic Rubber Industry Revenue Million Forecast, by Country 2019 & 2032
- Table 48: Global Synthetic Rubber Industry Volume K Tons Forecast, by Country 2019 & 2032
- Table 49: Brazil Synthetic Rubber Industry Revenue (Million) Forecast, by Application 2019 & 2032
- Table 50: Brazil Synthetic Rubber Industry Volume (K Tons) Forecast, by Application 2019 & 2032
- Table 51: Argentina Synthetic Rubber Industry Revenue (Million) Forecast, by Application 2019 & 2032
- Table 52: Argentina Synthetic Rubber Industry Volume (K Tons) Forecast, by Application 2019 & 2032
- Table 53: Rest of South America Synthetic Rubber Industry Revenue (Million) Forecast, by Application 2019 & 2032
- Table 54: Rest of South America Synthetic Rubber Industry Volume (K Tons) Forecast, by Application 2019 & 2032
- Table 55: Global Synthetic Rubber Industry Revenue Million Forecast, by Country 2019 & 2032
- Table 56: Global Synthetic Rubber Industry Volume K Tons Forecast, by Country 2019 & 2032
- Table 57: Middle East Synthetic Rubber Industry Revenue (Million) Forecast, by Application 2019 & 2032
- Table 58: Middle East Synthetic Rubber Industry Volume (K Tons) Forecast, by Application 2019 & 2032
- Table 59: Africa Synthetic Rubber Industry Revenue (Million) Forecast, by Application 2019 & 2032
- Table 60: Africa Synthetic Rubber Industry Volume (K Tons) Forecast, by Application 2019 & 2032
- Table 61: Global Synthetic Rubber Industry Revenue Million Forecast, by Type 2019 & 2032
- Table 62: Global Synthetic Rubber Industry Volume K Tons Forecast, by Type 2019 & 2032
- Table 63: Global Synthetic Rubber Industry Revenue Million Forecast, by Application 2019 & 2032
- Table 64: Global Synthetic Rubber Industry Volume K Tons Forecast, by Application 2019 & 2032
- Table 65: Global Synthetic Rubber Industry Revenue Million Forecast, by Country 2019 & 2032
- Table 66: Global Synthetic Rubber Industry Volume K Tons Forecast, by Country 2019 & 2032
- Table 67: China Synthetic Rubber Industry Revenue (Million) Forecast, by Application 2019 & 2032
- Table 68: China Synthetic Rubber Industry Volume (K Tons) Forecast, by Application 2019 & 2032
- Table 69: India Synthetic Rubber Industry Revenue (Million) Forecast, by Application 2019 & 2032
- Table 70: India Synthetic Rubber Industry Volume (K Tons) Forecast, by Application 2019 & 2032
- Table 71: Japan Synthetic Rubber Industry Revenue (Million) Forecast, by Application 2019 & 2032
- Table 72: Japan Synthetic Rubber Industry Volume (K Tons) Forecast, by Application 2019 & 2032
- Table 73: South Korea Synthetic Rubber Industry Revenue (Million) Forecast, by Application 2019 & 2032
- Table 74: South Korea Synthetic Rubber Industry Volume (K Tons) Forecast, by Application 2019 & 2032
- Table 75: Malaysia Synthetic Rubber Industry Revenue (Million) Forecast, by Application 2019 & 2032
- Table 76: Malaysia Synthetic Rubber Industry Volume (K Tons) Forecast, by Application 2019 & 2032
- Table 77: Thailand Synthetic Rubber Industry Revenue (Million) Forecast, by Application 2019 & 2032
- Table 78: Thailand Synthetic Rubber Industry Volume (K Tons) Forecast, by Application 2019 & 2032
- Table 79: Vietnam Synthetic Rubber Industry Revenue (Million) Forecast, by Application 2019 & 2032
- Table 80: Vietnam Synthetic Rubber Industry Volume (K Tons) Forecast, by Application 2019 & 2032
- Table 81: Indonesia Synthetic Rubber Industry Revenue (Million) Forecast, by Application 2019 & 2032
- Table 82: Indonesia Synthetic Rubber Industry Volume (K Tons) Forecast, by Application 2019 & 2032
- Table 83: Rest of Asia Pacific Synthetic Rubber Industry Revenue (Million) Forecast, by Application 2019 & 2032
- Table 84: Rest of Asia Pacific Synthetic Rubber Industry Volume (K Tons) Forecast, by Application 2019 & 2032
- Table 85: Global Synthetic Rubber Industry Revenue Million Forecast, by Type 2019 & 2032
- Table 86: Global Synthetic Rubber Industry Volume K Tons Forecast, by Type 2019 & 2032
- Table 87: Global Synthetic Rubber Industry Revenue Million Forecast, by Application 2019 & 2032
- Table 88: Global Synthetic Rubber Industry Volume K Tons Forecast, by Application 2019 & 2032
- Table 89: Global Synthetic Rubber Industry Revenue Million Forecast, by Country 2019 & 2032
- Table 90: Global Synthetic Rubber Industry Volume K Tons Forecast, by Country 2019 & 2032
- Table 91: United States Synthetic Rubber Industry Revenue (Million) Forecast, by Application 2019 & 2032
- Table 92: United States Synthetic Rubber Industry Volume (K Tons) Forecast, by Application 2019 & 2032
- Table 93: Canada Synthetic Rubber Industry Revenue (Million) Forecast, by Application 2019 & 2032
- Table 94: Canada Synthetic Rubber Industry Volume (K Tons) Forecast, by Application 2019 & 2032
- Table 95: Mexico Synthetic Rubber Industry Revenue (Million) Forecast, by Application 2019 & 2032
- Table 96: Mexico Synthetic Rubber Industry Volume (K Tons) Forecast, by Application 2019 & 2032
- Table 97: Global Synthetic Rubber Industry Revenue Million Forecast, by Type 2019 & 2032
- Table 98: Global Synthetic Rubber Industry Volume K Tons Forecast, by Type 2019 & 2032
- Table 99: Global Synthetic Rubber Industry Revenue Million Forecast, by Application 2019 & 2032
- Table 100: Global Synthetic Rubber Industry Volume K Tons Forecast, by Application 2019 & 2032
- Table 101: Global Synthetic Rubber Industry Revenue Million Forecast, by Country 2019 & 2032
- Table 102: Global Synthetic Rubber Industry Volume K Tons Forecast, by Country 2019 & 2032
- Table 103: Germany Synthetic Rubber Industry Revenue (Million) Forecast, by Application 2019 & 2032
- Table 104: Germany Synthetic Rubber Industry Volume (K Tons) Forecast, by Application 2019 & 2032
- Table 105: United Kingdom Synthetic Rubber Industry Revenue (Million) Forecast, by Application 2019 & 2032
- Table 106: United Kingdom Synthetic Rubber Industry Volume (K Tons) Forecast, by Application 2019 & 2032
- Table 107: France Synthetic Rubber Industry Revenue (Million) Forecast, by Application 2019 & 2032
- Table 108: France Synthetic Rubber Industry Volume (K Tons) Forecast, by Application 2019 & 2032
- Table 109: Italy Synthetic Rubber Industry Revenue (Million) Forecast, by Application 2019 & 2032
- Table 110: Italy Synthetic Rubber Industry Volume (K Tons) Forecast, by Application 2019 & 2032
- Table 111: Spain Synthetic Rubber Industry Revenue (Million) Forecast, by Application 2019 & 2032
- Table 112: Spain Synthetic Rubber Industry Volume (K Tons) Forecast, by Application 2019 & 2032
- Table 113: Russia Synthetic Rubber Industry Revenue (Million) Forecast, by Application 2019 & 2032
- Table 114: Russia Synthetic Rubber Industry Volume (K Tons) Forecast, by Application 2019 & 2032
- Table 115: NORDIC Synthetic Rubber Industry Revenue (Million) Forecast, by Application 2019 & 2032
- Table 116: NORDIC Synthetic Rubber Industry Volume (K Tons) Forecast, by Application 2019 & 2032
- Table 117: Turkey Synthetic Rubber Industry Revenue (Million) Forecast, by Application 2019 & 2032
- Table 118: Turkey Synthetic Rubber Industry Volume (K Tons) Forecast, by Application 2019 & 2032
- Table 119: Rest of Europe Synthetic Rubber Industry Revenue (Million) Forecast, by Application 2019 & 2032
- Table 120: Rest of Europe Synthetic Rubber Industry Volume (K Tons) Forecast, by Application 2019 & 2032
- Table 121: Global Synthetic Rubber Industry Revenue Million Forecast, by Type 2019 & 2032
- Table 122: Global Synthetic Rubber Industry Volume K Tons Forecast, by Type 2019 & 2032
- Table 123: Global Synthetic Rubber Industry Revenue Million Forecast, by Application 2019 & 2032
- Table 124: Global Synthetic Rubber Industry Volume K Tons Forecast, by Application 2019 & 2032
- Table 125: Global Synthetic Rubber Industry Revenue Million Forecast, by Country 2019 & 2032
- Table 126: Global Synthetic Rubber Industry Volume K Tons Forecast, by Country 2019 & 2032
- Table 127: Brazil Synthetic Rubber Industry Revenue (Million) Forecast, by Application 2019 & 2032
- Table 128: Brazil Synthetic Rubber Industry Volume (K Tons) Forecast, by Application 2019 & 2032
- Table 129: Argentina Synthetic Rubber Industry Revenue (Million) Forecast, by Application 2019 & 2032
- Table 130: Argentina Synthetic Rubber Industry Volume (K Tons) Forecast, by Application 2019 & 2032
- Table 131: Colombia Synthetic Rubber Industry Revenue (Million) Forecast, by Application 2019 & 2032
- Table 132: Colombia Synthetic Rubber Industry Volume (K Tons) Forecast, by Application 2019 & 2032
- Table 133: Rest of South America Synthetic Rubber Industry Revenue (Million) Forecast, by Application 2019 & 2032
- Table 134: Rest of South America Synthetic Rubber Industry Volume (K Tons) Forecast, by Application 2019 & 2032
- Table 135: Global Synthetic Rubber Industry Revenue Million Forecast, by Type 2019 & 2032
- Table 136: Global Synthetic Rubber Industry Volume K Tons Forecast, by Type 2019 & 2032
- Table 137: Global Synthetic Rubber Industry Revenue Million Forecast, by Application 2019 & 2032
- Table 138: Global Synthetic Rubber Industry Volume K Tons Forecast, by Application 2019 & 2032
- Table 139: Global Synthetic Rubber Industry Revenue Million Forecast, by Country 2019 & 2032
- Table 140: Global Synthetic Rubber Industry Volume K Tons Forecast, by Country 2019 & 2032
- Table 141: Saudi Arabia Synthetic Rubber Industry Revenue (Million) Forecast, by Application 2019 & 2032
- Table 142: Saudi Arabia Synthetic Rubber Industry Volume (K Tons) Forecast, by Application 2019 & 2032
- Table 143: South Africa Synthetic Rubber Industry Revenue (Million) Forecast, by Application 2019 & 2032
- Table 144: South Africa Synthetic Rubber Industry Volume (K Tons) Forecast, by Application 2019 & 2032
- Table 145: United Arab Emirates Synthetic Rubber Industry Revenue (Million) Forecast, by Application 2019 & 2032
- Table 146: United Arab Emirates Synthetic Rubber Industry Volume (K Tons) Forecast, by Application 2019 & 2032
- Table 147: Nigeria Synthetic Rubber Industry Revenue (Million) Forecast, by Application 2019 & 2032
- Table 148: Nigeria Synthetic Rubber Industry Volume (K Tons) Forecast, by Application 2019 & 2032
- Table 149: Qatar Synthetic Rubber Industry Revenue (Million) Forecast, by Application 2019 & 2032
- Table 150: Qatar Synthetic Rubber Industry Volume (K Tons) Forecast, by Application 2019 & 2032
- Table 151: Egypt Synthetic Rubber Industry Revenue (Million) Forecast, by Application 2019 & 2032
- Table 152: Egypt Synthetic Rubber Industry Volume (K Tons) Forecast, by Application 2019 & 2032
- Table 153: Rest of Middle East and Africa Synthetic Rubber Industry Revenue (Million) Forecast, by Application 2019 & 2032
- Table 154: Rest of Middle East and Africa Synthetic Rubber Industry Volume (K Tons) Forecast, by Application 2019 & 2032
Frequently Asked Questions
1. What is the projected Compound Annual Growth Rate (CAGR) of the Synthetic Rubber Industry?
The projected CAGR is approximately 4.21%.
2. Which companies are prominent players in the Synthetic Rubber Industry?
Key companies in the market include Versalis S p A, The Goodyear Tire & Rubber Company, Synthos, China Petrochemical Corporation, Exxon Mobil Corporation, Mitsubishi Chemical Corporation, Reliance Industries Limited, ENEOS Corporation, LANXESS, SIBUR, SABIC, LG Chem, Saudi Arabian Oil Co, Dow, Apcotex, Kumho Petrochemical, TSRC.
3. What are the main segments of the Synthetic Rubber Industry?
The market segments include Type, Application.
4. Can you provide details about the market size?
The market size is estimated to be USD 33.48 Million as of 2022.
5. What are some drivers contributing to market growth?
Increasing Demand from Rising Sales of Electric Vehicles; Other Drivers.
6. What are the notable trends driving market growth?
Increasing Demand From Tire and Tire Components.
7. Are there any restraints impacting market growth?
Replacement of Rubber by Polyurethanes in Some Applications; Other Restraints.
8. Can you provide examples of recent developments in the market?
December 2023: SIBUR's Nizhnekamskneftekhim completed the upgrade of its halobutyl rubbers (HBR) capacities by ramping them up from 150 to 200 kilotons. About RUB 8 billion (USD 85.5 million) was spent on this upgrade project, which installed six new HBR production units and revamped 16 existing ones.
9. What pricing options are available for accessing the report?
Pricing options include single-user, multi-user, and enterprise licenses priced at USD 4750, USD 5250, and USD 8750 respectively.
10. Is the market size provided in terms of value or volume?
The market size is provided in terms of value, measured in Million and volume, measured in K Tons.
11. Are there any specific market keywords associated with the report?
Yes, the market keyword associated with the report is "Synthetic Rubber Industry," which aids in identifying and referencing the specific market segment covered.
12. How do I determine which pricing option suits my needs best?
The pricing options vary based on user requirements and access needs. Individual users may opt for single-user licenses, while businesses requiring broader access may choose multi-user or enterprise licenses for cost-effective access to the report.
13. Are there any additional resources or data provided in the Synthetic Rubber Industry report?
While the report offers comprehensive insights, it's advisable to review the specific contents or supplementary materials provided to ascertain if additional resources or data are available.
14. How can I stay updated on further developments or reports in the Synthetic Rubber Industry?
To stay informed about further developments, trends, and reports in the Synthetic Rubber Industry, consider subscribing to industry newsletters, following relevant companies and organizations, or regularly checking reputable industry news sources and publications.
Methodology
Step 1 - Identification of Relevant Samples Size from Population Database


Step 2 - Approaches for Defining Global Market Size (Value, Volume* & Price*)

Note*: In applicable scenarios
Step 3 - Data Sources
Primary Research
- Web Analytics
- Survey Reports
- Research Institute
- Latest Research Reports
- Opinion Leaders
Secondary Research
- Annual Reports
- White Paper
- Latest Press Release
- Industry Association
- Paid Database
- Investor Presentations

Step 4 - Data Triangulation
Involves using different sources of information in order to increase the validity of a study
These sources are likely to be stakeholders in a program - participants, other researchers, program staff, other community members, and so on.
Then we put all data in single framework & apply various statistical tools to find out the dynamic on the market.
During the analysis stage, feedback from the stakeholder groups would be compared to determine areas of agreement as well as areas of divergence


