
Key Insights
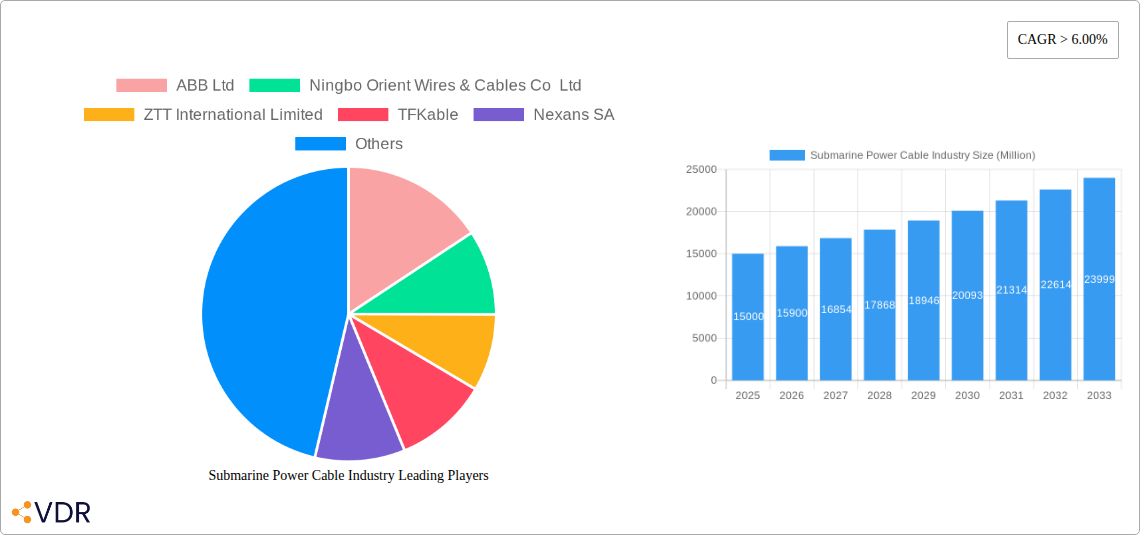
The global submarine power cable market is experiencing robust growth, driven by the increasing demand for renewable energy sources, particularly offshore wind farms. The market's Compound Annual Growth Rate (CAGR) exceeding 6% indicates a significant expansion projected through 2033. This growth is fueled by substantial investments in offshore wind energy projects globally, necessitating extensive submarine cable infrastructure for power transmission. Furthermore, the rising need for interconnector cables to enhance grid stability and reliability across continents and regions is contributing to market expansion. The market is segmented by cable type, with High-Voltage Direct Current (HVDC) and High-Voltage Alternating Current (HVAC) cables dominating the landscape. HVDC cables are favored for long-distance transmission due to their efficiency in reducing transmission losses, while HVAC cables remain crucial for shorter distances. Key players such as ABB, Nexans, Prysmian Group, and Sumitomo Electric Industries are driving innovation in cable technology, focusing on enhanced capacity, reliability, and cost-effectiveness. Regional growth varies, with North America and Europe leading due to significant investments in offshore wind and grid modernization. However, the Asia-Pacific region is expected to witness the fastest growth rate driven by substantial expansion in renewable energy projects and industrial development.
The competitive landscape is characterized by both established multinational corporations and regional players. While established players enjoy a significant market share due to their technological prowess and global reach, regional companies are making inroads, benefiting from local market knowledge and cost advantages. The market faces certain restraints, including the high initial investment costs associated with submarine cable projects and the complex installation process. However, government initiatives promoting renewable energy adoption, coupled with advancements in cable technology, are mitigating these challenges. Technological advancements are leading to higher capacity cables, reduced installation times, and improved reliability, contributing to the overall growth of the market. Future growth will heavily depend on continued policy support for renewable energy, advancements in cable technology, and successful execution of large-scale offshore wind projects. The forecast period from 2025-2033 will witness substantial growth driven by these factors.
Submarine Power Cable Industry Market Report: 2019-2033
This comprehensive report provides an in-depth analysis of the global submarine power cable industry, encompassing market dynamics, growth trends, competitive landscape, and future outlook. The study period covers 2019-2033, with 2025 as the base and estimated year. This report is crucial for industry professionals, investors, and strategists seeking to understand and capitalize on the opportunities within this dynamic sector. The report delves into both the parent market (Power Cable Industry) and the child market (Submarine Power Cables), offering a holistic view. Market values are presented in Million units.
Submarine Power Cable Industry Market Dynamics & Structure
This section analyzes the market concentration, technological advancements, regulatory landscape, competitive substitutes, end-user demographics, and mergers & acquisitions (M&A) activity within the submarine power cable industry. The market is characterized by a moderately concentrated landscape, with key players holding significant market share. Technological innovation, primarily driven by advancements in HVDC (High Voltage Direct Current) and HVAC (High Voltage Alternating Current) cable technology, plays a crucial role. Stringent regulatory frameworks governing cable installation and safety standards influence market dynamics. Fiber optic cables represent a key substitute, competing for similar infrastructure projects.
- Market Concentration: The top 10 players account for approximately xx% of the global market share in 2025.
- Technological Innovation: Significant investments in R&D are focusing on increasing cable capacity, improving transmission efficiency, and enhancing durability.
- Regulatory Frameworks: International and regional regulations regarding cable installation, environmental impact assessments, and safety protocols heavily influence market growth.
- Competitive Substitutes: Fiber optic cables pose a competitive threat, particularly in applications where data transmission is a primary requirement.
- End-User Demographics: Key end-users include electricity grid operators, offshore wind farm developers, and telecommunication companies.
- M&A Trends: The industry has witnessed xx M&A deals between 2019 and 2024, primarily driven by strategic acquisitions to expand market share and enhance technological capabilities. For example, the acquisition of KT Submarine Co. by LS Cable & System Ltd. in 2022 significantly strengthened LS Cable's position.
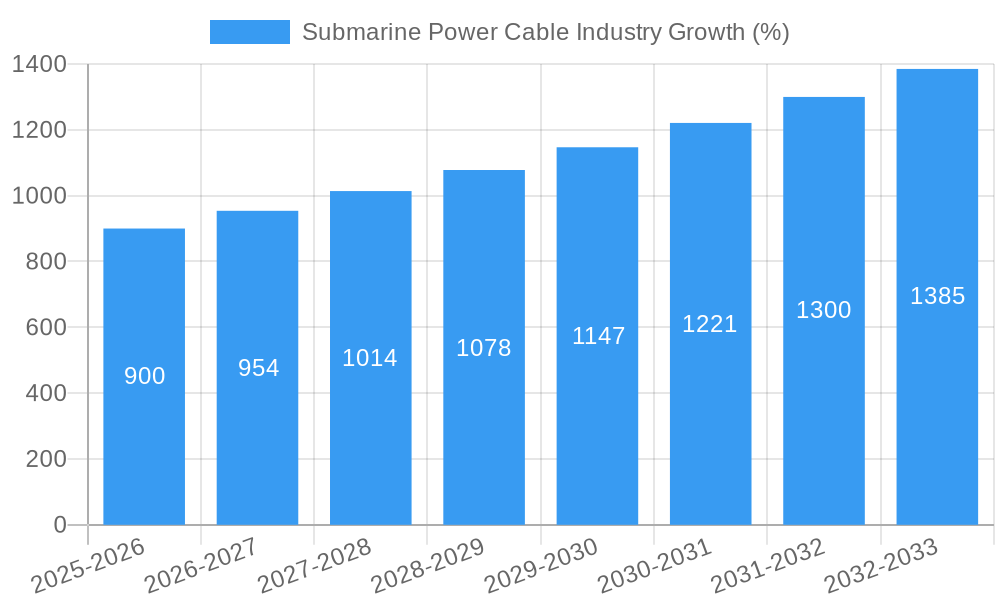
Submarine Power Cable Industry Growth Trends & Insights
This section details the historical, current, and projected market size of the submarine power cable industry. The market witnessed a CAGR of xx% during the historical period (2019-2024), driven by factors such as increasing demand for renewable energy, growing offshore wind energy projects, and expansion of global underwater communication networks. The market is projected to experience a CAGR of xx% during the forecast period (2025-2033), primarily fueled by the rising global energy demand, government initiatives promoting renewable energy integration, and technological advancements improving efficiency and reliability. Adoption rates are increasing, particularly in regions with substantial renewable energy development plans and expanding undersea infrastructure needs. Technological disruptions, such as the development of next-generation cable materials, are accelerating market growth. Consumer behavior shifts, in relation to sustainability awareness and the increasing demand for reliable power transmission, are further boosting market adoption.
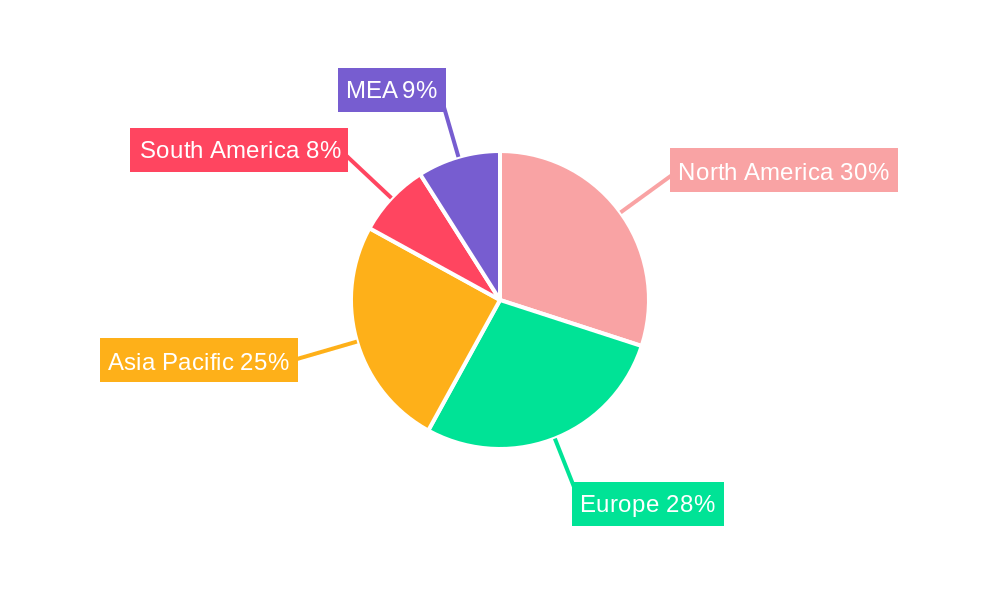
Dominant Regions, Countries, or Segments in Submarine Power Cable Industry
The Asia-Pacific region is currently the leading market for submarine power cables, driven by the rapid growth of renewable energy projects, particularly offshore wind farms, in countries like China, Japan, and South Korea. Europe follows as a significant market, with substantial investments in offshore wind and grid modernization initiatives. Within the Type of Current segments, the HVDC segment is experiencing faster growth compared to HVAC, owing to its higher efficiency in long-distance power transmission.
- Asia-Pacific: High growth is driven by substantial investments in offshore wind energy, expanding electricity grids, and increasing demand for reliable power supply.
- Europe: Significant government support for renewable energy and grid modernization projects is fueling market growth.
- North America: Growth is driven by offshore wind energy development and the need for improved grid infrastructure.
- HVDC Segment: Higher efficiency for long-distance power transmission makes this segment the fastest growing.
- HVAC Segment: Continues to hold a significant market share, primarily in shorter distance transmission projects.
Submarine Power Cable Industry Product Landscape
Submarine power cables are categorized based on voltage rating (HVDC and HVAC), conductor material (copper or aluminum), and insulation type. Recent innovations focus on improving cable capacity, enhancing thermal performance, and increasing resistance to external factors like corrosion and pressure at great depths. Key selling propositions include higher power transmission capacity, improved reliability, and extended operational lifespan. Technological advancements include the development of new materials with enhanced conductivity and insulation properties and improved manufacturing techniques to reduce production costs and improve quality.
Key Drivers, Barriers & Challenges in Submarine Power Cable Industry
Key Drivers:
- Rising global energy demand and the increasing adoption of renewable energy sources, particularly offshore wind farms.
- Government initiatives and subsidies promoting renewable energy integration and grid modernization.
- Technological advancements leading to improved cable efficiency, capacity, and durability.
Key Challenges and Restraints:
- High installation costs and complexities associated with submarine cable projects.
- Environmental regulations and concerns regarding the impact of cable installation on marine ecosystems.
- Geopolitical risks and international trade disputes influencing the supply chain and market access. These factors have resulted in approximately xx% increase in material costs in 2024.
Emerging Opportunities in Submarine Power Cable Industry
- Expanding offshore wind energy capacity globally presents significant growth potential.
- Increasing demand for data transmission via subsea cables offers new opportunities.
- Development of new cable materials and technologies enhances efficiency and capacity.
- Untapped markets in developing economies represent significant opportunities for expansion.
Growth Accelerators in the Submarine Power Cable Industry Industry
Technological advancements in cable materials, manufacturing processes, and installation techniques are driving long-term growth. Strategic partnerships between cable manufacturers and renewable energy developers are fostering innovation and accelerating market expansion. Government policies and regulatory frameworks supporting renewable energy integration and grid modernization play a key role in boosting market growth.
Key Players Shaping the Submarine Power Cable Industry Market
- ABB Ltd
- Ningbo Orient Wires & Cables Co Ltd
- ZTT International Limited
- TFKable
- Nexans SA
- Furukawa Electric Co Ltd
- NKT A/S
- Prysmian Group
- Sumitomo Electric Industries Limited
- KEI Industries Limited
- LS Cable & System Ltd
Notable Milestones in Submarine Power Cable Industry Sector
- November 2022: LS Cable & System Ltd. becomes the largest shareholder of KT Submarine Co., strengthening its position in the submarine cable market.
In-Depth Submarine Power Cable Industry Market Outlook
The submarine power cable industry is poised for significant growth in the coming years, driven by the increasing demand for renewable energy, the expansion of global electricity grids, and ongoing technological advancements. Strategic partnerships and investments in R&D will be crucial for companies to maintain competitiveness. The focus on sustainable and environmentally friendly cable solutions will further shape market dynamics. The market is expected to witness sustained growth, presenting attractive opportunities for both established players and new entrants.
Submarine Power Cable Industry Segmentation
-
1. Type of Current
- 1.1. HVDC
- 1.2. HVAC
Submarine Power Cable Industry Segmentation By Geography
- 1. North America
- 2. Europe
- 3. Asia Pacific
- 4. South America
- 5. Middle East and Africa
Submarine Power Cable Industry REPORT HIGHLIGHTS
| Aspects | Details |
|---|---|
| Study Period | 2019-2033 |
| Base Year | 2024 |
| Estimated Year | 2025 |
| Forecast Period | 2025-2033 |
| Historical Period | 2019-2024 |
| Growth Rate | CAGR of > 6.00% from 2019-2033 |
| Segmentation |
|
Table of Contents
- 1. Introduction
- 1.1. Research Scope
- 1.2. Market Segmentation
- 1.3. Research Methodology
- 1.4. Definitions and Assumptions
- 2. Executive Summary
- 2.1. Introduction
- 3. Market Dynamics
- 3.1. Introduction
- 3.2. Market Drivers
- 3.2.1. HVDC submarine cables are increasingly preferred for long-distance power transmission due to their efficiency and lower energy losses compared to alternating current (AC) systems. The adoption of HVDC technology is a significant driver in the submarine power cable market.
- 3.3. Market Restrains
- 3.3.1 The deployment and maintenance of submarine power cables involve substantial financial investments. The complex installation procedures
- 3.3.2 specialized equipment requirements
- 3.3.3 and the need for expert personnel contribute to these high costs.
- 3.4. Market Trends
- 3.4.1 There is a notable trend towards integrating renewable energy sources
- 3.4.2 such as offshore wind and solar power
- 3.4.3 into existing power grids. Submarine power cables play a crucial role in this integration by connecting remote renewable energy sites to onshore grids
- 4. Market Factor Analysis
- 4.1. Porters Five Forces
- 4.2. Supply/Value Chain
- 4.3. PESTEL analysis
- 4.4. Market Entropy
- 4.5. Patent/Trademark Analysis
- 5. Global Submarine Power Cable Industry Analysis, Insights and Forecast, 2019-2031
- 5.1. Market Analysis, Insights and Forecast - by Type of Current
- 5.1.1. HVDC
- 5.1.2. HVAC
- 5.2. Market Analysis, Insights and Forecast - by Region
- 5.2.1. North America
- 5.2.2. Europe
- 5.2.3. Asia Pacific
- 5.2.4. South America
- 5.2.5. Middle East and Africa
- 5.1. Market Analysis, Insights and Forecast - by Type of Current
- 6. North America Submarine Power Cable Industry Analysis, Insights and Forecast, 2019-2031
- 6.1. Market Analysis, Insights and Forecast - by Type of Current
- 6.1.1. HVDC
- 6.1.2. HVAC
- 6.1. Market Analysis, Insights and Forecast - by Type of Current
- 7. Europe Submarine Power Cable Industry Analysis, Insights and Forecast, 2019-2031
- 7.1. Market Analysis, Insights and Forecast - by Type of Current
- 7.1.1. HVDC
- 7.1.2. HVAC
- 7.1. Market Analysis, Insights and Forecast - by Type of Current
- 8. Asia Pacific Submarine Power Cable Industry Analysis, Insights and Forecast, 2019-2031
- 8.1. Market Analysis, Insights and Forecast - by Type of Current
- 8.1.1. HVDC
- 8.1.2. HVAC
- 8.1. Market Analysis, Insights and Forecast - by Type of Current
- 9. South America Submarine Power Cable Industry Analysis, Insights and Forecast, 2019-2031
- 9.1. Market Analysis, Insights and Forecast - by Type of Current
- 9.1.1. HVDC
- 9.1.2. HVAC
- 9.1. Market Analysis, Insights and Forecast - by Type of Current
- 10. Middle East and Africa Submarine Power Cable Industry Analysis, Insights and Forecast, 2019-2031
- 10.1. Market Analysis, Insights and Forecast - by Type of Current
- 10.1.1. HVDC
- 10.1.2. HVAC
- 10.1. Market Analysis, Insights and Forecast - by Type of Current
- 11. North America Submarine Power Cable Industry Analysis, Insights and Forecast, 2019-2031
- 11.1. Market Analysis, Insights and Forecast - By Country/Sub-region
- 11.1.1 United States
- 11.1.2 Canada
- 11.1.3 Mexico
- 12. Europe Submarine Power Cable Industry Analysis, Insights and Forecast, 2019-2031
- 12.1. Market Analysis, Insights and Forecast - By Country/Sub-region
- 12.1.1 Germany
- 12.1.2 United Kingdom
- 12.1.3 France
- 12.1.4 Spain
- 12.1.5 Italy
- 12.1.6 Spain
- 12.1.7 Belgium
- 12.1.8 Netherland
- 12.1.9 Nordics
- 12.1.10 Rest of Europe
- 13. Asia Pacific Submarine Power Cable Industry Analysis, Insights and Forecast, 2019-2031
- 13.1. Market Analysis, Insights and Forecast - By Country/Sub-region
- 13.1.1 China
- 13.1.2 Japan
- 13.1.3 India
- 13.1.4 South Korea
- 13.1.5 Southeast Asia
- 13.1.6 Australia
- 13.1.7 Indonesia
- 13.1.8 Phillipes
- 13.1.9 Singapore
- 13.1.10 Thailandc
- 13.1.11 Rest of Asia Pacific
- 14. South America Submarine Power Cable Industry Analysis, Insights and Forecast, 2019-2031
- 14.1. Market Analysis, Insights and Forecast - By Country/Sub-region
- 14.1.1 Brazil
- 14.1.2 Argentina
- 14.1.3 Peru
- 14.1.4 Chile
- 14.1.5 Colombia
- 14.1.6 Ecuador
- 14.1.7 Venezuela
- 14.1.8 Rest of South America
- 15. North America Submarine Power Cable Industry Analysis, Insights and Forecast, 2019-2031
- 15.1. Market Analysis, Insights and Forecast - By Country/Sub-region
- 15.1.1 United States
- 15.1.2 Canada
- 15.1.3 Mexico
- 16. MEA Submarine Power Cable Industry Analysis, Insights and Forecast, 2019-2031
- 16.1. Market Analysis, Insights and Forecast - By Country/Sub-region
- 16.1.1 United Arab Emirates
- 16.1.2 Saudi Arabia
- 16.1.3 South Africa
- 16.1.4 Rest of Middle East and Africa
- 17. Competitive Analysis
- 17.1. Global Market Share Analysis 2024
- 17.2. Company Profiles
- 17.2.1 ABB Ltd
- 17.2.1.1. Overview
- 17.2.1.2. Products
- 17.2.1.3. SWOT Analysis
- 17.2.1.4. Recent Developments
- 17.2.1.5. Financials (Based on Availability)
- 17.2.2 Ningbo Orient Wires & Cables Co Ltd
- 17.2.2.1. Overview
- 17.2.2.2. Products
- 17.2.2.3. SWOT Analysis
- 17.2.2.4. Recent Developments
- 17.2.2.5. Financials (Based on Availability)
- 17.2.3 ZTT International Limited
- 17.2.3.1. Overview
- 17.2.3.2. Products
- 17.2.3.3. SWOT Analysis
- 17.2.3.4. Recent Developments
- 17.2.3.5. Financials (Based on Availability)
- 17.2.4 TFKable
- 17.2.4.1. Overview
- 17.2.4.2. Products
- 17.2.4.3. SWOT Analysis
- 17.2.4.4. Recent Developments
- 17.2.4.5. Financials (Based on Availability)
- 17.2.5 Nexans SA
- 17.2.5.1. Overview
- 17.2.5.2. Products
- 17.2.5.3. SWOT Analysis
- 17.2.5.4. Recent Developments
- 17.2.5.5. Financials (Based on Availability)
- 17.2.6 Furukawa Electric Co Ltd
- 17.2.6.1. Overview
- 17.2.6.2. Products
- 17.2.6.3. SWOT Analysis
- 17.2.6.4. Recent Developments
- 17.2.6.5. Financials (Based on Availability)
- 17.2.7 NKT A/S
- 17.2.7.1. Overview
- 17.2.7.2. Products
- 17.2.7.3. SWOT Analysis
- 17.2.7.4. Recent Developments
- 17.2.7.5. Financials (Based on Availability)
- 17.2.8 Prysmian Group
- 17.2.8.1. Overview
- 17.2.8.2. Products
- 17.2.8.3. SWOT Analysis
- 17.2.8.4. Recent Developments
- 17.2.8.5. Financials (Based on Availability)
- 17.2.9 Sumitomo Electric Industries Limited
- 17.2.9.1. Overview
- 17.2.9.2. Products
- 17.2.9.3. SWOT Analysis
- 17.2.9.4. Recent Developments
- 17.2.9.5. Financials (Based on Availability)
- 17.2.10 KEI Industries Limited
- 17.2.10.1. Overview
- 17.2.10.2. Products
- 17.2.10.3. SWOT Analysis
- 17.2.10.4. Recent Developments
- 17.2.10.5. Financials (Based on Availability)
- 17.2.11 LS Cable & System Ltd
- 17.2.11.1. Overview
- 17.2.11.2. Products
- 17.2.11.3. SWOT Analysis
- 17.2.11.4. Recent Developments
- 17.2.11.5. Financials (Based on Availability)
- 17.2.1 ABB Ltd
List of Figures
- Figure 1: Global Submarine Power Cable Industry Revenue Breakdown (Million, %) by Region 2024 & 2032
- Figure 2: North America Submarine Power Cable Industry Revenue (Million), by Country 2024 & 2032
- Figure 3: North America Submarine Power Cable Industry Revenue Share (%), by Country 2024 & 2032
- Figure 4: Europe Submarine Power Cable Industry Revenue (Million), by Country 2024 & 2032
- Figure 5: Europe Submarine Power Cable Industry Revenue Share (%), by Country 2024 & 2032
- Figure 6: Asia Pacific Submarine Power Cable Industry Revenue (Million), by Country 2024 & 2032
- Figure 7: Asia Pacific Submarine Power Cable Industry Revenue Share (%), by Country 2024 & 2032
- Figure 8: South America Submarine Power Cable Industry Revenue (Million), by Country 2024 & 2032
- Figure 9: South America Submarine Power Cable Industry Revenue Share (%), by Country 2024 & 2032
- Figure 10: North America Submarine Power Cable Industry Revenue (Million), by Country 2024 & 2032
- Figure 11: North America Submarine Power Cable Industry Revenue Share (%), by Country 2024 & 2032
- Figure 12: MEA Submarine Power Cable Industry Revenue (Million), by Country 2024 & 2032
- Figure 13: MEA Submarine Power Cable Industry Revenue Share (%), by Country 2024 & 2032
- Figure 14: North America Submarine Power Cable Industry Revenue (Million), by Type of Current 2024 & 2032
- Figure 15: North America Submarine Power Cable Industry Revenue Share (%), by Type of Current 2024 & 2032
- Figure 16: North America Submarine Power Cable Industry Revenue (Million), by Country 2024 & 2032
- Figure 17: North America Submarine Power Cable Industry Revenue Share (%), by Country 2024 & 2032
- Figure 18: Europe Submarine Power Cable Industry Revenue (Million), by Type of Current 2024 & 2032
- Figure 19: Europe Submarine Power Cable Industry Revenue Share (%), by Type of Current 2024 & 2032
- Figure 20: Europe Submarine Power Cable Industry Revenue (Million), by Country 2024 & 2032
- Figure 21: Europe Submarine Power Cable Industry Revenue Share (%), by Country 2024 & 2032
- Figure 22: Asia Pacific Submarine Power Cable Industry Revenue (Million), by Type of Current 2024 & 2032
- Figure 23: Asia Pacific Submarine Power Cable Industry Revenue Share (%), by Type of Current 2024 & 2032
- Figure 24: Asia Pacific Submarine Power Cable Industry Revenue (Million), by Country 2024 & 2032
- Figure 25: Asia Pacific Submarine Power Cable Industry Revenue Share (%), by Country 2024 & 2032
- Figure 26: South America Submarine Power Cable Industry Revenue (Million), by Type of Current 2024 & 2032
- Figure 27: South America Submarine Power Cable Industry Revenue Share (%), by Type of Current 2024 & 2032
- Figure 28: South America Submarine Power Cable Industry Revenue (Million), by Country 2024 & 2032
- Figure 29: South America Submarine Power Cable Industry Revenue Share (%), by Country 2024 & 2032
- Figure 30: Middle East and Africa Submarine Power Cable Industry Revenue (Million), by Type of Current 2024 & 2032
- Figure 31: Middle East and Africa Submarine Power Cable Industry Revenue Share (%), by Type of Current 2024 & 2032
- Figure 32: Middle East and Africa Submarine Power Cable Industry Revenue (Million), by Country 2024 & 2032
- Figure 33: Middle East and Africa Submarine Power Cable Industry Revenue Share (%), by Country 2024 & 2032
List of Tables
- Table 1: Global Submarine Power Cable Industry Revenue Million Forecast, by Region 2019 & 2032
- Table 2: Global Submarine Power Cable Industry Revenue Million Forecast, by Type of Current 2019 & 2032
- Table 3: Global Submarine Power Cable Industry Revenue Million Forecast, by Region 2019 & 2032
- Table 4: Global Submarine Power Cable Industry Revenue Million Forecast, by Country 2019 & 2032
- Table 5: United States Submarine Power Cable Industry Revenue (Million) Forecast, by Application 2019 & 2032
- Table 6: Canada Submarine Power Cable Industry Revenue (Million) Forecast, by Application 2019 & 2032
- Table 7: Mexico Submarine Power Cable Industry Revenue (Million) Forecast, by Application 2019 & 2032
- Table 8: Global Submarine Power Cable Industry Revenue Million Forecast, by Country 2019 & 2032
- Table 9: Germany Submarine Power Cable Industry Revenue (Million) Forecast, by Application 2019 & 2032
- Table 10: United Kingdom Submarine Power Cable Industry Revenue (Million) Forecast, by Application 2019 & 2032
- Table 11: France Submarine Power Cable Industry Revenue (Million) Forecast, by Application 2019 & 2032
- Table 12: Spain Submarine Power Cable Industry Revenue (Million) Forecast, by Application 2019 & 2032
- Table 13: Italy Submarine Power Cable Industry Revenue (Million) Forecast, by Application 2019 & 2032
- Table 14: Spain Submarine Power Cable Industry Revenue (Million) Forecast, by Application 2019 & 2032
- Table 15: Belgium Submarine Power Cable Industry Revenue (Million) Forecast, by Application 2019 & 2032
- Table 16: Netherland Submarine Power Cable Industry Revenue (Million) Forecast, by Application 2019 & 2032
- Table 17: Nordics Submarine Power Cable Industry Revenue (Million) Forecast, by Application 2019 & 2032
- Table 18: Rest of Europe Submarine Power Cable Industry Revenue (Million) Forecast, by Application 2019 & 2032
- Table 19: Global Submarine Power Cable Industry Revenue Million Forecast, by Country 2019 & 2032
- Table 20: China Submarine Power Cable Industry Revenue (Million) Forecast, by Application 2019 & 2032
- Table 21: Japan Submarine Power Cable Industry Revenue (Million) Forecast, by Application 2019 & 2032
- Table 22: India Submarine Power Cable Industry Revenue (Million) Forecast, by Application 2019 & 2032
- Table 23: South Korea Submarine Power Cable Industry Revenue (Million) Forecast, by Application 2019 & 2032
- Table 24: Southeast Asia Submarine Power Cable Industry Revenue (Million) Forecast, by Application 2019 & 2032
- Table 25: Australia Submarine Power Cable Industry Revenue (Million) Forecast, by Application 2019 & 2032
- Table 26: Indonesia Submarine Power Cable Industry Revenue (Million) Forecast, by Application 2019 & 2032
- Table 27: Phillipes Submarine Power Cable Industry Revenue (Million) Forecast, by Application 2019 & 2032
- Table 28: Singapore Submarine Power Cable Industry Revenue (Million) Forecast, by Application 2019 & 2032
- Table 29: Thailandc Submarine Power Cable Industry Revenue (Million) Forecast, by Application 2019 & 2032
- Table 30: Rest of Asia Pacific Submarine Power Cable Industry Revenue (Million) Forecast, by Application 2019 & 2032
- Table 31: Global Submarine Power Cable Industry Revenue Million Forecast, by Country 2019 & 2032
- Table 32: Brazil Submarine Power Cable Industry Revenue (Million) Forecast, by Application 2019 & 2032
- Table 33: Argentina Submarine Power Cable Industry Revenue (Million) Forecast, by Application 2019 & 2032
- Table 34: Peru Submarine Power Cable Industry Revenue (Million) Forecast, by Application 2019 & 2032
- Table 35: Chile Submarine Power Cable Industry Revenue (Million) Forecast, by Application 2019 & 2032
- Table 36: Colombia Submarine Power Cable Industry Revenue (Million) Forecast, by Application 2019 & 2032
- Table 37: Ecuador Submarine Power Cable Industry Revenue (Million) Forecast, by Application 2019 & 2032
- Table 38: Venezuela Submarine Power Cable Industry Revenue (Million) Forecast, by Application 2019 & 2032
- Table 39: Rest of South America Submarine Power Cable Industry Revenue (Million) Forecast, by Application 2019 & 2032
- Table 40: Global Submarine Power Cable Industry Revenue Million Forecast, by Country 2019 & 2032
- Table 41: United States Submarine Power Cable Industry Revenue (Million) Forecast, by Application 2019 & 2032
- Table 42: Canada Submarine Power Cable Industry Revenue (Million) Forecast, by Application 2019 & 2032
- Table 43: Mexico Submarine Power Cable Industry Revenue (Million) Forecast, by Application 2019 & 2032
- Table 44: Global Submarine Power Cable Industry Revenue Million Forecast, by Country 2019 & 2032
- Table 45: United Arab Emirates Submarine Power Cable Industry Revenue (Million) Forecast, by Application 2019 & 2032
- Table 46: Saudi Arabia Submarine Power Cable Industry Revenue (Million) Forecast, by Application 2019 & 2032
- Table 47: South Africa Submarine Power Cable Industry Revenue (Million) Forecast, by Application 2019 & 2032
- Table 48: Rest of Middle East and Africa Submarine Power Cable Industry Revenue (Million) Forecast, by Application 2019 & 2032
- Table 49: Global Submarine Power Cable Industry Revenue Million Forecast, by Type of Current 2019 & 2032
- Table 50: Global Submarine Power Cable Industry Revenue Million Forecast, by Country 2019 & 2032
- Table 51: Global Submarine Power Cable Industry Revenue Million Forecast, by Type of Current 2019 & 2032
- Table 52: Global Submarine Power Cable Industry Revenue Million Forecast, by Country 2019 & 2032
- Table 53: Global Submarine Power Cable Industry Revenue Million Forecast, by Type of Current 2019 & 2032
- Table 54: Global Submarine Power Cable Industry Revenue Million Forecast, by Country 2019 & 2032
- Table 55: Global Submarine Power Cable Industry Revenue Million Forecast, by Type of Current 2019 & 2032
- Table 56: Global Submarine Power Cable Industry Revenue Million Forecast, by Country 2019 & 2032
- Table 57: Global Submarine Power Cable Industry Revenue Million Forecast, by Type of Current 2019 & 2032
- Table 58: Global Submarine Power Cable Industry Revenue Million Forecast, by Country 2019 & 2032
Frequently Asked Questions
1. What is the projected Compound Annual Growth Rate (CAGR) of the Submarine Power Cable Industry?
The projected CAGR is approximately > 6.00%.
2. Which companies are prominent players in the Submarine Power Cable Industry?
Key companies in the market include ABB Ltd, Ningbo Orient Wires & Cables Co Ltd, ZTT International Limited, TFKable, Nexans SA, Furukawa Electric Co Ltd, NKT A/S, Prysmian Group, Sumitomo Electric Industries Limited, KEI Industries Limited, LS Cable & System Ltd.
3. What are the main segments of the Submarine Power Cable Industry?
The market segments include Type of Current.
4. Can you provide details about the market size?
The market size is estimated to be USD XX Million as of 2022.
5. What are some drivers contributing to market growth?
HVDC submarine cables are increasingly preferred for long-distance power transmission due to their efficiency and lower energy losses compared to alternating current (AC) systems. The adoption of HVDC technology is a significant driver in the submarine power cable market..
6. What are the notable trends driving market growth?
There is a notable trend towards integrating renewable energy sources. such as offshore wind and solar power. into existing power grids. Submarine power cables play a crucial role in this integration by connecting remote renewable energy sites to onshore grids.
7. Are there any restraints impacting market growth?
The deployment and maintenance of submarine power cables involve substantial financial investments. The complex installation procedures. specialized equipment requirements. and the need for expert personnel contribute to these high costs..
8. Can you provide examples of recent developments in the market?
In November 2022, South Korea's leading cable manufacturer, LS Cable & System Ltd., became the largest shareholder of KT Submarine Co., a company specializing in undersea cable construction. This strategic investment aimed to strengthen LS Cable's position in the submarine cable market and expand its capabilities in undersea cable projects.
9. What pricing options are available for accessing the report?
Pricing options include single-user, multi-user, and enterprise licenses priced at USD 4750, USD 5250, and USD 8750 respectively.
10. Is the market size provided in terms of value or volume?
The market size is provided in terms of value, measured in Million.
11. Are there any specific market keywords associated with the report?
Yes, the market keyword associated with the report is "Submarine Power Cable Industry," which aids in identifying and referencing the specific market segment covered.
12. How do I determine which pricing option suits my needs best?
The pricing options vary based on user requirements and access needs. Individual users may opt for single-user licenses, while businesses requiring broader access may choose multi-user or enterprise licenses for cost-effective access to the report.
13. Are there any additional resources or data provided in the Submarine Power Cable Industry report?
While the report offers comprehensive insights, it's advisable to review the specific contents or supplementary materials provided to ascertain if additional resources or data are available.
14. How can I stay updated on further developments or reports in the Submarine Power Cable Industry?
To stay informed about further developments, trends, and reports in the Submarine Power Cable Industry, consider subscribing to industry newsletters, following relevant companies and organizations, or regularly checking reputable industry news sources and publications.
Methodology
Step 1 - Identification of Relevant Samples Size from Population Database


Step 2 - Approaches for Defining Global Market Size (Value, Volume* & Price*)

Note*: In applicable scenarios
Step 3 - Data Sources
Primary Research
- Web Analytics
- Survey Reports
- Research Institute
- Latest Research Reports
- Opinion Leaders
Secondary Research
- Annual Reports
- White Paper
- Latest Press Release
- Industry Association
- Paid Database
- Investor Presentations

Step 4 - Data Triangulation
Involves using different sources of information in order to increase the validity of a study
These sources are likely to be stakeholders in a program - participants, other researchers, program staff, other community members, and so on.
Then we put all data in single framework & apply various statistical tools to find out the dynamic on the market.
During the analysis stage, feedback from the stakeholder groups would be compared to determine areas of agreement as well as areas of divergence


