

Key Insights
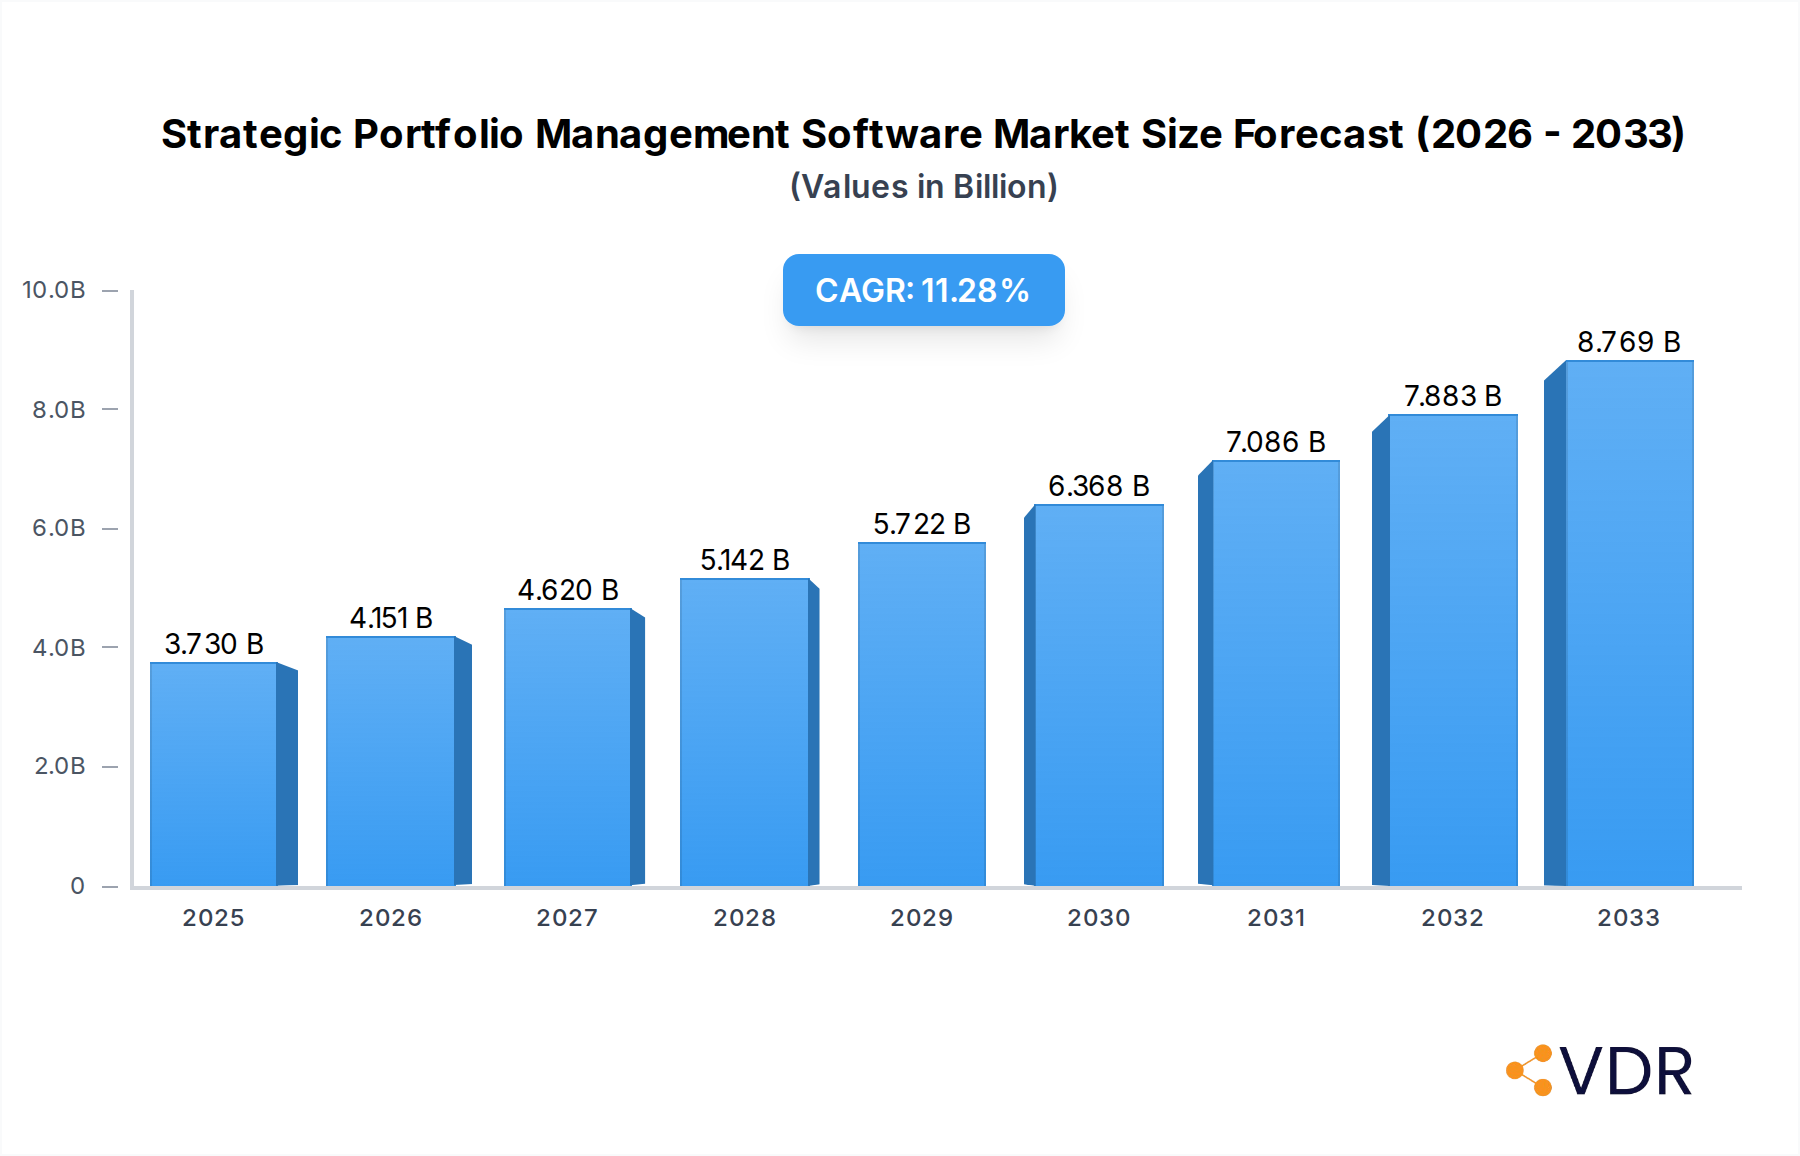
The Strategic Portfolio Management (SPM) Software market is poised for robust expansion, driven by the escalating complexity of global business environments and the imperative for organizations to align their investments with overarching strategic objectives. Valued at $3.73 billion in 2025, the market is projected to grow at a compelling 11.3% Compound Annual Growth Rate (CAGR) through 2033. This significant growth is primarily fueled by widespread digital transformation initiatives, prompting enterprises to seek advanced solutions for optimized resource allocation, risk management, and enhanced project visibility. The increasing need for real-time insights into portfolio performance, coupled with a focus on data-driven decision-making, significantly propels the adoption of SPM software. Emerging trends, such as the integration of Artificial Intelligence (AI) and Machine Learning (ML) for predictive analytics and scenario planning, are reshaping the market landscape, offering more sophisticated tools for strategic foresight. Furthermore, the shift towards agile portfolio management methodologies underscores the demand for flexible and adaptive SPM solutions that can accommodate dynamic business requirements.

Strategic Portfolio Management Software Market Size (In Billion)
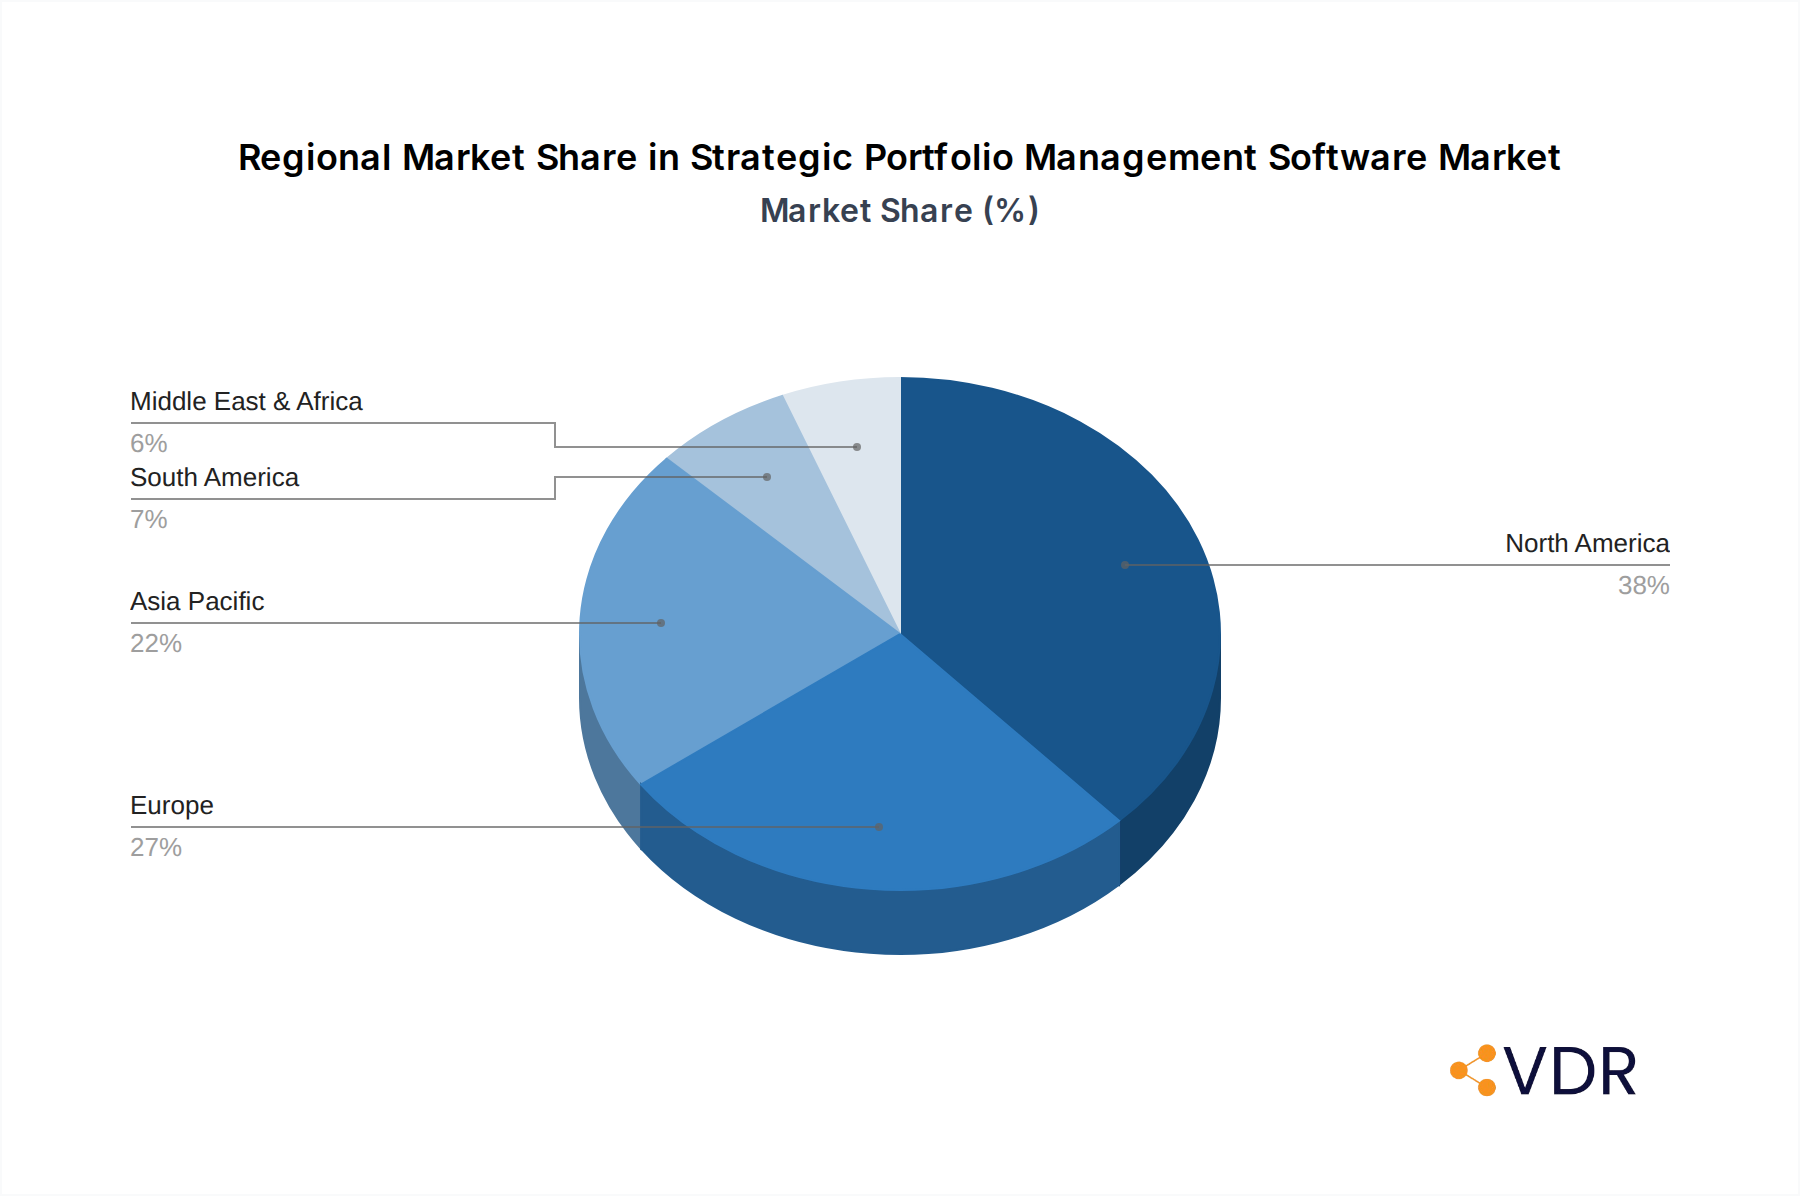
The market's segmentation by application highlights strong adoption across both Large Enterprises and Small & Medium-sized Enterprises (SMEs), with cloud-based solutions increasingly preferred for their scalability, accessibility, and lower total cost of ownership, challenging traditional on-premises deployments. Leading players such as Planisware, ServiceNow, Broadcom, and Software AG are continually innovating, focusing on advanced functionalities and seamless integration with existing enterprise systems. Geographically, North America commands a significant market share due to early technology adoption and substantial R&D investments, while the Asia Pacific region, particularly China and India, is emerging as a high-growth area, driven by rapid industrialization and increasing enterprise IT spending. Despite the promising outlook, the market faces certain restraints, including the substantial initial investment required for implementation, potential data security concerns, particularly for sensitive corporate information, and the inherent challenges associated with organizational change management during software adoption. Addressing these factors will be crucial for sustainable market penetration and growth.
Strategic Portfolio Management Software Company Market Share
Unlock Strategic Advantage: Comprehensive Report on the Strategic Portfolio Management Software Market
Revolutionize your strategic planning and investment decisions with our in-depth analysis of the burgeoning Strategic Portfolio Management Software (SPM) market. This essential report serves as your definitive guide to understanding the sophisticated tools empowering businesses to align projects with overarching strategic objectives, optimize resource allocation, and drive unprecedented ROI. As a critical segment within the broader Project and Portfolio Management (PPM) market (parent market), SPM software is rapidly becoming indispensable for fostering organizational agility and achieving successful digital transformation initiatives. This report leverages extensive data from the Study Period: 2019–2033, with a Base Year of 2025, Estimated Year: 2025, and a Forecast Period: 2025–2033, drawing insights from a Historical Period: 2019–2024.
Stay ahead of the curve in a market projected to reach over $xx billion by 2033, experiencing a robust CAGR of xx%. Discover the key players, emerging trends, and growth opportunities that are reshaping enterprise decision-making.
Strategic Portfolio Management Software Market Dynamics & Structure
The Strategic Portfolio Management (SPM) software market is characterized by moderate concentration, with a few dominant players alongside a vibrant ecosystem of specialized providers. Technological innovation acts as a primary driver, continually pushing boundaries in AI-powered analytics, predictive modeling, and seamless integration with existing enterprise resource planning (ERP) and customer relationship management (CRM) systems. Regulatory frameworks, particularly concerning data privacy and financial reporting, increasingly influence software design and compliance features, fostering trust and standardized practices. Competitive product substitutes, such as advanced project management tools lacking dedicated strategic alignment features, pose a peripheral challenge but reinforce the unique value proposition of comprehensive SPM solutions. End-user demographics are shifting towards a greater demand for intuitive interfaces and mobile accessibility, catering to a new generation of portfolio managers. M&A trends reflect a drive towards consolidating capabilities, with larger technology firms acquiring niche SPM providers to enhance their offerings and expand market reach. For instance, the top five players collectively command an estimated xx% of the market share, indicating a competitive but not monopolistic landscape. M&A deal volumes within the SPM sector reached approximately $xx billion in 2024, signaling aggressive expansion and capability enhancement strategies. Innovation barriers often include the complexity of integrating diverse data sources and the need for significant change management within client organizations, yet overcoming these leads to substantial competitive advantages. The market structure continues to evolve, emphasizing solutions that deliver demonstrable value in strategic alignment and resource optimization.
Strategic Portfolio Management Software Growth Trends & Insights
The Strategic Portfolio Management (SPM) software market is experiencing substantial growth, driven by an escalating need for organizational agility and data-driven decision-making across global enterprises. The market size has evolved remarkably, growing from an estimated $xx billion in 2019 to $xx billion in the Base Year 2025, and is projected to surge to over $xx billion by the end of the Forecast Period 2033, exhibiting a robust Compound Annual Growth Rate (CAGR) of xx%. This impressive growth is fueled by increasing adoption rates, particularly within large enterprises seeking to optimize their investment portfolios and ensure alignment with corporate strategy. Market penetration is steadily rising, especially in industries undergoing rapid digital transformation, where SPM tools are critical for managing complex initiatives and resource allocation.
Technological disruptions, such as the widespread adoption of artificial intelligence (AI) and machine learning (ML) for predictive analytics, are profoundly impacting the SPM landscape. These innovations enable more accurate forecasting of project outcomes, intelligent resource leveling, and automated risk assessment, thereby enhancing the strategic value proposition of SPM software. The integration of advanced analytics allows organizations to move beyond reactive reporting to proactive, foresight-driven strategic adjustments. Furthermore, the shift towards cloud-based solutions has significantly lowered implementation barriers, accelerating adoption among both large enterprises and growing SMEs by offering scalability, flexibility, and reduced infrastructure costs. This has also influenced consumer behavior shifts, as organizations now prioritize ease of deployment, subscription-based models, and continuous feature updates over traditional on-premises perpetual licenses. The demand for solutions that offer seamless integration with existing enterprise ecosystems, provide real-time data visibility, and support collaborative decision-making is at an all-time high. The move towards remote and hybrid work models has further amplified the need for centralized, accessible SPM platforms that facilitate global team coordination and strategic oversight. Organizations are increasingly recognizing SPM not just as a project management tool, but as a critical strategic enabler that directly impacts business outcomes and competitive positioning. This sustained demand, coupled with continuous innovation, underscores the robust growth trajectory of the Strategic Portfolio Management Software market.
Dominant Regions, Countries, or Segments in Strategic Portfolio Management Software
Within the Strategic Portfolio Management Software market, the Cloud-Based Type segment and the Large Enterprises Application segment are overwhelmingly dominant, driving significant market growth and innovation. Geographically, North America consistently leads, followed closely by Europe, while the Asia-Pacific region demonstrates the highest growth potential.
Cloud-Based Solutions Dominance:
- Key Drivers:
- Scalability & Flexibility: Cloud platforms offer unparalleled scalability, allowing organizations to expand or contract usage based on project demands without significant upfront capital investment.
- Reduced TCO: Lower Total Cost of Ownership (TCO) due to eliminated hardware, maintenance, and IT staff requirements.
- Accessibility & Collaboration: Facilitates remote access and real-time collaboration across geographically dispersed teams, critical for modern global enterprises.
- Faster Deployment & Updates: Quick implementation cycles and continuous, seamless software updates ensure users always have access to the latest features and security patches.
- Enhanced Security: Reputable cloud providers invest heavily in robust security infrastructure and compliance certifications, often surpassing what individual enterprises can maintain.
The Cloud-Based segment holds an estimated market share of xx% in 2025, and its growth potential is projected to surpass xx% CAGR through 2033. This dominance is primarily driven by the inherent advantages of cloud computing that align perfectly with the dynamic needs of strategic portfolio management, offering agility and efficiency.
Large Enterprises Application Dominance:
- Key Drivers:
- Complex Portfolio Needs: Large enterprises manage vast, intricate portfolios of projects, programs, and initiatives, requiring sophisticated SPM tools for alignment and optimization.
- Significant Budget Allocations: Substantial capital expenditure and operational budgets enable large organizations to invest in premium SPM solutions.
- Global Operations: Need for standardized processes and centralized oversight across multiple departments, business units, and international locations.
- Strategic Imperatives: Strong focus on strategic alignment, risk management, and ROI optimization for high-stakes investments.
- Digital Transformation Initiatives: SPM software is a cornerstone for orchestrating complex digital transformation programs.
Large Enterprises account for an estimated xx% of the application market, driven by their inherent demand for sophisticated tools that can manage multi-billion dollar portfolios. Their growth potential remains robust, expected to contribute significantly to the overall market expansion as these organizations continue to embrace digital tools for competitive advantage. While SMEs are showing increasing adoption, their smaller budgets and less complex portfolio structures often lead them to simpler or more modular solutions compared to the comprehensive platforms favored by large enterprises. North America, with its high concentration of large corporations, advanced technological infrastructure, and strong investment in digital tools, consistently maintains the largest market share, estimated at xx% of the global SPM market.
Strategic Portfolio Management Software Product Landscape
The Strategic Portfolio Management (SPM) software product landscape is characterized by continuous innovation, focusing on enhanced decision support and integrated capabilities. Modern SPM solutions offer advanced features like AI-driven scenario planning, predictive analytics for risk assessment, and dynamic resource allocation, allowing businesses to model various investment strategies and anticipate outcomes. Applications range from managing IT portfolios and new product development to capital expenditure programs and M&A integration. Key performance metrics include improved strategic alignment (evidenced by reduced project waste by xx%), faster time-to-market for new initiatives (by xx%), and optimized resource utilization (up to xx%). Unique selling propositions often revolve around highly configurable dashboards, real-time data synchronization across disparate systems, and robust governance frameworks. Recent technological advancements emphasize low-code/no-code platforms for custom workflows, augmented reality for data visualization, and blockchain for enhanced data integrity and secure collaboration across complex supply chains.
Key Drivers, Barriers & Challenges in Strategic Portfolio Management Software
The Strategic Portfolio Management Software market is propelled by several potent forces. Technologically, the rapid advancements in Artificial Intelligence (AI) and Machine Learning (ML) enable sophisticated predictive analytics, automating scenario planning and optimizing resource allocation, thereby driving demand for more intelligent SPM tools. Economically, the increasing complexity of global business operations and intense competitive pressures compel organizations to seek solutions that ensure strategic alignment of investments and maximize ROI. Policy-driven factors, such as stricter compliance requirements for financial reporting and project governance, also necessitate robust SPM platforms to maintain transparency and accountability. For instance, the need to manage multi-billion dollar strategic initiatives efficiently across diverse geographic locations fuels widespread adoption.
However, the market faces significant barriers and challenges. Supply chain issues, particularly in geopolitical instability, can disrupt project timelines and resource availability, complicating portfolio planning even with advanced software. Regulatory hurdles, especially across varied international jurisdictions, necessitate complex customization and compliance features within SPM tools, leading to increased development costs and implementation delays that could cost the industry an estimated $xx billion annually in adaptation. Competitive pressures from adjacent markets, like enhanced Project Management (PM) or Enterprise Resource Planning (ERP) systems, which offer basic portfolio functionalities, often dilute the perceived need for dedicated SPM solutions. Furthermore, the substantial initial investment and the steep learning curve associated with comprehensive SPM implementations can deter potential adopters, particularly SMEs, posing a challenge to broader market penetration.
Emerging Opportunities in Strategic Portfolio Management Software
Significant emerging opportunities in the Strategic Portfolio Management Software market are driven by evolving technological landscapes and shifting business paradigms. Untapped markets in developing economies, particularly across Asia-Pacific and Latin America, present substantial growth potential as these regions undergo rapid industrialization and digitalization, necessitating robust tools for strategic investment oversight. Innovative applications are emerging in areas such as sustainability portfolio management, where SPM solutions are used to track and optimize environmental, social, and governance (ESG) initiatives, aligning investments with corporate responsibility goals. The integration of blockchain for enhanced transparency in financial tracking and contract management within portfolios offers another promising avenue. Furthermore, evolving consumer preferences for highly customizable, intuitive, and mobile-friendly interfaces are creating opportunities for vendors to develop user-centric platforms that cater to a diverse range of operational roles, including business analysts, project managers, and executive leadership, thereby expanding the user base.
Growth Accelerators in the Strategic Portfolio Management Software Industry
Several catalysts are driving the long-term growth of the Strategic Portfolio Management Software industry. Technological breakthroughs, particularly in AI-driven predictive analytics and prescriptive guidance, are paramount. These advancements enable SPM tools to move beyond reporting to offering actionable recommendations for optimizing portfolios, thereby significantly enhancing their value proposition. The widespread adoption of cloud-native architectures ensures greater scalability, accessibility, and lower total cost of ownership, accelerating adoption across enterprises of all sizes. Strategic partnerships between SPM vendors and complementary technology providers, such as those specializing in business intelligence or financial planning, create integrated ecosystems that offer comprehensive solutions. This fosters seamless data flow and holistic strategic oversight. Furthermore, aggressive market expansion strategies into sectors previously underserved, like government agencies and non-profit organizations, combined with increased awareness of SPM’s critical role in digital transformation, are fueling sustained demand.
Key Players Shaping the Strategic Portfolio Management Software Market
- Planisware
- Quantium Technology
- Software AG
- Broadcom
- ServiceNow
- Shibumi.com
- Camms
- UMT360
- EOS Software
- Orbus Software
- Mavim
- OnePlan
Notable Milestones in Strategic Portfolio Management Software Sector
- 2020 Q2: Emergence of AI-driven predictive analytics features in leading SPM platforms, enhancing scenario planning and risk assessment capabilities across the industry.
- 2021 Q4: Significant M&A activity, with Broadcom acquiring further capabilities to bolster its SPM offerings, signaling market consolidation and expansion.
- 2022 Q1: Planisware launches new modules focused on advanced resource capacity planning, addressing a critical need for large enterprises managing complex talent pools.
- 2223 Q3: Increased adoption of cloud-native SPM solutions by SMEs, driven by more accessible pricing models and simplified integration capabilities from providers like OnePlan and Camms.
- 2024 Q2: ServiceNow expands its strategic portfolio management functionalities within its core platform, highlighting the convergence of IT Service Management (ITSM) and strategic business planning.
- 2024 Q4: Shibumi.com and other niche players emphasize low-code/no-code platforms for highly customizable strategic planning and execution, empowering business users to tailor solutions without extensive IT involvement.
In-Depth Strategic Portfolio Management Software Market Outlook
The Strategic Portfolio Management Software market is poised for continued robust expansion, driven by an unwavering global imperative for optimized resource allocation and stringent strategic alignment. Future market potential is immense, fueled by the accelerating pace of digital transformation across all industries, compelling organizations to invest in sophisticated tools that can orchestrate complex, multi-billion dollar initiatives. The increasing integration of Artificial Intelligence and Machine Learning into SPM platforms will further unlock prescriptive analytics capabilities, transforming decision-making from reactive to highly proactive. Strategic opportunities lie in expanding into nascent markets, developing highly specialized vertical-specific solutions, and leveraging strategic partnerships to offer integrated enterprise-wide platforms. With a projected market value exceeding $xx billion by 2033, the SPM sector represents a cornerstone technology for achieving business agility and sustained competitive advantage in an ever-evolving global economy.
Strategic Portfolio Management Software Segmentation
-
1. Application
- 1.1. Large Enterprises
- 1.2. SMEs
-
2. Types
- 2.1. Cloud Based
- 2.2. On-premises
Strategic Portfolio Management Software Segmentation By Geography
-
1. North America
- 1.1. United States
- 1.2. Canada
- 1.3. Mexico
-
2. South America
- 2.1. Brazil
- 2.2. Argentina
- 2.3. Rest of South America
-
3. Europe
- 3.1. United Kingdom
- 3.2. Germany
- 3.3. France
- 3.4. Italy
- 3.5. Spain
- 3.6. Russia
- 3.7. Benelux
- 3.8. Nordics
- 3.9. Rest of Europe
-
4. Middle East & Africa
- 4.1. Turkey
- 4.2. Israel
- 4.3. GCC
- 4.4. North Africa
- 4.5. South Africa
- 4.6. Rest of Middle East & Africa
-
5. Asia Pacific
- 5.1. China
- 5.2. India
- 5.3. Japan
- 5.4. South Korea
- 5.5. ASEAN
- 5.6. Oceania
- 5.7. Rest of Asia Pacific
Strategic Portfolio Management Software Regional Market Share
Geographic Coverage of Strategic Portfolio Management Software
Strategic Portfolio Management Software REPORT HIGHLIGHTS
| Aspects | Details |
|---|---|
| Study Period | 2020-2034 |
| Base Year | 2025 |
| Estimated Year | 2026 |
| Forecast Period | 2026-2034 |
| Historical Period | 2020-2025 |
| Growth Rate | CAGR of 11.3% from 2020-2034 |
| Segmentation |
|
Table of Contents
- 1. Introduction
- 1.1. Research Scope
- 1.2. Market Segmentation
- 1.3. Research Objective
- 1.4. Definitions and Assumptions
- 2. Executive Summary
- 2.1. Market Snapshot
- 3. Market Dynamics
- 3.1. Market Drivers
- 3.2. Market Restrains
- 3.3. Market Trends
- 3.4. Market Opportunities
- 4. Market Factor Analysis
- 4.1. Porters Five Forces
- 4.1.1. Bargaining Power of Suppliers
- 4.1.2. Bargaining Power of Buyers
- 4.1.3. Threat of New Entrants
- 4.1.4. Threat of Substitutes
- 4.1.5. Competitive Rivalry
- 4.2. PESTEL analysis
- 4.3. BCG Analysis
- 4.3.1. Stars (High Growth, High Market Share)
- 4.3.2. Cash Cows (Low Growth, High Market Share)
- 4.3.3. Question Mark (High Growth, Low Market Share)
- 4.3.4. Dogs (Low Growth, Low Market Share)
- 4.4. Ansoff Matrix Analysis
- 4.5. Supply Chain Analysis
- 4.6. Regulatory Landscape
- 4.7. Current Market Potential and Opportunity Assessment (TAM–SAM–SOM Framework)
- 4.8. VDR Analyst Note
- 4.1. Porters Five Forces
- 5. Market Analysis, Insights and Forecast 2021-2033
- 5.1. Market Analysis, Insights and Forecast - by Application
- 5.1.1. Large Enterprises
- 5.1.2. SMEs
- 5.2. Market Analysis, Insights and Forecast - by Types
- 5.2.1. Cloud Based
- 5.2.2. On-premises
- 5.3. Market Analysis, Insights and Forecast - by Region
- 5.3.1. North America
- 5.3.2. South America
- 5.3.3. Europe
- 5.3.4. Middle East & Africa
- 5.3.5. Asia Pacific
- 5.1. Market Analysis, Insights and Forecast - by Application
- 6. Global Strategic Portfolio Management Software Analysis, Insights and Forecast, 2021-2033
- 6.1. Market Analysis, Insights and Forecast - by Application
- 6.1.1. Large Enterprises
- 6.1.2. SMEs
- 6.2. Market Analysis, Insights and Forecast - by Types
- 6.2.1. Cloud Based
- 6.2.2. On-premises
- 6.1. Market Analysis, Insights and Forecast - by Application
- 7. North America Strategic Portfolio Management Software Analysis, Insights and Forecast, 2021-2033
- 7.1. Market Analysis, Insights and Forecast - by Application
- 7.1.1. Large Enterprises
- 7.1.2. SMEs
- 7.2. Market Analysis, Insights and Forecast - by Types
- 7.2.1. Cloud Based
- 7.2.2. On-premises
- 7.1. Market Analysis, Insights and Forecast - by Application
- 8. South America Strategic Portfolio Management Software Analysis, Insights and Forecast, 2021-2033
- 8.1. Market Analysis, Insights and Forecast - by Application
- 8.1.1. Large Enterprises
- 8.1.2. SMEs
- 8.2. Market Analysis, Insights and Forecast - by Types
- 8.2.1. Cloud Based
- 8.2.2. On-premises
- 8.1. Market Analysis, Insights and Forecast - by Application
- 9. Europe Strategic Portfolio Management Software Analysis, Insights and Forecast, 2021-2033
- 9.1. Market Analysis, Insights and Forecast - by Application
- 9.1.1. Large Enterprises
- 9.1.2. SMEs
- 9.2. Market Analysis, Insights and Forecast - by Types
- 9.2.1. Cloud Based
- 9.2.2. On-premises
- 9.1. Market Analysis, Insights and Forecast - by Application
- 10. Middle East & Africa Strategic Portfolio Management Software Analysis, Insights and Forecast, 2021-2033
- 10.1. Market Analysis, Insights and Forecast - by Application
- 10.1.1. Large Enterprises
- 10.1.2. SMEs
- 10.2. Market Analysis, Insights and Forecast - by Types
- 10.2.1. Cloud Based
- 10.2.2. On-premises
- 10.1. Market Analysis, Insights and Forecast - by Application
- 11. Asia Pacific Strategic Portfolio Management Software Analysis, Insights and Forecast, 2021-2033
- 11.1. Market Analysis, Insights and Forecast - by Application
- 11.1.1. Large Enterprises
- 11.1.2. SMEs
- 11.2. Market Analysis, Insights and Forecast - by Types
- 11.2.1. Cloud Based
- 11.2.2. On-premises
- 11.1. Market Analysis, Insights and Forecast - by Application
- 12. Competitive Analysis
- 12.1. Company Profiles
- 12.1.1 Planisware
- 12.1.1.1. Company Overview
- 12.1.1.2. Products
- 12.1.1.3. Company Financials
- 12.1.1.4. SWOT Analysis
- 12.1.2 Quantium Technology
- 12.1.2.1. Company Overview
- 12.1.2.2. Products
- 12.1.2.3. Company Financials
- 12.1.2.4. SWOT Analysis
- 12.1.3 Software AG
- 12.1.3.1. Company Overview
- 12.1.3.2. Products
- 12.1.3.3. Company Financials
- 12.1.3.4. SWOT Analysis
- 12.1.4 Broadcom
- 12.1.4.1. Company Overview
- 12.1.4.2. Products
- 12.1.4.3. Company Financials
- 12.1.4.4. SWOT Analysis
- 12.1.5 ServiceNow
- 12.1.5.1. Company Overview
- 12.1.5.2. Products
- 12.1.5.3. Company Financials
- 12.1.5.4. SWOT Analysis
- 12.1.6 Shibumi.com
- 12.1.6.1. Company Overview
- 12.1.6.2. Products
- 12.1.6.3. Company Financials
- 12.1.6.4. SWOT Analysis
- 12.1.7 Camms
- 12.1.7.1. Company Overview
- 12.1.7.2. Products
- 12.1.7.3. Company Financials
- 12.1.7.4. SWOT Analysis
- 12.1.8 UMT360
- 12.1.8.1. Company Overview
- 12.1.8.2. Products
- 12.1.8.3. Company Financials
- 12.1.8.4. SWOT Analysis
- 12.1.9 EOS Software
- 12.1.9.1. Company Overview
- 12.1.9.2. Products
- 12.1.9.3. Company Financials
- 12.1.9.4. SWOT Analysis
- 12.1.10 Orbus Software
- 12.1.10.1. Company Overview
- 12.1.10.2. Products
- 12.1.10.3. Company Financials
- 12.1.10.4. SWOT Analysis
- 12.1.11 Mavim
- 12.1.11.1. Company Overview
- 12.1.11.2. Products
- 12.1.11.3. Company Financials
- 12.1.11.4. SWOT Analysis
- 12.1.12 OnePlan
- 12.1.12.1. Company Overview
- 12.1.12.2. Products
- 12.1.12.3. Company Financials
- 12.1.12.4. SWOT Analysis
- 12.1.1 Planisware
- 12.2. Market Entropy
- 12.2.1 Company's Key Areas Served
- 12.2.2 Recent Developments
- 12.3. Company Market Share Analysis 2025
- 12.3.1 Top 5 Companies Market Share Analysis
- 12.3.2 Top 3 Companies Market Share Analysis
- 12.4. List of Potential Customers
- 13. Research Methodology
List of Figures
- Figure 1: Global Strategic Portfolio Management Software Revenue Breakdown (undefined, %) by Region 2025 & 2033
- Figure 2: North America Strategic Portfolio Management Software Revenue (undefined), by Application 2025 & 2033
- Figure 3: North America Strategic Portfolio Management Software Revenue Share (%), by Application 2025 & 2033
- Figure 4: North America Strategic Portfolio Management Software Revenue (undefined), by Types 2025 & 2033
- Figure 5: North America Strategic Portfolio Management Software Revenue Share (%), by Types 2025 & 2033
- Figure 6: North America Strategic Portfolio Management Software Revenue (undefined), by Country 2025 & 2033
- Figure 7: North America Strategic Portfolio Management Software Revenue Share (%), by Country 2025 & 2033
- Figure 8: South America Strategic Portfolio Management Software Revenue (undefined), by Application 2025 & 2033
- Figure 9: South America Strategic Portfolio Management Software Revenue Share (%), by Application 2025 & 2033
- Figure 10: South America Strategic Portfolio Management Software Revenue (undefined), by Types 2025 & 2033
- Figure 11: South America Strategic Portfolio Management Software Revenue Share (%), by Types 2025 & 2033
- Figure 12: South America Strategic Portfolio Management Software Revenue (undefined), by Country 2025 & 2033
- Figure 13: South America Strategic Portfolio Management Software Revenue Share (%), by Country 2025 & 2033
- Figure 14: Europe Strategic Portfolio Management Software Revenue (undefined), by Application 2025 & 2033
- Figure 15: Europe Strategic Portfolio Management Software Revenue Share (%), by Application 2025 & 2033
- Figure 16: Europe Strategic Portfolio Management Software Revenue (undefined), by Types 2025 & 2033
- Figure 17: Europe Strategic Portfolio Management Software Revenue Share (%), by Types 2025 & 2033
- Figure 18: Europe Strategic Portfolio Management Software Revenue (undefined), by Country 2025 & 2033
- Figure 19: Europe Strategic Portfolio Management Software Revenue Share (%), by Country 2025 & 2033
- Figure 20: Middle East & Africa Strategic Portfolio Management Software Revenue (undefined), by Application 2025 & 2033
- Figure 21: Middle East & Africa Strategic Portfolio Management Software Revenue Share (%), by Application 2025 & 2033
- Figure 22: Middle East & Africa Strategic Portfolio Management Software Revenue (undefined), by Types 2025 & 2033
- Figure 23: Middle East & Africa Strategic Portfolio Management Software Revenue Share (%), by Types 2025 & 2033
- Figure 24: Middle East & Africa Strategic Portfolio Management Software Revenue (undefined), by Country 2025 & 2033
- Figure 25: Middle East & Africa Strategic Portfolio Management Software Revenue Share (%), by Country 2025 & 2033
- Figure 26: Asia Pacific Strategic Portfolio Management Software Revenue (undefined), by Application 2025 & 2033
- Figure 27: Asia Pacific Strategic Portfolio Management Software Revenue Share (%), by Application 2025 & 2033
- Figure 28: Asia Pacific Strategic Portfolio Management Software Revenue (undefined), by Types 2025 & 2033
- Figure 29: Asia Pacific Strategic Portfolio Management Software Revenue Share (%), by Types 2025 & 2033
- Figure 30: Asia Pacific Strategic Portfolio Management Software Revenue (undefined), by Country 2025 & 2033
- Figure 31: Asia Pacific Strategic Portfolio Management Software Revenue Share (%), by Country 2025 & 2033
List of Tables
- Table 1: Global Strategic Portfolio Management Software Revenue undefined Forecast, by Application 2020 & 2033
- Table 2: Global Strategic Portfolio Management Software Revenue undefined Forecast, by Types 2020 & 2033
- Table 3: Global Strategic Portfolio Management Software Revenue undefined Forecast, by Region 2020 & 2033
- Table 4: Global Strategic Portfolio Management Software Revenue undefined Forecast, by Application 2020 & 2033
- Table 5: Global Strategic Portfolio Management Software Revenue undefined Forecast, by Types 2020 & 2033
- Table 6: Global Strategic Portfolio Management Software Revenue undefined Forecast, by Country 2020 & 2033
- Table 7: United States Strategic Portfolio Management Software Revenue (undefined) Forecast, by Application 2020 & 2033
- Table 8: Canada Strategic Portfolio Management Software Revenue (undefined) Forecast, by Application 2020 & 2033
- Table 9: Mexico Strategic Portfolio Management Software Revenue (undefined) Forecast, by Application 2020 & 2033
- Table 10: Global Strategic Portfolio Management Software Revenue undefined Forecast, by Application 2020 & 2033
- Table 11: Global Strategic Portfolio Management Software Revenue undefined Forecast, by Types 2020 & 2033
- Table 12: Global Strategic Portfolio Management Software Revenue undefined Forecast, by Country 2020 & 2033
- Table 13: Brazil Strategic Portfolio Management Software Revenue (undefined) Forecast, by Application 2020 & 2033
- Table 14: Argentina Strategic Portfolio Management Software Revenue (undefined) Forecast, by Application 2020 & 2033
- Table 15: Rest of South America Strategic Portfolio Management Software Revenue (undefined) Forecast, by Application 2020 & 2033
- Table 16: Global Strategic Portfolio Management Software Revenue undefined Forecast, by Application 2020 & 2033
- Table 17: Global Strategic Portfolio Management Software Revenue undefined Forecast, by Types 2020 & 2033
- Table 18: Global Strategic Portfolio Management Software Revenue undefined Forecast, by Country 2020 & 2033
- Table 19: United Kingdom Strategic Portfolio Management Software Revenue (undefined) Forecast, by Application 2020 & 2033
- Table 20: Germany Strategic Portfolio Management Software Revenue (undefined) Forecast, by Application 2020 & 2033
- Table 21: France Strategic Portfolio Management Software Revenue (undefined) Forecast, by Application 2020 & 2033
- Table 22: Italy Strategic Portfolio Management Software Revenue (undefined) Forecast, by Application 2020 & 2033
- Table 23: Spain Strategic Portfolio Management Software Revenue (undefined) Forecast, by Application 2020 & 2033
- Table 24: Russia Strategic Portfolio Management Software Revenue (undefined) Forecast, by Application 2020 & 2033
- Table 25: Benelux Strategic Portfolio Management Software Revenue (undefined) Forecast, by Application 2020 & 2033
- Table 26: Nordics Strategic Portfolio Management Software Revenue (undefined) Forecast, by Application 2020 & 2033
- Table 27: Rest of Europe Strategic Portfolio Management Software Revenue (undefined) Forecast, by Application 2020 & 2033
- Table 28: Global Strategic Portfolio Management Software Revenue undefined Forecast, by Application 2020 & 2033
- Table 29: Global Strategic Portfolio Management Software Revenue undefined Forecast, by Types 2020 & 2033
- Table 30: Global Strategic Portfolio Management Software Revenue undefined Forecast, by Country 2020 & 2033
- Table 31: Turkey Strategic Portfolio Management Software Revenue (undefined) Forecast, by Application 2020 & 2033
- Table 32: Israel Strategic Portfolio Management Software Revenue (undefined) Forecast, by Application 2020 & 2033
- Table 33: GCC Strategic Portfolio Management Software Revenue (undefined) Forecast, by Application 2020 & 2033
- Table 34: North Africa Strategic Portfolio Management Software Revenue (undefined) Forecast, by Application 2020 & 2033
- Table 35: South Africa Strategic Portfolio Management Software Revenue (undefined) Forecast, by Application 2020 & 2033
- Table 36: Rest of Middle East & Africa Strategic Portfolio Management Software Revenue (undefined) Forecast, by Application 2020 & 2033
- Table 37: Global Strategic Portfolio Management Software Revenue undefined Forecast, by Application 2020 & 2033
- Table 38: Global Strategic Portfolio Management Software Revenue undefined Forecast, by Types 2020 & 2033
- Table 39: Global Strategic Portfolio Management Software Revenue undefined Forecast, by Country 2020 & 2033
- Table 40: China Strategic Portfolio Management Software Revenue (undefined) Forecast, by Application 2020 & 2033
- Table 41: India Strategic Portfolio Management Software Revenue (undefined) Forecast, by Application 2020 & 2033
- Table 42: Japan Strategic Portfolio Management Software Revenue (undefined) Forecast, by Application 2020 & 2033
- Table 43: South Korea Strategic Portfolio Management Software Revenue (undefined) Forecast, by Application 2020 & 2033
- Table 44: ASEAN Strategic Portfolio Management Software Revenue (undefined) Forecast, by Application 2020 & 2033
- Table 45: Oceania Strategic Portfolio Management Software Revenue (undefined) Forecast, by Application 2020 & 2033
- Table 46: Rest of Asia Pacific Strategic Portfolio Management Software Revenue (undefined) Forecast, by Application 2020 & 2033
Frequently Asked Questions
1. What is the projected Compound Annual Growth Rate (CAGR) of the Strategic Portfolio Management Software?
The projected CAGR is approximately 11.3%.
2. Which companies are prominent players in the Strategic Portfolio Management Software?
Key companies in the market include Planisware, Quantium Technology, Software AG, Broadcom, ServiceNow, Shibumi.com, Camms, UMT360, EOS Software, Orbus Software, Mavim, OnePlan.
3. What are the main segments of the Strategic Portfolio Management Software?
The market segments include Application, Types.
4. Can you provide details about the market size?
The market size is estimated to be USD XXX N/A as of 2022.
5. What are some drivers contributing to market growth?
N/A
6. What are the notable trends driving market growth?
N/A
7. Are there any restraints impacting market growth?
N/A
8. Can you provide examples of recent developments in the market?
N/A
9. What pricing options are available for accessing the report?
Pricing options include single-user, multi-user, and enterprise licenses priced at USD 4900.00, USD 7350.00, and USD 9800.00 respectively.
10. Is the market size provided in terms of value or volume?
The market size is provided in terms of value, measured in N/A.
11. Are there any specific market keywords associated with the report?
Yes, the market keyword associated with the report is "Strategic Portfolio Management Software," which aids in identifying and referencing the specific market segment covered.
12. How do I determine which pricing option suits my needs best?
The pricing options vary based on user requirements and access needs. Individual users may opt for single-user licenses, while businesses requiring broader access may choose multi-user or enterprise licenses for cost-effective access to the report.
13. Are there any additional resources or data provided in the Strategic Portfolio Management Software report?
While the report offers comprehensive insights, it's advisable to review the specific contents or supplementary materials provided to ascertain if additional resources or data are available.
14. How can I stay updated on further developments or reports in the Strategic Portfolio Management Software?
To stay informed about further developments, trends, and reports in the Strategic Portfolio Management Software, consider subscribing to industry newsletters, following relevant companies and organizations, or regularly checking reputable industry news sources and publications.
Methodology
Step 1 - Identification of Relevant Samples Size from Population Database


Step 2 - Approaches for Defining Global Market Size (Value, Volume* & Price*)

Note*: In applicable scenarios
Step 3 - Data Sources
Primary Research
- Web Analytics
- Survey Reports
- Research Institute
- Latest Research Reports
- Opinion Leaders
Secondary Research
- Annual Reports
- White Paper
- Latest Press Release
- Industry Association
- Paid Database
- Investor Presentations

Step 4 - Data Triangulation
Involves using different sources of information in order to increase the validity of a study
These sources are likely to be stakeholders in a program - participants, other researchers, program staff, other community members, and so on.
Then we put all data in single framework & apply various statistical tools to find out the dynamic on the market.
During the analysis stage, feedback from the stakeholder groups would be compared to determine areas of agreement as well as areas of divergence