

Key Insights
The global Special Cables for Wind Energy market is experiencing significant expansion, propelled by the surging demand for renewable energy and the rapid development of offshore wind farms. The market, valued at $10.8 billion in the base year 2025, is projected to grow at a Compound Annual Growth Rate (CAGR) of 12.06% from 2025 to 2033. This growth is attributed to increasing global investments in wind energy infrastructure, technological advancements in turbine efficiency, and supportive government policies. Key market segments include high-voltage, medium-voltage, and low-voltage cables tailored for wind turbine systems. The competitive landscape features major international players such as Nexans, Prysmian Group, and Sumitomo Electric, alongside specialized manufacturers. Growth is anticipated to be strong in regions with substantial wind energy projects, including North America, Europe, and Asia-Pacific.
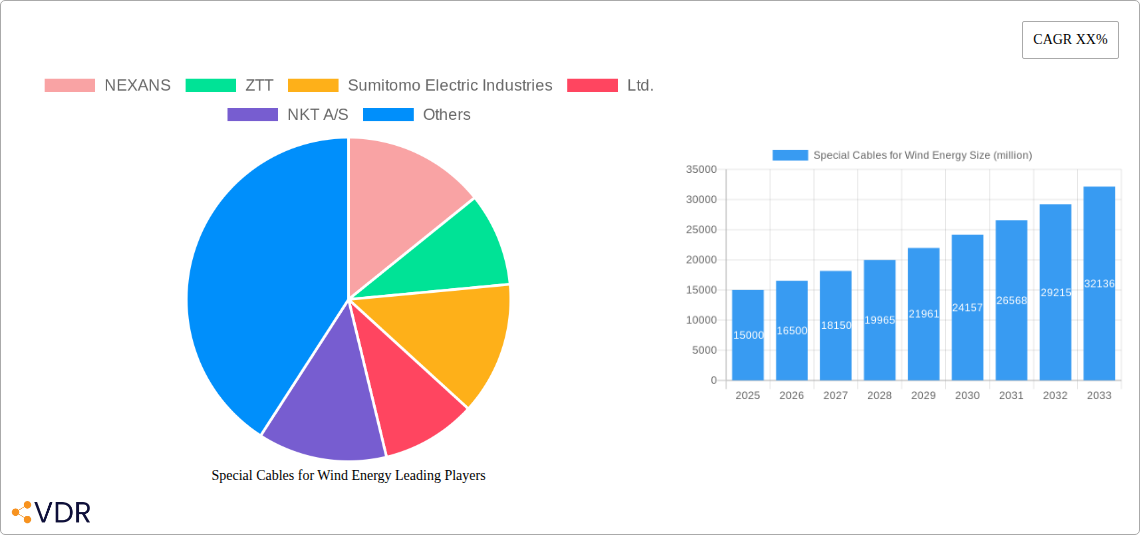
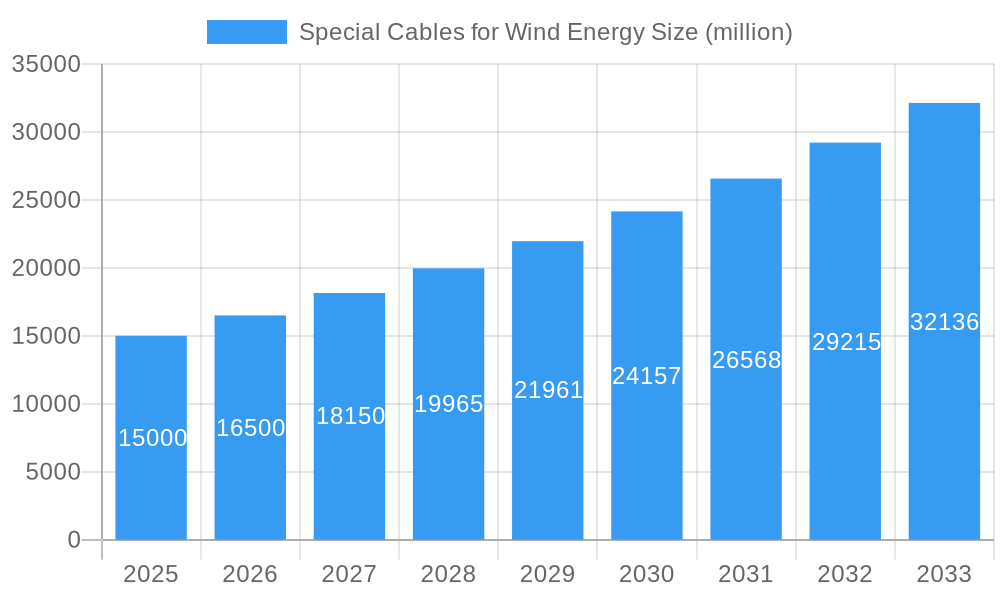
Special Cables for Wind Energy Market Size (In Billion)
While the market shows robust growth, challenges such as high initial investment costs, potential supply chain disruptions, and the requirement for specialized, durable cables resistant to harsh environments are present. Price volatility of raw materials and the complexities of offshore installations can also impact profitability. Despite these hurdles, the long-term outlook remains positive, driven by the global shift towards cleaner energy and continuous innovation in wind turbine and cable technology. Developing sustainable and cost-effective solutions will be critical for sustained market growth.
Special Cables for Wind Energy Company Market Share
This report offers a detailed analysis of the Special Cables for Wind Energy market, covering dynamics, growth trends, regional insights, product segments, and key stakeholders. The analysis period spans 2019-2033, with 2025 as the base year and 2025-2033 as the forecast period. This study is essential for industry professionals, investors, and strategic decision-makers targeting opportunities in this dynamic sector. The market is a specialized segment within the broader power cable market, focusing on wind energy applications.
Special Cables for Wind Energy Market Dynamics & Structure
This section analyzes the competitive landscape, technological advancements, regulatory environment, and market trends influencing the special cables for wind energy market. The report delves into market concentration, identifying key players and their respective market shares. It examines technological innovation drivers, such as the development of high-voltage direct current (HVDC) cables and improved materials, along with the impact of regulatory frameworks on market growth. The analysis also considers the influence of competitive product substitutes and evolving end-user demographics (onshore vs. offshore wind farms). Finally, it explores mergers and acquisitions (M&A) activity within the industry, quantifying deal volumes and analyzing their impact on market consolidation.
- Market Concentration: High (xx%), with top 5 players holding xx% market share in 2024.
- Technological Innovation: Focus on HVDC cables, increased capacity, improved insulation materials. Significant barriers to entry due to high R&D costs.
- Regulatory Framework: Stringent safety and performance standards driving innovation and market segmentation.
- M&A Activity: xx deals completed between 2019-2024, resulting in xx% increase in market consolidation.
- Competitive Substitutes: Limited, primarily focused on alternative transmission technologies.
- End-User Demographics: Shift towards larger, offshore wind farms driving demand for specialized cables.
Special Cables for Wind Energy Growth Trends & Insights
This section provides a detailed analysis of the market size evolution, adoption rates, technological disruptions, and consumer behavior shifts in the special cables for wind energy market. Leveraging both quantitative and qualitative data, the report projects market growth trajectory, highlighting key factors contributing to market expansion. The analysis encompasses historical data (2019-2024) and future projections (2025-2033), providing comprehensive insights into the market's evolution. Specific metrics, such as the Compound Annual Growth Rate (CAGR) and market penetration rates, are provided for deeper insights. The report considers factors like increased renewable energy mandates, growing global energy demand and the shift towards offshore wind projects to determine market growth factors.
- Market Size (2024): xx million units
- Projected Market Size (2033): xx million units
- CAGR (2025-2033): xx%
- Market Penetration: xx% in 2024, projected to reach xx% by 2033.
Dominant Regions, Countries, or Segments in Special Cables for Wind Energy
This section identifies the leading regions, countries, and segments driving market growth. The analysis leverages both qualitative and quantitative data to pinpoint key factors contributing to regional dominance, including economic policies supporting renewable energy development, infrastructure investment in wind energy projects, and the presence of major wind farm installations. The report explores market share and growth potential for each region/country/segment to illustrate their prominence in the global market.
- Leading Region (2024): Europe (xx% market share). Key drivers: supportive government policies, established wind energy infrastructure, high renewable energy targets.
- Leading Country (2024): China (xx% market share). Key drivers: massive investment in wind energy, growing energy demand, government support.
- Leading Segment (2024): Offshore wind cables (xx% market share). Key drivers: increased focus on offshore wind projects, longer cable lengths requiring specialized technology.
Special Cables for Wind Energy Product Landscape
This section details product innovations, applications, and performance metrics of special cables used in wind energy. The report highlights unique selling propositions (USPs) of various cable types, emphasizing technological advancements that improve efficiency, reliability, and lifespan. Emphasis is placed on the differences between cable types used in onshore vs. offshore wind energy applications.
The market offers a diverse range of products, including high-voltage AC and DC cables, fiber optic cables for communication and monitoring, and specialized subsea cables for offshore installations. These cables are designed with enhanced insulation, durability, and resistance to harsh environmental conditions. Continuous innovation focuses on improving weight, flexibility, and resistance to corrosion and fatigue.
Key Drivers, Barriers & Challenges in Special Cables for Wind Energy
This section outlines the key factors driving market growth, such as technological advancements, favorable government policies, and rising global energy demand. It also examines potential restraints, including high raw material costs, supply chain disruptions, and intense competition. Quantifiable impacts are included where available.
Key Drivers:
- Growing demand for renewable energy
- Increasing investments in wind energy projects globally
- Technological advancements leading to higher efficiency and capacity
- Government incentives and subsidies for renewable energy adoption
Key Barriers & Challenges:
- Fluctuations in raw material prices (e.g., copper) impacting production costs.
- Supply chain complexities and potential disruptions affecting delivery times.
- Stringent safety and regulatory requirements increasing development and certification costs.
- Intense competition among major cable manufacturers leading to price pressures.
Emerging Opportunities in Special Cables for Wind Energy
This section highlights emerging opportunities, including untapped markets, innovative applications, and evolving consumer preferences within the wind energy sector. It discusses opportunities in developing economies and the potential for specialized cable solutions to meet the demands of increasingly large and complex wind farms.
- Expansion into emerging markets with high wind energy potential
- Development of innovative cable technologies for next-generation wind turbines
- Growing demand for smart grid integration and digital monitoring capabilities
- Increased focus on lifecycle management and sustainability
Growth Accelerators in the Special Cables for Wind Energy Industry
This section details the catalysts driving long-term growth, emphasizing technological breakthroughs, strategic partnerships, and market expansion strategies. It highlights the potential for increased automation in cable manufacturing and the development of sustainable and eco-friendly cable materials to drive growth.
Technological advancements, including the development of high-temperature superconductor (HTS) cables and the incorporation of smart sensors for improved monitoring and maintenance, will be significant catalysts for long-term market growth. Strategic collaborations between cable manufacturers, wind turbine manufacturers, and energy companies will facilitate the wider adoption of innovative cable solutions.
Key Players Shaping the Special Cables for Wind Energy Market
- NEXANS
- ZTT
- Sumitomo Electric Industries, Ltd.
- NKT A/S
- HENGTONG GROUP CO.,LTD.
- LEONI
- Fujikura Ltd.
- JDR Cable Systems Ltd.
- Prysmian Group
- LS Cable & System Ltd.
- FURUKAWA ELECTRIC CO.,LTD
- Hellenic Cables
- SAB Cable
- Tratos UK Ltd
- HELUKABEL
- SSGcable
- Jinbei Electrician
- HEW-Kabel
- Nexans AmerCable Systems
- LS Cable & System
- Habia
- Amokabel
- Thermo Cables
- Remee Wire & Cable
- American Wire Group
Notable Milestones in Special Cables for Wind Energy Sector
- 2020: Launch of a new generation of HVDC cable with increased capacity by Nexans.
- 2021: Acquisition of a smaller cable manufacturer specializing in offshore wind cables by Prysmian Group.
- 2022: Successful installation of the world's longest HVDC submarine cable for an offshore wind farm project by NKT A/S.
- 2023: Introduction of a new bio-based cable insulation material by Sumitomo Electric Industries, Ltd.
- 2024: Partnership between major cable manufacturer and wind turbine manufacturer to develop next-generation cable technology for offshore wind farms.
In-Depth Special Cables for Wind Energy Market Outlook
The special cables for wind energy market is poised for significant growth over the forecast period, driven by the global expansion of wind energy capacity, technological advancements leading to higher efficiency and reliability, and supportive government policies promoting renewable energy adoption. Strategic partnerships and collaborations will be crucial for market players to capitalize on emerging opportunities and drive innovation. The market’s future hinges on tackling supply chain vulnerabilities and navigating the complexities of large-scale offshore wind projects. The continued development of innovative cable technologies and materials will be vital to meet the growing demand for reliable and sustainable energy solutions.
Special Cables for Wind Energy Segmentation
-
1. Application
- 1.1. Offshore Power Plant
- 1.2. Onshore Power Plant
-
2. Types
- 2.1. Power Cable
- 2.2. Control Cable
- 2.3. Communication Cable
- 2.4. Catenary Cable
- 2.5. Others
Special Cables for Wind Energy Segmentation By Geography
-
1. North America
- 1.1. United States
- 1.2. Canada
- 1.3. Mexico
-
2. South America
- 2.1. Brazil
- 2.2. Argentina
- 2.3. Rest of South America
-
3. Europe
- 3.1. United Kingdom
- 3.2. Germany
- 3.3. France
- 3.4. Italy
- 3.5. Spain
- 3.6. Russia
- 3.7. Benelux
- 3.8. Nordics
- 3.9. Rest of Europe
-
4. Middle East & Africa
- 4.1. Turkey
- 4.2. Israel
- 4.3. GCC
- 4.4. North Africa
- 4.5. South Africa
- 4.6. Rest of Middle East & Africa
-
5. Asia Pacific
- 5.1. China
- 5.2. India
- 5.3. Japan
- 5.4. South Korea
- 5.5. ASEAN
- 5.6. Oceania
- 5.7. Rest of Asia Pacific
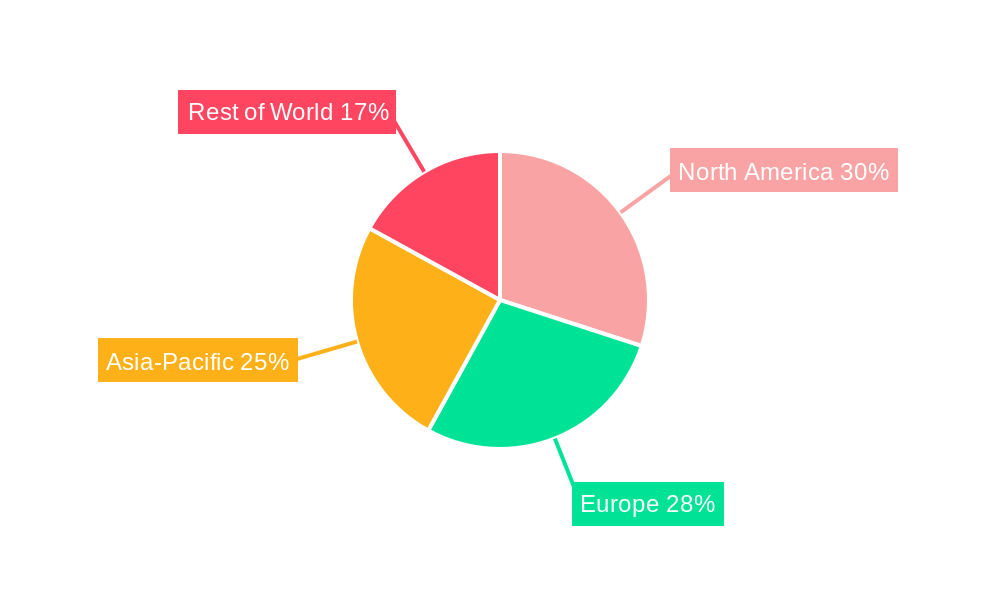
Special Cables for Wind Energy Regional Market Share
Geographic Coverage of Special Cables for Wind Energy
Special Cables for Wind Energy REPORT HIGHLIGHTS
| Aspects | Details |
|---|---|
| Study Period | 2020-2034 |
| Base Year | 2025 |
| Estimated Year | 2026 |
| Forecast Period | 2026-2034 |
| Historical Period | 2020-2025 |
| Growth Rate | CAGR of 12.06% from 2020-2034 |
| Segmentation |
|
Table of Contents
- 1. Introduction
- 1.1. Research Scope
- 1.2. Market Segmentation
- 1.3. Research Objective
- 1.4. Definitions and Assumptions
- 2. Executive Summary
- 2.1. Market Snapshot
- 3. Market Dynamics
- 3.1. Market Drivers
- 3.2. Market Restrains
- 3.3. Market Trends
- 3.4. Market Opportunities
- 4. Market Factor Analysis
- 4.1. Porters Five Forces
- 4.1.1. Bargaining Power of Suppliers
- 4.1.2. Bargaining Power of Buyers
- 4.1.3. Threat of New Entrants
- 4.1.4. Threat of Substitutes
- 4.1.5. Competitive Rivalry
- 4.2. PESTEL analysis
- 4.3. BCG Analysis
- 4.3.1. Stars (High Growth, High Market Share)
- 4.3.2. Cash Cows (Low Growth, High Market Share)
- 4.3.3. Question Mark (High Growth, Low Market Share)
- 4.3.4. Dogs (Low Growth, Low Market Share)
- 4.4. Ansoff Matrix Analysis
- 4.5. Supply Chain Analysis
- 4.6. Regulatory Landscape
- 4.7. Current Market Potential and Opportunity Assessment (TAM–SAM–SOM Framework)
- 4.8. VDR Analyst Note
- 4.1. Porters Five Forces
- 5. Market Analysis, Insights and Forecast 2021-2033
- 5.1. Market Analysis, Insights and Forecast - by Application
- 5.1.1. Offshore Power Plant
- 5.1.2. Onshore Power Plant
- 5.2. Market Analysis, Insights and Forecast - by Types
- 5.2.1. Power Cable
- 5.2.2. Control Cable
- 5.2.3. Communication Cable
- 5.2.4. Catenary Cable
- 5.2.5. Others
- 5.3. Market Analysis, Insights and Forecast - by Region
- 5.3.1. North America
- 5.3.2. South America
- 5.3.3. Europe
- 5.3.4. Middle East & Africa
- 5.3.5. Asia Pacific
- 5.1. Market Analysis, Insights and Forecast - by Application
- 6. Global Special Cables for Wind Energy Analysis, Insights and Forecast, 2021-2033
- 6.1. Market Analysis, Insights and Forecast - by Application
- 6.1.1. Offshore Power Plant
- 6.1.2. Onshore Power Plant
- 6.2. Market Analysis, Insights and Forecast - by Types
- 6.2.1. Power Cable
- 6.2.2. Control Cable
- 6.2.3. Communication Cable
- 6.2.4. Catenary Cable
- 6.2.5. Others
- 6.1. Market Analysis, Insights and Forecast - by Application
- 7. North America Special Cables for Wind Energy Analysis, Insights and Forecast, 2021-2033
- 7.1. Market Analysis, Insights and Forecast - by Application
- 7.1.1. Offshore Power Plant
- 7.1.2. Onshore Power Plant
- 7.2. Market Analysis, Insights and Forecast - by Types
- 7.2.1. Power Cable
- 7.2.2. Control Cable
- 7.2.3. Communication Cable
- 7.2.4. Catenary Cable
- 7.2.5. Others
- 7.1. Market Analysis, Insights and Forecast - by Application
- 8. South America Special Cables for Wind Energy Analysis, Insights and Forecast, 2021-2033
- 8.1. Market Analysis, Insights and Forecast - by Application
- 8.1.1. Offshore Power Plant
- 8.1.2. Onshore Power Plant
- 8.2. Market Analysis, Insights and Forecast - by Types
- 8.2.1. Power Cable
- 8.2.2. Control Cable
- 8.2.3. Communication Cable
- 8.2.4. Catenary Cable
- 8.2.5. Others
- 8.1. Market Analysis, Insights and Forecast - by Application
- 9. Europe Special Cables for Wind Energy Analysis, Insights and Forecast, 2021-2033
- 9.1. Market Analysis, Insights and Forecast - by Application
- 9.1.1. Offshore Power Plant
- 9.1.2. Onshore Power Plant
- 9.2. Market Analysis, Insights and Forecast - by Types
- 9.2.1. Power Cable
- 9.2.2. Control Cable
- 9.2.3. Communication Cable
- 9.2.4. Catenary Cable
- 9.2.5. Others
- 9.1. Market Analysis, Insights and Forecast - by Application
- 10. Middle East & Africa Special Cables for Wind Energy Analysis, Insights and Forecast, 2021-2033
- 10.1. Market Analysis, Insights and Forecast - by Application
- 10.1.1. Offshore Power Plant
- 10.1.2. Onshore Power Plant
- 10.2. Market Analysis, Insights and Forecast - by Types
- 10.2.1. Power Cable
- 10.2.2. Control Cable
- 10.2.3. Communication Cable
- 10.2.4. Catenary Cable
- 10.2.5. Others
- 10.1. Market Analysis, Insights and Forecast - by Application
- 11. Asia Pacific Special Cables for Wind Energy Analysis, Insights and Forecast, 2021-2033
- 11.1. Market Analysis, Insights and Forecast - by Application
- 11.1.1. Offshore Power Plant
- 11.1.2. Onshore Power Plant
- 11.2. Market Analysis, Insights and Forecast - by Types
- 11.2.1. Power Cable
- 11.2.2. Control Cable
- 11.2.3. Communication Cable
- 11.2.4. Catenary Cable
- 11.2.5. Others
- 11.1. Market Analysis, Insights and Forecast - by Application
- 12. Competitive Analysis
- 12.1. Company Profiles
- 12.1.1 NEXANS
- 12.1.1.1. Company Overview
- 12.1.1.2. Products
- 12.1.1.3. Company Financials
- 12.1.1.4. SWOT Analysis
- 12.1.2 ZTT
- 12.1.2.1. Company Overview
- 12.1.2.2. Products
- 12.1.2.3. Company Financials
- 12.1.2.4. SWOT Analysis
- 12.1.3 Sumitomo Electric Industries
- 12.1.3.1. Company Overview
- 12.1.3.2. Products
- 12.1.3.3. Company Financials
- 12.1.3.4. SWOT Analysis
- 12.1.4 Ltd.
- 12.1.4.1. Company Overview
- 12.1.4.2. Products
- 12.1.4.3. Company Financials
- 12.1.4.4. SWOT Analysis
- 12.1.5 NKT A/S
- 12.1.5.1. Company Overview
- 12.1.5.2. Products
- 12.1.5.3. Company Financials
- 12.1.5.4. SWOT Analysis
- 12.1.6 HENGTONG GROUP CO.
- 12.1.6.1. Company Overview
- 12.1.6.2. Products
- 12.1.6.3. Company Financials
- 12.1.6.4. SWOT Analysis
- 12.1.7 LTD.
- 12.1.7.1. Company Overview
- 12.1.7.2. Products
- 12.1.7.3. Company Financials
- 12.1.7.4. SWOT Analysis
- 12.1.8 LEONI
- 12.1.8.1. Company Overview
- 12.1.8.2. Products
- 12.1.8.3. Company Financials
- 12.1.8.4. SWOT Analysis
- 12.1.9 Fujikura Ltd.
- 12.1.9.1. Company Overview
- 12.1.9.2. Products
- 12.1.9.3. Company Financials
- 12.1.9.4. SWOT Analysis
- 12.1.10 JDR Cable Systems Ltd.
- 12.1.10.1. Company Overview
- 12.1.10.2. Products
- 12.1.10.3. Company Financials
- 12.1.10.4. SWOT Analysis
- 12.1.11 Prysmian Group
- 12.1.11.1. Company Overview
- 12.1.11.2. Products
- 12.1.11.3. Company Financials
- 12.1.11.4. SWOT Analysis
- 12.1.12 LS Cable & System Ltd.
- 12.1.12.1. Company Overview
- 12.1.12.2. Products
- 12.1.12.3. Company Financials
- 12.1.12.4. SWOT Analysis
- 12.1.13 FURUKAWA ELECTRIC CO.
- 12.1.13.1. Company Overview
- 12.1.13.2. Products
- 12.1.13.3. Company Financials
- 12.1.13.4. SWOT Analysis
- 12.1.14 LTD
- 12.1.14.1. Company Overview
- 12.1.14.2. Products
- 12.1.14.3. Company Financials
- 12.1.14.4. SWOT Analysis
- 12.1.15 Hellenic Cables
- 12.1.15.1. Company Overview
- 12.1.15.2. Products
- 12.1.15.3. Company Financials
- 12.1.15.4. SWOT Analysis
- 12.1.16 SAB Cable
- 12.1.16.1. Company Overview
- 12.1.16.2. Products
- 12.1.16.3. Company Financials
- 12.1.16.4. SWOT Analysis
- 12.1.17 Tratos UK Ltd
- 12.1.17.1. Company Overview
- 12.1.17.2. Products
- 12.1.17.3. Company Financials
- 12.1.17.4. SWOT Analysis
- 12.1.18 HELUKABEL
- 12.1.18.1. Company Overview
- 12.1.18.2. Products
- 12.1.18.3. Company Financials
- 12.1.18.4. SWOT Analysis
- 12.1.19 SSGcable
- 12.1.19.1. Company Overview
- 12.1.19.2. Products
- 12.1.19.3. Company Financials
- 12.1.19.4. SWOT Analysis
- 12.1.20 Jinbei Electrician
- 12.1.20.1. Company Overview
- 12.1.20.2. Products
- 12.1.20.3. Company Financials
- 12.1.20.4. SWOT Analysis
- 12.1.21 HEW-Kabel
- 12.1.21.1. Company Overview
- 12.1.21.2. Products
- 12.1.21.3. Company Financials
- 12.1.21.4. SWOT Analysis
- 12.1.22 Nexans AmerCable Systems
- 12.1.22.1. Company Overview
- 12.1.22.2. Products
- 12.1.22.3. Company Financials
- 12.1.22.4. SWOT Analysis
- 12.1.23 LS Cable & System
- 12.1.23.1. Company Overview
- 12.1.23.2. Products
- 12.1.23.3. Company Financials
- 12.1.23.4. SWOT Analysis
- 12.1.24 Habia
- 12.1.24.1. Company Overview
- 12.1.24.2. Products
- 12.1.24.3. Company Financials
- 12.1.24.4. SWOT Analysis
- 12.1.25 Amokabel
- 12.1.25.1. Company Overview
- 12.1.25.2. Products
- 12.1.25.3. Company Financials
- 12.1.25.4. SWOT Analysis
- 12.1.26 Thermo Cables
- 12.1.26.1. Company Overview
- 12.1.26.2. Products
- 12.1.26.3. Company Financials
- 12.1.26.4. SWOT Analysis
- 12.1.27 Remee Wire & Cable
- 12.1.27.1. Company Overview
- 12.1.27.2. Products
- 12.1.27.3. Company Financials
- 12.1.27.4. SWOT Analysis
- 12.1.28 American Wire Group
- 12.1.28.1. Company Overview
- 12.1.28.2. Products
- 12.1.28.3. Company Financials
- 12.1.28.4. SWOT Analysis
- 12.1.1 NEXANS
- 12.2. Market Entropy
- 12.2.1 Company's Key Areas Served
- 12.2.2 Recent Developments
- 12.3. Company Market Share Analysis 2025
- 12.3.1 Top 5 Companies Market Share Analysis
- 12.3.2 Top 3 Companies Market Share Analysis
- 12.4. List of Potential Customers
- 13. Research Methodology
List of Figures
- Figure 1: Global Special Cables for Wind Energy Revenue Breakdown (billion, %) by Region 2025 & 2033
- Figure 2: North America Special Cables for Wind Energy Revenue (billion), by Application 2025 & 2033
- Figure 3: North America Special Cables for Wind Energy Revenue Share (%), by Application 2025 & 2033
- Figure 4: North America Special Cables for Wind Energy Revenue (billion), by Types 2025 & 2033
- Figure 5: North America Special Cables for Wind Energy Revenue Share (%), by Types 2025 & 2033
- Figure 6: North America Special Cables for Wind Energy Revenue (billion), by Country 2025 & 2033
- Figure 7: North America Special Cables for Wind Energy Revenue Share (%), by Country 2025 & 2033
- Figure 8: South America Special Cables for Wind Energy Revenue (billion), by Application 2025 & 2033
- Figure 9: South America Special Cables for Wind Energy Revenue Share (%), by Application 2025 & 2033
- Figure 10: South America Special Cables for Wind Energy Revenue (billion), by Types 2025 & 2033
- Figure 11: South America Special Cables for Wind Energy Revenue Share (%), by Types 2025 & 2033
- Figure 12: South America Special Cables for Wind Energy Revenue (billion), by Country 2025 & 2033
- Figure 13: South America Special Cables for Wind Energy Revenue Share (%), by Country 2025 & 2033
- Figure 14: Europe Special Cables for Wind Energy Revenue (billion), by Application 2025 & 2033
- Figure 15: Europe Special Cables for Wind Energy Revenue Share (%), by Application 2025 & 2033
- Figure 16: Europe Special Cables for Wind Energy Revenue (billion), by Types 2025 & 2033
- Figure 17: Europe Special Cables for Wind Energy Revenue Share (%), by Types 2025 & 2033
- Figure 18: Europe Special Cables for Wind Energy Revenue (billion), by Country 2025 & 2033
- Figure 19: Europe Special Cables for Wind Energy Revenue Share (%), by Country 2025 & 2033
- Figure 20: Middle East & Africa Special Cables for Wind Energy Revenue (billion), by Application 2025 & 2033
- Figure 21: Middle East & Africa Special Cables for Wind Energy Revenue Share (%), by Application 2025 & 2033
- Figure 22: Middle East & Africa Special Cables for Wind Energy Revenue (billion), by Types 2025 & 2033
- Figure 23: Middle East & Africa Special Cables for Wind Energy Revenue Share (%), by Types 2025 & 2033
- Figure 24: Middle East & Africa Special Cables for Wind Energy Revenue (billion), by Country 2025 & 2033
- Figure 25: Middle East & Africa Special Cables for Wind Energy Revenue Share (%), by Country 2025 & 2033
- Figure 26: Asia Pacific Special Cables for Wind Energy Revenue (billion), by Application 2025 & 2033
- Figure 27: Asia Pacific Special Cables for Wind Energy Revenue Share (%), by Application 2025 & 2033
- Figure 28: Asia Pacific Special Cables for Wind Energy Revenue (billion), by Types 2025 & 2033
- Figure 29: Asia Pacific Special Cables for Wind Energy Revenue Share (%), by Types 2025 & 2033
- Figure 30: Asia Pacific Special Cables for Wind Energy Revenue (billion), by Country 2025 & 2033
- Figure 31: Asia Pacific Special Cables for Wind Energy Revenue Share (%), by Country 2025 & 2033
List of Tables
- Table 1: Global Special Cables for Wind Energy Revenue billion Forecast, by Application 2020 & 2033
- Table 2: Global Special Cables for Wind Energy Revenue billion Forecast, by Types 2020 & 2033
- Table 3: Global Special Cables for Wind Energy Revenue billion Forecast, by Region 2020 & 2033
- Table 4: Global Special Cables for Wind Energy Revenue billion Forecast, by Application 2020 & 2033
- Table 5: Global Special Cables for Wind Energy Revenue billion Forecast, by Types 2020 & 2033
- Table 6: Global Special Cables for Wind Energy Revenue billion Forecast, by Country 2020 & 2033
- Table 7: United States Special Cables for Wind Energy Revenue (billion) Forecast, by Application 2020 & 2033
- Table 8: Canada Special Cables for Wind Energy Revenue (billion) Forecast, by Application 2020 & 2033
- Table 9: Mexico Special Cables for Wind Energy Revenue (billion) Forecast, by Application 2020 & 2033
- Table 10: Global Special Cables for Wind Energy Revenue billion Forecast, by Application 2020 & 2033
- Table 11: Global Special Cables for Wind Energy Revenue billion Forecast, by Types 2020 & 2033
- Table 12: Global Special Cables for Wind Energy Revenue billion Forecast, by Country 2020 & 2033
- Table 13: Brazil Special Cables for Wind Energy Revenue (billion) Forecast, by Application 2020 & 2033
- Table 14: Argentina Special Cables for Wind Energy Revenue (billion) Forecast, by Application 2020 & 2033
- Table 15: Rest of South America Special Cables for Wind Energy Revenue (billion) Forecast, by Application 2020 & 2033
- Table 16: Global Special Cables for Wind Energy Revenue billion Forecast, by Application 2020 & 2033
- Table 17: Global Special Cables for Wind Energy Revenue billion Forecast, by Types 2020 & 2033
- Table 18: Global Special Cables for Wind Energy Revenue billion Forecast, by Country 2020 & 2033
- Table 19: United Kingdom Special Cables for Wind Energy Revenue (billion) Forecast, by Application 2020 & 2033
- Table 20: Germany Special Cables for Wind Energy Revenue (billion) Forecast, by Application 2020 & 2033
- Table 21: France Special Cables for Wind Energy Revenue (billion) Forecast, by Application 2020 & 2033
- Table 22: Italy Special Cables for Wind Energy Revenue (billion) Forecast, by Application 2020 & 2033
- Table 23: Spain Special Cables for Wind Energy Revenue (billion) Forecast, by Application 2020 & 2033
- Table 24: Russia Special Cables for Wind Energy Revenue (billion) Forecast, by Application 2020 & 2033
- Table 25: Benelux Special Cables for Wind Energy Revenue (billion) Forecast, by Application 2020 & 2033
- Table 26: Nordics Special Cables for Wind Energy Revenue (billion) Forecast, by Application 2020 & 2033
- Table 27: Rest of Europe Special Cables for Wind Energy Revenue (billion) Forecast, by Application 2020 & 2033
- Table 28: Global Special Cables for Wind Energy Revenue billion Forecast, by Application 2020 & 2033
- Table 29: Global Special Cables for Wind Energy Revenue billion Forecast, by Types 2020 & 2033
- Table 30: Global Special Cables for Wind Energy Revenue billion Forecast, by Country 2020 & 2033
- Table 31: Turkey Special Cables for Wind Energy Revenue (billion) Forecast, by Application 2020 & 2033
- Table 32: Israel Special Cables for Wind Energy Revenue (billion) Forecast, by Application 2020 & 2033
- Table 33: GCC Special Cables for Wind Energy Revenue (billion) Forecast, by Application 2020 & 2033
- Table 34: North Africa Special Cables for Wind Energy Revenue (billion) Forecast, by Application 2020 & 2033
- Table 35: South Africa Special Cables for Wind Energy Revenue (billion) Forecast, by Application 2020 & 2033
- Table 36: Rest of Middle East & Africa Special Cables for Wind Energy Revenue (billion) Forecast, by Application 2020 & 2033
- Table 37: Global Special Cables for Wind Energy Revenue billion Forecast, by Application 2020 & 2033
- Table 38: Global Special Cables for Wind Energy Revenue billion Forecast, by Types 2020 & 2033
- Table 39: Global Special Cables for Wind Energy Revenue billion Forecast, by Country 2020 & 2033
- Table 40: China Special Cables for Wind Energy Revenue (billion) Forecast, by Application 2020 & 2033
- Table 41: India Special Cables for Wind Energy Revenue (billion) Forecast, by Application 2020 & 2033
- Table 42: Japan Special Cables for Wind Energy Revenue (billion) Forecast, by Application 2020 & 2033
- Table 43: South Korea Special Cables for Wind Energy Revenue (billion) Forecast, by Application 2020 & 2033
- Table 44: ASEAN Special Cables for Wind Energy Revenue (billion) Forecast, by Application 2020 & 2033
- Table 45: Oceania Special Cables for Wind Energy Revenue (billion) Forecast, by Application 2020 & 2033
- Table 46: Rest of Asia Pacific Special Cables for Wind Energy Revenue (billion) Forecast, by Application 2020 & 2033
Frequently Asked Questions
1. What is the projected Compound Annual Growth Rate (CAGR) of the Special Cables for Wind Energy?
The projected CAGR is approximately 12.06%.
2. Which companies are prominent players in the Special Cables for Wind Energy?
Key companies in the market include NEXANS, ZTT, Sumitomo Electric Industries, Ltd., NKT A/S, HENGTONG GROUP CO., LTD., LEONI, Fujikura Ltd., JDR Cable Systems Ltd., Prysmian Group, LS Cable & System Ltd., FURUKAWA ELECTRIC CO., LTD, Hellenic Cables, SAB Cable, Tratos UK Ltd, HELUKABEL, SSGcable, Jinbei Electrician, HEW-Kabel, Nexans AmerCable Systems, LS Cable & System, Habia, Amokabel, Thermo Cables, Remee Wire & Cable, American Wire Group.
3. What are the main segments of the Special Cables for Wind Energy?
The market segments include Application, Types.
4. Can you provide details about the market size?
The market size is estimated to be USD 10.8 billion as of 2022.
5. What are some drivers contributing to market growth?
N/A
6. What are the notable trends driving market growth?
N/A
7. Are there any restraints impacting market growth?
N/A
8. Can you provide examples of recent developments in the market?
N/A
9. What pricing options are available for accessing the report?
Pricing options include single-user, multi-user, and enterprise licenses priced at USD 2900.00, USD 4350.00, and USD 5800.00 respectively.
10. Is the market size provided in terms of value or volume?
The market size is provided in terms of value, measured in billion.
11. Are there any specific market keywords associated with the report?
Yes, the market keyword associated with the report is "Special Cables for Wind Energy," which aids in identifying and referencing the specific market segment covered.
12. How do I determine which pricing option suits my needs best?
The pricing options vary based on user requirements and access needs. Individual users may opt for single-user licenses, while businesses requiring broader access may choose multi-user or enterprise licenses for cost-effective access to the report.
13. Are there any additional resources or data provided in the Special Cables for Wind Energy report?
While the report offers comprehensive insights, it's advisable to review the specific contents or supplementary materials provided to ascertain if additional resources or data are available.
14. How can I stay updated on further developments or reports in the Special Cables for Wind Energy?
To stay informed about further developments, trends, and reports in the Special Cables for Wind Energy, consider subscribing to industry newsletters, following relevant companies and organizations, or regularly checking reputable industry news sources and publications.
Methodology
Step 1 - Identification of Relevant Samples Size from Population Database


Step 2 - Approaches for Defining Global Market Size (Value, Volume* & Price*)

Note*: In applicable scenarios
Step 3 - Data Sources
Primary Research
- Web Analytics
- Survey Reports
- Research Institute
- Latest Research Reports
- Opinion Leaders
Secondary Research
- Annual Reports
- White Paper
- Latest Press Release
- Industry Association
- Paid Database
- Investor Presentations

Step 4 - Data Triangulation
Involves using different sources of information in order to increase the validity of a study
These sources are likely to be stakeholders in a program - participants, other researchers, program staff, other community members, and so on.
Then we put all data in single framework & apply various statistical tools to find out the dynamic on the market.
During the analysis stage, feedback from the stakeholder groups would be compared to determine areas of agreement as well as areas of divergence