
Key Insights
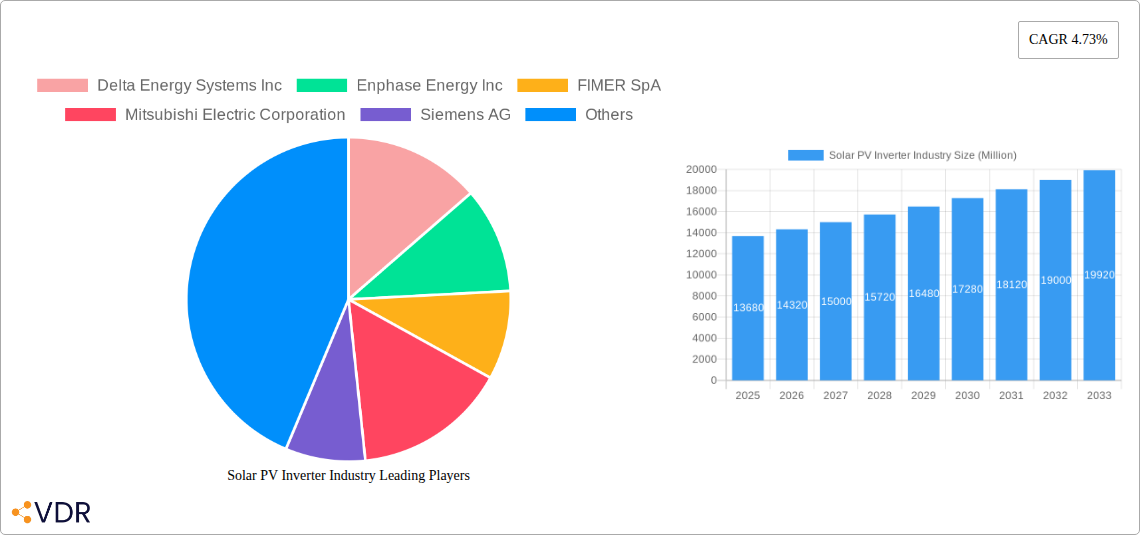
The global solar PV inverter market, valued at $13.68 billion in 2025, is projected to experience robust growth, driven by the increasing adoption of solar energy worldwide. A compound annual growth rate (CAGR) of 4.73% from 2025 to 2033 indicates a significant expansion, fueled by several key factors. The rising demand for renewable energy sources due to environmental concerns and government incentives is a major catalyst. Technological advancements leading to higher efficiency, improved reliability, and reduced costs of inverters are further boosting market growth. The market segmentation reveals strong growth across all inverter types (central, string, micro) and application areas (residential, commercial & industrial, utility-scale). The shift towards decentralized energy generation and increasing grid integration needs are also contributing significantly. String inverters currently hold the largest market share due to their cost-effectiveness and suitability for various applications, but microinverters are gaining traction due to their superior performance and monitoring capabilities. Geographically, North America and Europe are mature markets, while Asia Pacific is expected to witness the fastest growth, driven by large-scale solar projects in countries like China and India. Competitive landscape is intensely dynamic with established players like Delta Energy Systems, Enphase Energy, and SMA Solar Technology alongside emerging companies constantly innovating.
The continued expansion of the solar PV inverter market hinges on sustained government support for renewable energy initiatives, decreasing solar panel costs making solar energy more accessible, and ongoing research and development into more efficient and cost-effective inverter technologies. Challenges like grid instability and intermittency of solar power need to be addressed through smart grid technologies and advanced energy storage solutions. However, the long-term outlook remains positive, with the market poised for significant expansion as the global transition to sustainable energy accelerates. The increasing demand for energy storage systems coupled with solar PV inverters will further propel the market’s growth trajectory. Competition will intensify, driving innovation and price reductions, ultimately benefitting consumers and promoting wider adoption of solar energy.
This comprehensive report provides an in-depth analysis of the Solar PV Inverter industry, encompassing market dynamics, growth trends, regional dominance, product landscape, and key players. With a study period spanning 2019-2033, a base year of 2025, and a forecast period of 2025-2033, this report is an invaluable resource for industry professionals, investors, and stakeholders seeking a clear understanding of this dynamic market. The report analyzes the parent market of renewable energy and the child market of solar energy components, offering a granular view of market segmentation by inverter type (central, string, micro) and application (residential, commercial & industrial, utility-scale). The global market size is projected to reach xx Million units by 2033.
Solar PV Inverter Industry Market Dynamics & Structure
The Solar PV Inverter market is characterized by a moderately concentrated structure with key players like Delta Energy Systems Inc, Enphase Energy Inc, FIMER SpA, Mitsubishi Electric Corporation, Siemens AG, Schneider Electric SE, Omron Corporation, Huawei Technologies Co Ltd, SolarEdge Technologies Inc, General Electric Company, and SMA Solar Technology AG holding significant market share. However, the market also exhibits substantial fragmentation, with numerous smaller players competing.
- Market Concentration: The top 5 players account for approximately xx% of the global market share (2024).
- Technological Innovation: Continuous advancements in power electronics, energy storage integration, and smart grid technologies drive innovation, leading to higher efficiency and enhanced functionalities in inverters. String inverters currently dominate the market but micro-inverters are gaining traction.
- Regulatory Frameworks: Government policies promoting renewable energy adoption, including subsidies and net metering programs, significantly influence market growth. Stringent safety and performance standards also shape the industry landscape.
- Competitive Product Substitutes: While limited, energy storage solutions, and other forms of renewable energy technologies like wind power, present indirect competition.
- End-User Demographics: The market is driven by a diverse range of end-users, including residential homeowners, commercial businesses, industrial facilities, and utility companies. The residential and utility segments show high adoption rates.
- M&A Trends: The industry has witnessed a moderate number of mergers and acquisitions (M&A) in recent years, primarily driven by strategic expansions and technological consolidation. An estimated xx M&A deals occurred between 2019 and 2024. Innovation barriers include high R&D costs and complex certification processes.
Solar PV Inverter Industry Growth Trends & Insights
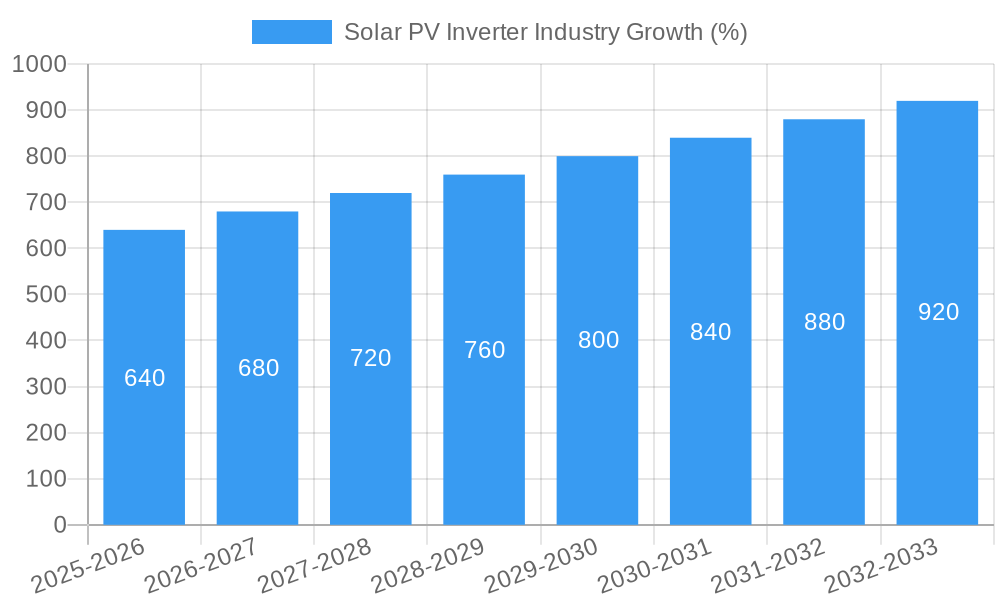
The solar PV inverter market has experienced robust growth over the historical period (2019-2024), driven by factors including the decreasing cost of solar PV systems, supportive government policies, and increasing concerns about climate change. The market size expanded from xx Million units in 2019 to xx Million units in 2024, exhibiting a Compound Annual Growth Rate (CAGR) of xx%. This growth is anticipated to continue throughout the forecast period (2025-2033), although at a slightly moderated pace, with a projected CAGR of xx%, reaching xx Million units by 2033. The increasing adoption of rooftop solar systems in residential and commercial sectors, coupled with the burgeoning utility-scale solar power projects, fuels this growth. Technological advancements, like the integration of artificial intelligence (AI) for predictive maintenance and optimization, further contribute to market expansion. Consumer behavior increasingly favors environmentally friendly energy solutions, boosting demand for solar PV inverters. Market penetration in key regions continues to rise, reflecting the growing acceptance of renewable energy sources.
Dominant Regions, Countries, or Segments in Solar PV Inverter Industry
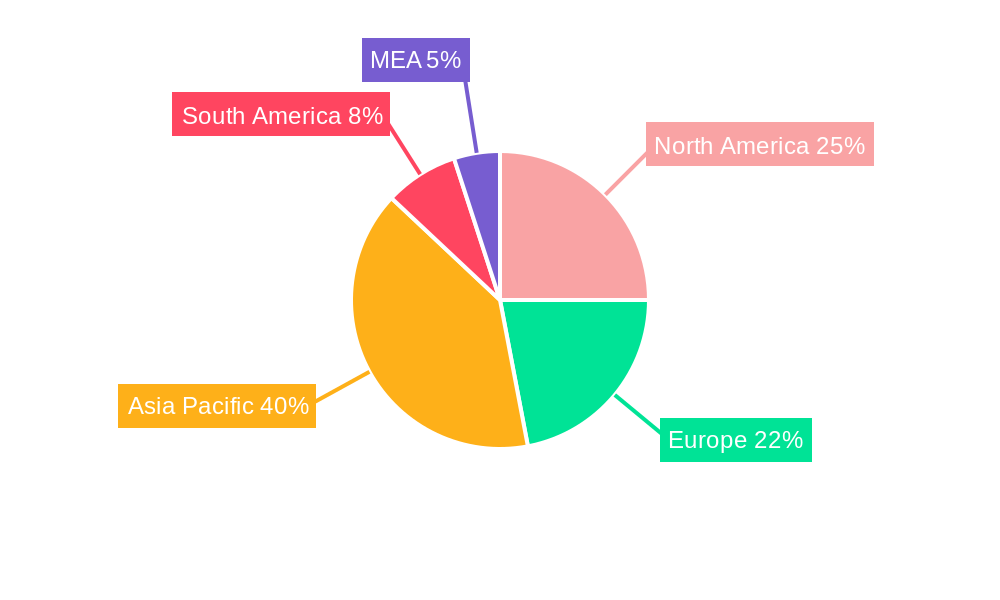
The Asia-Pacific region currently dominates the solar PV inverter market, driven by substantial investments in renewable energy infrastructure, particularly in China, India, and Japan. Europe and North America also show significant market share, fueled by supportive governmental policies and strong environmental awareness among consumers.
- Asia-Pacific: High growth is attributable to massive solar power deployment projects, supportive government policies, and a large consumer base. China, India, and Japan are leading countries.
- Europe: Stringent environmental regulations and increasing focus on renewable energy sources drive market growth in Germany, Spain, and other countries.
- North America: Demand is largely propelled by the residential solar market, with the United States leading the region.
- Dominant Segments: String inverters hold the largest market share due to their cost-effectiveness and suitability for various applications. However, micro-inverters are rapidly gaining popularity due to their enhanced safety and performance advantages. The utility-scale segment is anticipated to witness substantial growth due to large-scale solar power project developments.
Solar PV Inverter Industry Product Landscape
The solar PV inverter market is characterized by a wide range of products offering diverse power ratings, functionalities, and technological advancements. Key product innovations include higher efficiency inverters, integrated energy storage solutions, advanced monitoring capabilities, and improved grid-integration technologies. Inverters are now designed to meet diverse application needs, from small residential systems to large utility-scale projects. Key performance metrics include efficiency, power output, reliability, and grid compatibility. Unique selling propositions encompass features like smart monitoring, seamless energy storage integration, and advanced safety features.
Key Drivers, Barriers & Challenges in Solar PV Inverter Industry
Key Drivers:
- Decreasing cost of solar PV technology.
- Government incentives and supportive policies for renewable energy adoption.
- Growing environmental concerns and the need to reduce carbon emissions.
- Increasing demand for reliable and efficient power solutions.
Challenges and Restraints:
- Supply chain disruptions impacting component availability and cost.
- Stringent safety and performance standards. Certification and compliance pose difficulties.
- Intense competition from established and emerging players.
- Dependence on raw material prices, leading to price fluctuations.
Emerging Opportunities in Solar PV Inverter Industry
- Expansion into untapped markets in developing economies.
- Integration of artificial intelligence (AI) and machine learning (ML) for predictive maintenance and optimization.
- Development of advanced energy storage solutions integrated with inverters.
- Growing demand for off-grid and micro-grid applications.
Growth Accelerators in the Solar PV Inverter Industry
Technological breakthroughs, such as higher efficiency power electronics and improved energy storage integration, are key drivers of long-term growth. Strategic partnerships between inverter manufacturers and solar panel producers create synergistic growth. Market expansion into emerging economies and increased focus on sustainable solutions are further catalysts.
Key Players Shaping the Solar PV Inverter Industry Market
- Delta Energy Systems Inc
- Enphase Energy Inc
- FIMER SpA
- Mitsubishi Electric Corporation
- Siemens AG
- Schneider Electric SE
- Omron Corporation
- Huawei Technologies Co Ltd
- SolarEdge Technologies Inc
- General Electric Company
- SMA Solar Technology AG
Notable Milestones in Solar PV Inverter Industry Sector
- April 2022: SMA Solar Technology AG launched a new line of four inverters (12kW, 15kW, 20kW, and 25kW) for rooftop PV systems up to 135kW.
- May 2022: FIMER SpA supplied 1 MVA inverters to an 18MWh battery energy storage project in Gujarat, India.
In-Depth Solar PV Inverter Industry Market Outlook
The future of the solar PV inverter market appears bright, driven by continued growth in renewable energy adoption, technological advancements, and supportive government policies. Strategic partnerships and innovative product development will be crucial for companies to thrive in this competitive landscape. The market is poised for significant expansion, particularly in emerging economies and in applications involving energy storage and smart grid integration. The focus on improving efficiency, reliability, and cost-effectiveness will shape future market trends.
Solar PV Inverter Industry Segmentation
-
1. Inverter Type
- 1.1. Central Inverters
- 1.2. String Inverters
- 1.3. Micro Inverters
-
2. Application
- 2.1. Residential
- 2.2. Commercial and Industrial
- 2.3. Utility-scale
Solar PV Inverter Industry Segmentation By Geography
- 1. North America
- 2. Europe
- 3. Asia Pacific
- 4. South America
- 5. Middle East and Africa
Solar PV Inverter Industry REPORT HIGHLIGHTS
| Aspects | Details |
|---|---|
| Study Period | 2019-2033 |
| Base Year | 2024 |
| Estimated Year | 2025 |
| Forecast Period | 2025-2033 |
| Historical Period | 2019-2024 |
| Growth Rate | CAGR of 4.73% from 2019-2033 |
| Segmentation |
|
Table of Contents
- 1. Introduction
- 1.1. Research Scope
- 1.2. Market Segmentation
- 1.3. Research Methodology
- 1.4. Definitions and Assumptions
- 2. Executive Summary
- 2.1. Introduction
- 3. Market Dynamics
- 3.1. Introduction
- 3.2. Market Drivers
- 3.2.1. 4.; Supportive Government Initiatives4.; Investment in Electrification Using Solar Energy
- 3.3. Market Restrains
- 3.3.1 4.; Lack of General Awareness
- 3.3.2 Infrastructure Development Costs
- 3.3.3 and Recent Subsidy Cuts on Solar Panels
- 3.4. Market Trends
- 3.4.1. Central Inverters Segment Expected to Dominate the Market
- 4. Market Factor Analysis
- 4.1. Porters Five Forces
- 4.2. Supply/Value Chain
- 4.3. PESTEL analysis
- 4.4. Market Entropy
- 4.5. Patent/Trademark Analysis
- 5. Global Solar PV Inverter Industry Analysis, Insights and Forecast, 2019-2031
- 5.1. Market Analysis, Insights and Forecast - by Inverter Type
- 5.1.1. Central Inverters
- 5.1.2. String Inverters
- 5.1.3. Micro Inverters
- 5.2. Market Analysis, Insights and Forecast - by Application
- 5.2.1. Residential
- 5.2.2. Commercial and Industrial
- 5.2.3. Utility-scale
- 5.3. Market Analysis, Insights and Forecast - by Region
- 5.3.1. North America
- 5.3.2. Europe
- 5.3.3. Asia Pacific
- 5.3.4. South America
- 5.3.5. Middle East and Africa
- 5.1. Market Analysis, Insights and Forecast - by Inverter Type
- 6. North America Solar PV Inverter Industry Analysis, Insights and Forecast, 2019-2031
- 6.1. Market Analysis, Insights and Forecast - by Inverter Type
- 6.1.1. Central Inverters
- 6.1.2. String Inverters
- 6.1.3. Micro Inverters
- 6.2. Market Analysis, Insights and Forecast - by Application
- 6.2.1. Residential
- 6.2.2. Commercial and Industrial
- 6.2.3. Utility-scale
- 6.1. Market Analysis, Insights and Forecast - by Inverter Type
- 7. Europe Solar PV Inverter Industry Analysis, Insights and Forecast, 2019-2031
- 7.1. Market Analysis, Insights and Forecast - by Inverter Type
- 7.1.1. Central Inverters
- 7.1.2. String Inverters
- 7.1.3. Micro Inverters
- 7.2. Market Analysis, Insights and Forecast - by Application
- 7.2.1. Residential
- 7.2.2. Commercial and Industrial
- 7.2.3. Utility-scale
- 7.1. Market Analysis, Insights and Forecast - by Inverter Type
- 8. Asia Pacific Solar PV Inverter Industry Analysis, Insights and Forecast, 2019-2031
- 8.1. Market Analysis, Insights and Forecast - by Inverter Type
- 8.1.1. Central Inverters
- 8.1.2. String Inverters
- 8.1.3. Micro Inverters
- 8.2. Market Analysis, Insights and Forecast - by Application
- 8.2.1. Residential
- 8.2.2. Commercial and Industrial
- 8.2.3. Utility-scale
- 8.1. Market Analysis, Insights and Forecast - by Inverter Type
- 9. South America Solar PV Inverter Industry Analysis, Insights and Forecast, 2019-2031
- 9.1. Market Analysis, Insights and Forecast - by Inverter Type
- 9.1.1. Central Inverters
- 9.1.2. String Inverters
- 9.1.3. Micro Inverters
- 9.2. Market Analysis, Insights and Forecast - by Application
- 9.2.1. Residential
- 9.2.2. Commercial and Industrial
- 9.2.3. Utility-scale
- 9.1. Market Analysis, Insights and Forecast - by Inverter Type
- 10. Middle East and Africa Solar PV Inverter Industry Analysis, Insights and Forecast, 2019-2031
- 10.1. Market Analysis, Insights and Forecast - by Inverter Type
- 10.1.1. Central Inverters
- 10.1.2. String Inverters
- 10.1.3. Micro Inverters
- 10.2. Market Analysis, Insights and Forecast - by Application
- 10.2.1. Residential
- 10.2.2. Commercial and Industrial
- 10.2.3. Utility-scale
- 10.1. Market Analysis, Insights and Forecast - by Inverter Type
- 11. North America Solar PV Inverter Industry Analysis, Insights and Forecast, 2019-2031
- 11.1. Market Analysis, Insights and Forecast - By Country/Sub-region
- 11.1.1 United States
- 11.1.2 Canada
- 11.1.3 Mexico
- 12. Europe Solar PV Inverter Industry Analysis, Insights and Forecast, 2019-2031
- 12.1. Market Analysis, Insights and Forecast - By Country/Sub-region
- 12.1.1 Germany
- 12.1.2 United Kingdom
- 12.1.3 France
- 12.1.4 Spain
- 12.1.5 Italy
- 12.1.6 Spain
- 12.1.7 Belgium
- 12.1.8 Netherland
- 12.1.9 Nordics
- 12.1.10 Rest of Europe
- 13. Asia Pacific Solar PV Inverter Industry Analysis, Insights and Forecast, 2019-2031
- 13.1. Market Analysis, Insights and Forecast - By Country/Sub-region
- 13.1.1 China
- 13.1.2 Japan
- 13.1.3 India
- 13.1.4 South Korea
- 13.1.5 Southeast Asia
- 13.1.6 Australia
- 13.1.7 Indonesia
- 13.1.8 Phillipes
- 13.1.9 Singapore
- 13.1.10 Thailandc
- 13.1.11 Rest of Asia Pacific
- 14. South America Solar PV Inverter Industry Analysis, Insights and Forecast, 2019-2031
- 14.1. Market Analysis, Insights and Forecast - By Country/Sub-region
- 14.1.1 Brazil
- 14.1.2 Argentina
- 14.1.3 Peru
- 14.1.4 Chile
- 14.1.5 Colombia
- 14.1.6 Ecuador
- 14.1.7 Venezuela
- 14.1.8 Rest of South America
- 15. North America Solar PV Inverter Industry Analysis, Insights and Forecast, 2019-2031
- 15.1. Market Analysis, Insights and Forecast - By Country/Sub-region
- 15.1.1 United States
- 15.1.2 Canada
- 15.1.3 Mexico
- 16. MEA Solar PV Inverter Industry Analysis, Insights and Forecast, 2019-2031
- 16.1. Market Analysis, Insights and Forecast - By Country/Sub-region
- 16.1.1 United Arab Emirates
- 16.1.2 Saudi Arabia
- 16.1.3 South Africa
- 16.1.4 Rest of Middle East and Africa
- 17. Competitive Analysis
- 17.1. Global Market Share Analysis 2024
- 17.2. Company Profiles
- 17.2.1 Delta Energy Systems Inc
- 17.2.1.1. Overview
- 17.2.1.2. Products
- 17.2.1.3. SWOT Analysis
- 17.2.1.4. Recent Developments
- 17.2.1.5. Financials (Based on Availability)
- 17.2.2 Enphase Energy Inc
- 17.2.2.1. Overview
- 17.2.2.2. Products
- 17.2.2.3. SWOT Analysis
- 17.2.2.4. Recent Developments
- 17.2.2.5. Financials (Based on Availability)
- 17.2.3 FIMER SpA
- 17.2.3.1. Overview
- 17.2.3.2. Products
- 17.2.3.3. SWOT Analysis
- 17.2.3.4. Recent Developments
- 17.2.3.5. Financials (Based on Availability)
- 17.2.4 Mitsubishi Electric Corporation
- 17.2.4.1. Overview
- 17.2.4.2. Products
- 17.2.4.3. SWOT Analysis
- 17.2.4.4. Recent Developments
- 17.2.4.5. Financials (Based on Availability)
- 17.2.5 Siemens AG
- 17.2.5.1. Overview
- 17.2.5.2. Products
- 17.2.5.3. SWOT Analysis
- 17.2.5.4. Recent Developments
- 17.2.5.5. Financials (Based on Availability)
- 17.2.6 Schneider Electric SE
- 17.2.6.1. Overview
- 17.2.6.2. Products
- 17.2.6.3. SWOT Analysis
- 17.2.6.4. Recent Developments
- 17.2.6.5. Financials (Based on Availability)
- 17.2.7 Omron Corporation
- 17.2.7.1. Overview
- 17.2.7.2. Products
- 17.2.7.3. SWOT Analysis
- 17.2.7.4. Recent Developments
- 17.2.7.5. Financials (Based on Availability)
- 17.2.8 Huawei Technologies Co Ltd*List Not Exhaustive
- 17.2.8.1. Overview
- 17.2.8.2. Products
- 17.2.8.3. SWOT Analysis
- 17.2.8.4. Recent Developments
- 17.2.8.5. Financials (Based on Availability)
- 17.2.9 SolarEdge Technologies Inc
- 17.2.9.1. Overview
- 17.2.9.2. Products
- 17.2.9.3. SWOT Analysis
- 17.2.9.4. Recent Developments
- 17.2.9.5. Financials (Based on Availability)
- 17.2.10 General Electric Company
- 17.2.10.1. Overview
- 17.2.10.2. Products
- 17.2.10.3. SWOT Analysis
- 17.2.10.4. Recent Developments
- 17.2.10.5. Financials (Based on Availability)
- 17.2.11 SMA Solar Technology AG
- 17.2.11.1. Overview
- 17.2.11.2. Products
- 17.2.11.3. SWOT Analysis
- 17.2.11.4. Recent Developments
- 17.2.11.5. Financials (Based on Availability)
- 17.2.1 Delta Energy Systems Inc
List of Figures
- Figure 1: Global Solar PV Inverter Industry Revenue Breakdown (Million, %) by Region 2024 & 2032
- Figure 2: Global Solar PV Inverter Industry Volume Breakdown (K Unit, %) by Region 2024 & 2032
- Figure 3: North America Solar PV Inverter Industry Revenue (Million), by Country 2024 & 2032
- Figure 4: North America Solar PV Inverter Industry Volume (K Unit), by Country 2024 & 2032
- Figure 5: North America Solar PV Inverter Industry Revenue Share (%), by Country 2024 & 2032
- Figure 6: North America Solar PV Inverter Industry Volume Share (%), by Country 2024 & 2032
- Figure 7: Europe Solar PV Inverter Industry Revenue (Million), by Country 2024 & 2032
- Figure 8: Europe Solar PV Inverter Industry Volume (K Unit), by Country 2024 & 2032
- Figure 9: Europe Solar PV Inverter Industry Revenue Share (%), by Country 2024 & 2032
- Figure 10: Europe Solar PV Inverter Industry Volume Share (%), by Country 2024 & 2032
- Figure 11: Asia Pacific Solar PV Inverter Industry Revenue (Million), by Country 2024 & 2032
- Figure 12: Asia Pacific Solar PV Inverter Industry Volume (K Unit), by Country 2024 & 2032
- Figure 13: Asia Pacific Solar PV Inverter Industry Revenue Share (%), by Country 2024 & 2032
- Figure 14: Asia Pacific Solar PV Inverter Industry Volume Share (%), by Country 2024 & 2032
- Figure 15: South America Solar PV Inverter Industry Revenue (Million), by Country 2024 & 2032
- Figure 16: South America Solar PV Inverter Industry Volume (K Unit), by Country 2024 & 2032
- Figure 17: South America Solar PV Inverter Industry Revenue Share (%), by Country 2024 & 2032
- Figure 18: South America Solar PV Inverter Industry Volume Share (%), by Country 2024 & 2032
- Figure 19: North America Solar PV Inverter Industry Revenue (Million), by Country 2024 & 2032
- Figure 20: North America Solar PV Inverter Industry Volume (K Unit), by Country 2024 & 2032
- Figure 21: North America Solar PV Inverter Industry Revenue Share (%), by Country 2024 & 2032
- Figure 22: North America Solar PV Inverter Industry Volume Share (%), by Country 2024 & 2032
- Figure 23: MEA Solar PV Inverter Industry Revenue (Million), by Country 2024 & 2032
- Figure 24: MEA Solar PV Inverter Industry Volume (K Unit), by Country 2024 & 2032
- Figure 25: MEA Solar PV Inverter Industry Revenue Share (%), by Country 2024 & 2032
- Figure 26: MEA Solar PV Inverter Industry Volume Share (%), by Country 2024 & 2032
- Figure 27: North America Solar PV Inverter Industry Revenue (Million), by Inverter Type 2024 & 2032
- Figure 28: North America Solar PV Inverter Industry Volume (K Unit), by Inverter Type 2024 & 2032
- Figure 29: North America Solar PV Inverter Industry Revenue Share (%), by Inverter Type 2024 & 2032
- Figure 30: North America Solar PV Inverter Industry Volume Share (%), by Inverter Type 2024 & 2032
- Figure 31: North America Solar PV Inverter Industry Revenue (Million), by Application 2024 & 2032
- Figure 32: North America Solar PV Inverter Industry Volume (K Unit), by Application 2024 & 2032
- Figure 33: North America Solar PV Inverter Industry Revenue Share (%), by Application 2024 & 2032
- Figure 34: North America Solar PV Inverter Industry Volume Share (%), by Application 2024 & 2032
- Figure 35: North America Solar PV Inverter Industry Revenue (Million), by Country 2024 & 2032
- Figure 36: North America Solar PV Inverter Industry Volume (K Unit), by Country 2024 & 2032
- Figure 37: North America Solar PV Inverter Industry Revenue Share (%), by Country 2024 & 2032
- Figure 38: North America Solar PV Inverter Industry Volume Share (%), by Country 2024 & 2032
- Figure 39: Europe Solar PV Inverter Industry Revenue (Million), by Inverter Type 2024 & 2032
- Figure 40: Europe Solar PV Inverter Industry Volume (K Unit), by Inverter Type 2024 & 2032
- Figure 41: Europe Solar PV Inverter Industry Revenue Share (%), by Inverter Type 2024 & 2032
- Figure 42: Europe Solar PV Inverter Industry Volume Share (%), by Inverter Type 2024 & 2032
- Figure 43: Europe Solar PV Inverter Industry Revenue (Million), by Application 2024 & 2032
- Figure 44: Europe Solar PV Inverter Industry Volume (K Unit), by Application 2024 & 2032
- Figure 45: Europe Solar PV Inverter Industry Revenue Share (%), by Application 2024 & 2032
- Figure 46: Europe Solar PV Inverter Industry Volume Share (%), by Application 2024 & 2032
- Figure 47: Europe Solar PV Inverter Industry Revenue (Million), by Country 2024 & 2032
- Figure 48: Europe Solar PV Inverter Industry Volume (K Unit), by Country 2024 & 2032
- Figure 49: Europe Solar PV Inverter Industry Revenue Share (%), by Country 2024 & 2032
- Figure 50: Europe Solar PV Inverter Industry Volume Share (%), by Country 2024 & 2032
- Figure 51: Asia Pacific Solar PV Inverter Industry Revenue (Million), by Inverter Type 2024 & 2032
- Figure 52: Asia Pacific Solar PV Inverter Industry Volume (K Unit), by Inverter Type 2024 & 2032
- Figure 53: Asia Pacific Solar PV Inverter Industry Revenue Share (%), by Inverter Type 2024 & 2032
- Figure 54: Asia Pacific Solar PV Inverter Industry Volume Share (%), by Inverter Type 2024 & 2032
- Figure 55: Asia Pacific Solar PV Inverter Industry Revenue (Million), by Application 2024 & 2032
- Figure 56: Asia Pacific Solar PV Inverter Industry Volume (K Unit), by Application 2024 & 2032
- Figure 57: Asia Pacific Solar PV Inverter Industry Revenue Share (%), by Application 2024 & 2032
- Figure 58: Asia Pacific Solar PV Inverter Industry Volume Share (%), by Application 2024 & 2032
- Figure 59: Asia Pacific Solar PV Inverter Industry Revenue (Million), by Country 2024 & 2032
- Figure 60: Asia Pacific Solar PV Inverter Industry Volume (K Unit), by Country 2024 & 2032
- Figure 61: Asia Pacific Solar PV Inverter Industry Revenue Share (%), by Country 2024 & 2032
- Figure 62: Asia Pacific Solar PV Inverter Industry Volume Share (%), by Country 2024 & 2032
- Figure 63: South America Solar PV Inverter Industry Revenue (Million), by Inverter Type 2024 & 2032
- Figure 64: South America Solar PV Inverter Industry Volume (K Unit), by Inverter Type 2024 & 2032
- Figure 65: South America Solar PV Inverter Industry Revenue Share (%), by Inverter Type 2024 & 2032
- Figure 66: South America Solar PV Inverter Industry Volume Share (%), by Inverter Type 2024 & 2032
- Figure 67: South America Solar PV Inverter Industry Revenue (Million), by Application 2024 & 2032
- Figure 68: South America Solar PV Inverter Industry Volume (K Unit), by Application 2024 & 2032
- Figure 69: South America Solar PV Inverter Industry Revenue Share (%), by Application 2024 & 2032
- Figure 70: South America Solar PV Inverter Industry Volume Share (%), by Application 2024 & 2032
- Figure 71: South America Solar PV Inverter Industry Revenue (Million), by Country 2024 & 2032
- Figure 72: South America Solar PV Inverter Industry Volume (K Unit), by Country 2024 & 2032
- Figure 73: South America Solar PV Inverter Industry Revenue Share (%), by Country 2024 & 2032
- Figure 74: South America Solar PV Inverter Industry Volume Share (%), by Country 2024 & 2032
- Figure 75: Middle East and Africa Solar PV Inverter Industry Revenue (Million), by Inverter Type 2024 & 2032
- Figure 76: Middle East and Africa Solar PV Inverter Industry Volume (K Unit), by Inverter Type 2024 & 2032
- Figure 77: Middle East and Africa Solar PV Inverter Industry Revenue Share (%), by Inverter Type 2024 & 2032
- Figure 78: Middle East and Africa Solar PV Inverter Industry Volume Share (%), by Inverter Type 2024 & 2032
- Figure 79: Middle East and Africa Solar PV Inverter Industry Revenue (Million), by Application 2024 & 2032
- Figure 80: Middle East and Africa Solar PV Inverter Industry Volume (K Unit), by Application 2024 & 2032
- Figure 81: Middle East and Africa Solar PV Inverter Industry Revenue Share (%), by Application 2024 & 2032
- Figure 82: Middle East and Africa Solar PV Inverter Industry Volume Share (%), by Application 2024 & 2032
- Figure 83: Middle East and Africa Solar PV Inverter Industry Revenue (Million), by Country 2024 & 2032
- Figure 84: Middle East and Africa Solar PV Inverter Industry Volume (K Unit), by Country 2024 & 2032
- Figure 85: Middle East and Africa Solar PV Inverter Industry Revenue Share (%), by Country 2024 & 2032
- Figure 86: Middle East and Africa Solar PV Inverter Industry Volume Share (%), by Country 2024 & 2032
List of Tables
- Table 1: Global Solar PV Inverter Industry Revenue Million Forecast, by Region 2019 & 2032
- Table 2: Global Solar PV Inverter Industry Volume K Unit Forecast, by Region 2019 & 2032
- Table 3: Global Solar PV Inverter Industry Revenue Million Forecast, by Inverter Type 2019 & 2032
- Table 4: Global Solar PV Inverter Industry Volume K Unit Forecast, by Inverter Type 2019 & 2032
- Table 5: Global Solar PV Inverter Industry Revenue Million Forecast, by Application 2019 & 2032
- Table 6: Global Solar PV Inverter Industry Volume K Unit Forecast, by Application 2019 & 2032
- Table 7: Global Solar PV Inverter Industry Revenue Million Forecast, by Region 2019 & 2032
- Table 8: Global Solar PV Inverter Industry Volume K Unit Forecast, by Region 2019 & 2032
- Table 9: Global Solar PV Inverter Industry Revenue Million Forecast, by Country 2019 & 2032
- Table 10: Global Solar PV Inverter Industry Volume K Unit Forecast, by Country 2019 & 2032
- Table 11: United States Solar PV Inverter Industry Revenue (Million) Forecast, by Application 2019 & 2032
- Table 12: United States Solar PV Inverter Industry Volume (K Unit) Forecast, by Application 2019 & 2032
- Table 13: Canada Solar PV Inverter Industry Revenue (Million) Forecast, by Application 2019 & 2032
- Table 14: Canada Solar PV Inverter Industry Volume (K Unit) Forecast, by Application 2019 & 2032
- Table 15: Mexico Solar PV Inverter Industry Revenue (Million) Forecast, by Application 2019 & 2032
- Table 16: Mexico Solar PV Inverter Industry Volume (K Unit) Forecast, by Application 2019 & 2032
- Table 17: Global Solar PV Inverter Industry Revenue Million Forecast, by Country 2019 & 2032
- Table 18: Global Solar PV Inverter Industry Volume K Unit Forecast, by Country 2019 & 2032
- Table 19: Germany Solar PV Inverter Industry Revenue (Million) Forecast, by Application 2019 & 2032
- Table 20: Germany Solar PV Inverter Industry Volume (K Unit) Forecast, by Application 2019 & 2032
- Table 21: United Kingdom Solar PV Inverter Industry Revenue (Million) Forecast, by Application 2019 & 2032
- Table 22: United Kingdom Solar PV Inverter Industry Volume (K Unit) Forecast, by Application 2019 & 2032
- Table 23: France Solar PV Inverter Industry Revenue (Million) Forecast, by Application 2019 & 2032
- Table 24: France Solar PV Inverter Industry Volume (K Unit) Forecast, by Application 2019 & 2032
- Table 25: Spain Solar PV Inverter Industry Revenue (Million) Forecast, by Application 2019 & 2032
- Table 26: Spain Solar PV Inverter Industry Volume (K Unit) Forecast, by Application 2019 & 2032
- Table 27: Italy Solar PV Inverter Industry Revenue (Million) Forecast, by Application 2019 & 2032
- Table 28: Italy Solar PV Inverter Industry Volume (K Unit) Forecast, by Application 2019 & 2032
- Table 29: Spain Solar PV Inverter Industry Revenue (Million) Forecast, by Application 2019 & 2032
- Table 30: Spain Solar PV Inverter Industry Volume (K Unit) Forecast, by Application 2019 & 2032
- Table 31: Belgium Solar PV Inverter Industry Revenue (Million) Forecast, by Application 2019 & 2032
- Table 32: Belgium Solar PV Inverter Industry Volume (K Unit) Forecast, by Application 2019 & 2032
- Table 33: Netherland Solar PV Inverter Industry Revenue (Million) Forecast, by Application 2019 & 2032
- Table 34: Netherland Solar PV Inverter Industry Volume (K Unit) Forecast, by Application 2019 & 2032
- Table 35: Nordics Solar PV Inverter Industry Revenue (Million) Forecast, by Application 2019 & 2032
- Table 36: Nordics Solar PV Inverter Industry Volume (K Unit) Forecast, by Application 2019 & 2032
- Table 37: Rest of Europe Solar PV Inverter Industry Revenue (Million) Forecast, by Application 2019 & 2032
- Table 38: Rest of Europe Solar PV Inverter Industry Volume (K Unit) Forecast, by Application 2019 & 2032
- Table 39: Global Solar PV Inverter Industry Revenue Million Forecast, by Country 2019 & 2032
- Table 40: Global Solar PV Inverter Industry Volume K Unit Forecast, by Country 2019 & 2032
- Table 41: China Solar PV Inverter Industry Revenue (Million) Forecast, by Application 2019 & 2032
- Table 42: China Solar PV Inverter Industry Volume (K Unit) Forecast, by Application 2019 & 2032
- Table 43: Japan Solar PV Inverter Industry Revenue (Million) Forecast, by Application 2019 & 2032
- Table 44: Japan Solar PV Inverter Industry Volume (K Unit) Forecast, by Application 2019 & 2032
- Table 45: India Solar PV Inverter Industry Revenue (Million) Forecast, by Application 2019 & 2032
- Table 46: India Solar PV Inverter Industry Volume (K Unit) Forecast, by Application 2019 & 2032
- Table 47: South Korea Solar PV Inverter Industry Revenue (Million) Forecast, by Application 2019 & 2032
- Table 48: South Korea Solar PV Inverter Industry Volume (K Unit) Forecast, by Application 2019 & 2032
- Table 49: Southeast Asia Solar PV Inverter Industry Revenue (Million) Forecast, by Application 2019 & 2032
- Table 50: Southeast Asia Solar PV Inverter Industry Volume (K Unit) Forecast, by Application 2019 & 2032
- Table 51: Australia Solar PV Inverter Industry Revenue (Million) Forecast, by Application 2019 & 2032
- Table 52: Australia Solar PV Inverter Industry Volume (K Unit) Forecast, by Application 2019 & 2032
- Table 53: Indonesia Solar PV Inverter Industry Revenue (Million) Forecast, by Application 2019 & 2032
- Table 54: Indonesia Solar PV Inverter Industry Volume (K Unit) Forecast, by Application 2019 & 2032
- Table 55: Phillipes Solar PV Inverter Industry Revenue (Million) Forecast, by Application 2019 & 2032
- Table 56: Phillipes Solar PV Inverter Industry Volume (K Unit) Forecast, by Application 2019 & 2032
- Table 57: Singapore Solar PV Inverter Industry Revenue (Million) Forecast, by Application 2019 & 2032
- Table 58: Singapore Solar PV Inverter Industry Volume (K Unit) Forecast, by Application 2019 & 2032
- Table 59: Thailandc Solar PV Inverter Industry Revenue (Million) Forecast, by Application 2019 & 2032
- Table 60: Thailandc Solar PV Inverter Industry Volume (K Unit) Forecast, by Application 2019 & 2032
- Table 61: Rest of Asia Pacific Solar PV Inverter Industry Revenue (Million) Forecast, by Application 2019 & 2032
- Table 62: Rest of Asia Pacific Solar PV Inverter Industry Volume (K Unit) Forecast, by Application 2019 & 2032
- Table 63: Global Solar PV Inverter Industry Revenue Million Forecast, by Country 2019 & 2032
- Table 64: Global Solar PV Inverter Industry Volume K Unit Forecast, by Country 2019 & 2032
- Table 65: Brazil Solar PV Inverter Industry Revenue (Million) Forecast, by Application 2019 & 2032
- Table 66: Brazil Solar PV Inverter Industry Volume (K Unit) Forecast, by Application 2019 & 2032
- Table 67: Argentina Solar PV Inverter Industry Revenue (Million) Forecast, by Application 2019 & 2032
- Table 68: Argentina Solar PV Inverter Industry Volume (K Unit) Forecast, by Application 2019 & 2032
- Table 69: Peru Solar PV Inverter Industry Revenue (Million) Forecast, by Application 2019 & 2032
- Table 70: Peru Solar PV Inverter Industry Volume (K Unit) Forecast, by Application 2019 & 2032
- Table 71: Chile Solar PV Inverter Industry Revenue (Million) Forecast, by Application 2019 & 2032
- Table 72: Chile Solar PV Inverter Industry Volume (K Unit) Forecast, by Application 2019 & 2032
- Table 73: Colombia Solar PV Inverter Industry Revenue (Million) Forecast, by Application 2019 & 2032
- Table 74: Colombia Solar PV Inverter Industry Volume (K Unit) Forecast, by Application 2019 & 2032
- Table 75: Ecuador Solar PV Inverter Industry Revenue (Million) Forecast, by Application 2019 & 2032
- Table 76: Ecuador Solar PV Inverter Industry Volume (K Unit) Forecast, by Application 2019 & 2032
- Table 77: Venezuela Solar PV Inverter Industry Revenue (Million) Forecast, by Application 2019 & 2032
- Table 78: Venezuela Solar PV Inverter Industry Volume (K Unit) Forecast, by Application 2019 & 2032
- Table 79: Rest of South America Solar PV Inverter Industry Revenue (Million) Forecast, by Application 2019 & 2032
- Table 80: Rest of South America Solar PV Inverter Industry Volume (K Unit) Forecast, by Application 2019 & 2032
- Table 81: Global Solar PV Inverter Industry Revenue Million Forecast, by Country 2019 & 2032
- Table 82: Global Solar PV Inverter Industry Volume K Unit Forecast, by Country 2019 & 2032
- Table 83: United States Solar PV Inverter Industry Revenue (Million) Forecast, by Application 2019 & 2032
- Table 84: United States Solar PV Inverter Industry Volume (K Unit) Forecast, by Application 2019 & 2032
- Table 85: Canada Solar PV Inverter Industry Revenue (Million) Forecast, by Application 2019 & 2032
- Table 86: Canada Solar PV Inverter Industry Volume (K Unit) Forecast, by Application 2019 & 2032
- Table 87: Mexico Solar PV Inverter Industry Revenue (Million) Forecast, by Application 2019 & 2032
- Table 88: Mexico Solar PV Inverter Industry Volume (K Unit) Forecast, by Application 2019 & 2032
- Table 89: Global Solar PV Inverter Industry Revenue Million Forecast, by Country 2019 & 2032
- Table 90: Global Solar PV Inverter Industry Volume K Unit Forecast, by Country 2019 & 2032
- Table 91: United Arab Emirates Solar PV Inverter Industry Revenue (Million) Forecast, by Application 2019 & 2032
- Table 92: United Arab Emirates Solar PV Inverter Industry Volume (K Unit) Forecast, by Application 2019 & 2032
- Table 93: Saudi Arabia Solar PV Inverter Industry Revenue (Million) Forecast, by Application 2019 & 2032
- Table 94: Saudi Arabia Solar PV Inverter Industry Volume (K Unit) Forecast, by Application 2019 & 2032
- Table 95: South Africa Solar PV Inverter Industry Revenue (Million) Forecast, by Application 2019 & 2032
- Table 96: South Africa Solar PV Inverter Industry Volume (K Unit) Forecast, by Application 2019 & 2032
- Table 97: Rest of Middle East and Africa Solar PV Inverter Industry Revenue (Million) Forecast, by Application 2019 & 2032
- Table 98: Rest of Middle East and Africa Solar PV Inverter Industry Volume (K Unit) Forecast, by Application 2019 & 2032
- Table 99: Global Solar PV Inverter Industry Revenue Million Forecast, by Inverter Type 2019 & 2032
- Table 100: Global Solar PV Inverter Industry Volume K Unit Forecast, by Inverter Type 2019 & 2032
- Table 101: Global Solar PV Inverter Industry Revenue Million Forecast, by Application 2019 & 2032
- Table 102: Global Solar PV Inverter Industry Volume K Unit Forecast, by Application 2019 & 2032
- Table 103: Global Solar PV Inverter Industry Revenue Million Forecast, by Country 2019 & 2032
- Table 104: Global Solar PV Inverter Industry Volume K Unit Forecast, by Country 2019 & 2032
- Table 105: Global Solar PV Inverter Industry Revenue Million Forecast, by Inverter Type 2019 & 2032
- Table 106: Global Solar PV Inverter Industry Volume K Unit Forecast, by Inverter Type 2019 & 2032
- Table 107: Global Solar PV Inverter Industry Revenue Million Forecast, by Application 2019 & 2032
- Table 108: Global Solar PV Inverter Industry Volume K Unit Forecast, by Application 2019 & 2032
- Table 109: Global Solar PV Inverter Industry Revenue Million Forecast, by Country 2019 & 2032
- Table 110: Global Solar PV Inverter Industry Volume K Unit Forecast, by Country 2019 & 2032
- Table 111: Global Solar PV Inverter Industry Revenue Million Forecast, by Inverter Type 2019 & 2032
- Table 112: Global Solar PV Inverter Industry Volume K Unit Forecast, by Inverter Type 2019 & 2032
- Table 113: Global Solar PV Inverter Industry Revenue Million Forecast, by Application 2019 & 2032
- Table 114: Global Solar PV Inverter Industry Volume K Unit Forecast, by Application 2019 & 2032
- Table 115: Global Solar PV Inverter Industry Revenue Million Forecast, by Country 2019 & 2032
- Table 116: Global Solar PV Inverter Industry Volume K Unit Forecast, by Country 2019 & 2032
- Table 117: Global Solar PV Inverter Industry Revenue Million Forecast, by Inverter Type 2019 & 2032
- Table 118: Global Solar PV Inverter Industry Volume K Unit Forecast, by Inverter Type 2019 & 2032
- Table 119: Global Solar PV Inverter Industry Revenue Million Forecast, by Application 2019 & 2032
- Table 120: Global Solar PV Inverter Industry Volume K Unit Forecast, by Application 2019 & 2032
- Table 121: Global Solar PV Inverter Industry Revenue Million Forecast, by Country 2019 & 2032
- Table 122: Global Solar PV Inverter Industry Volume K Unit Forecast, by Country 2019 & 2032
- Table 123: Global Solar PV Inverter Industry Revenue Million Forecast, by Inverter Type 2019 & 2032
- Table 124: Global Solar PV Inverter Industry Volume K Unit Forecast, by Inverter Type 2019 & 2032
- Table 125: Global Solar PV Inverter Industry Revenue Million Forecast, by Application 2019 & 2032
- Table 126: Global Solar PV Inverter Industry Volume K Unit Forecast, by Application 2019 & 2032
- Table 127: Global Solar PV Inverter Industry Revenue Million Forecast, by Country 2019 & 2032
- Table 128: Global Solar PV Inverter Industry Volume K Unit Forecast, by Country 2019 & 2032
Frequently Asked Questions
1. What is the projected Compound Annual Growth Rate (CAGR) of the Solar PV Inverter Industry?
The projected CAGR is approximately 4.73%.
2. Which companies are prominent players in the Solar PV Inverter Industry?
Key companies in the market include Delta Energy Systems Inc, Enphase Energy Inc, FIMER SpA, Mitsubishi Electric Corporation, Siemens AG, Schneider Electric SE, Omron Corporation, Huawei Technologies Co Ltd*List Not Exhaustive, SolarEdge Technologies Inc, General Electric Company, SMA Solar Technology AG.
3. What are the main segments of the Solar PV Inverter Industry?
The market segments include Inverter Type, Application.
4. Can you provide details about the market size?
The market size is estimated to be USD 13.68 Million as of 2022.
5. What are some drivers contributing to market growth?
4.; Supportive Government Initiatives4.; Investment in Electrification Using Solar Energy.
6. What are the notable trends driving market growth?
Central Inverters Segment Expected to Dominate the Market.
7. Are there any restraints impacting market growth?
4.; Lack of General Awareness. Infrastructure Development Costs. and Recent Subsidy Cuts on Solar Panels.
8. Can you provide examples of recent developments in the market?
In April 2022, SMA Solar Technology AG, a German inverter manufacturer, launched a new line of four inverters with power ratings of 12kW, 15kW, 20kW, and 25kW for use in rooftop PV systems up to 135kW in size.
9. What pricing options are available for accessing the report?
Pricing options include single-user, multi-user, and enterprise licenses priced at USD 4750, USD 5250, and USD 8750 respectively.
10. Is the market size provided in terms of value or volume?
The market size is provided in terms of value, measured in Million and volume, measured in K Unit.
11. Are there any specific market keywords associated with the report?
Yes, the market keyword associated with the report is "Solar PV Inverter Industry," which aids in identifying and referencing the specific market segment covered.
12. How do I determine which pricing option suits my needs best?
The pricing options vary based on user requirements and access needs. Individual users may opt for single-user licenses, while businesses requiring broader access may choose multi-user or enterprise licenses for cost-effective access to the report.
13. Are there any additional resources or data provided in the Solar PV Inverter Industry report?
While the report offers comprehensive insights, it's advisable to review the specific contents or supplementary materials provided to ascertain if additional resources or data are available.
14. How can I stay updated on further developments or reports in the Solar PV Inverter Industry?
To stay informed about further developments, trends, and reports in the Solar PV Inverter Industry, consider subscribing to industry newsletters, following relevant companies and organizations, or regularly checking reputable industry news sources and publications.
Methodology
Step 1 - Identification of Relevant Samples Size from Population Database


Step 2 - Approaches for Defining Global Market Size (Value, Volume* & Price*)

Note*: In applicable scenarios
Step 3 - Data Sources
Primary Research
- Web Analytics
- Survey Reports
- Research Institute
- Latest Research Reports
- Opinion Leaders
Secondary Research
- Annual Reports
- White Paper
- Latest Press Release
- Industry Association
- Paid Database
- Investor Presentations

Step 4 - Data Triangulation
Involves using different sources of information in order to increase the validity of a study
These sources are likely to be stakeholders in a program - participants, other researchers, program staff, other community members, and so on.
Then we put all data in single framework & apply various statistical tools to find out the dynamic on the market.
During the analysis stage, feedback from the stakeholder groups would be compared to determine areas of agreement as well as areas of divergence


