
Key Insights
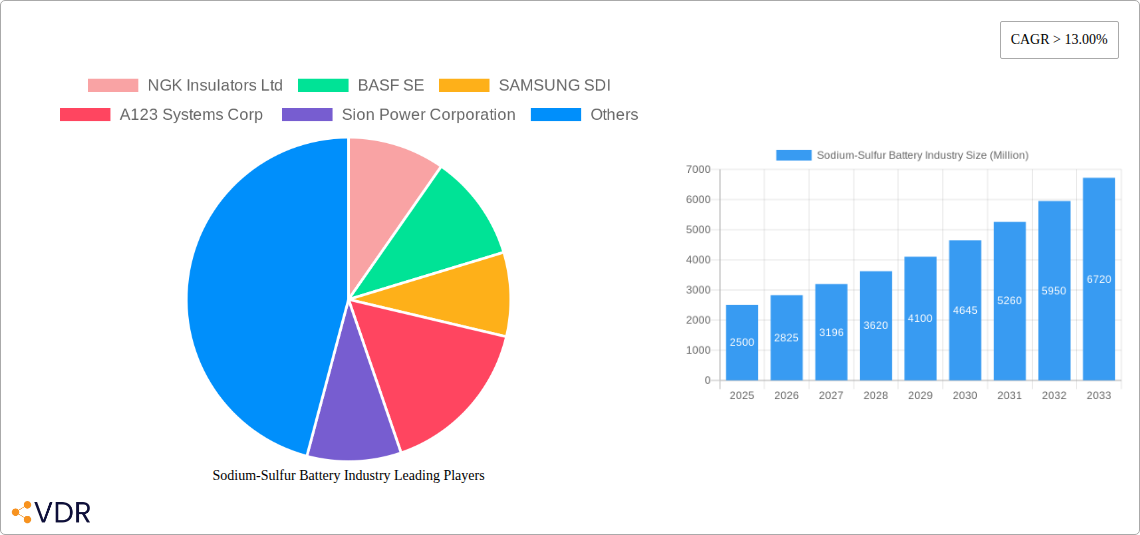
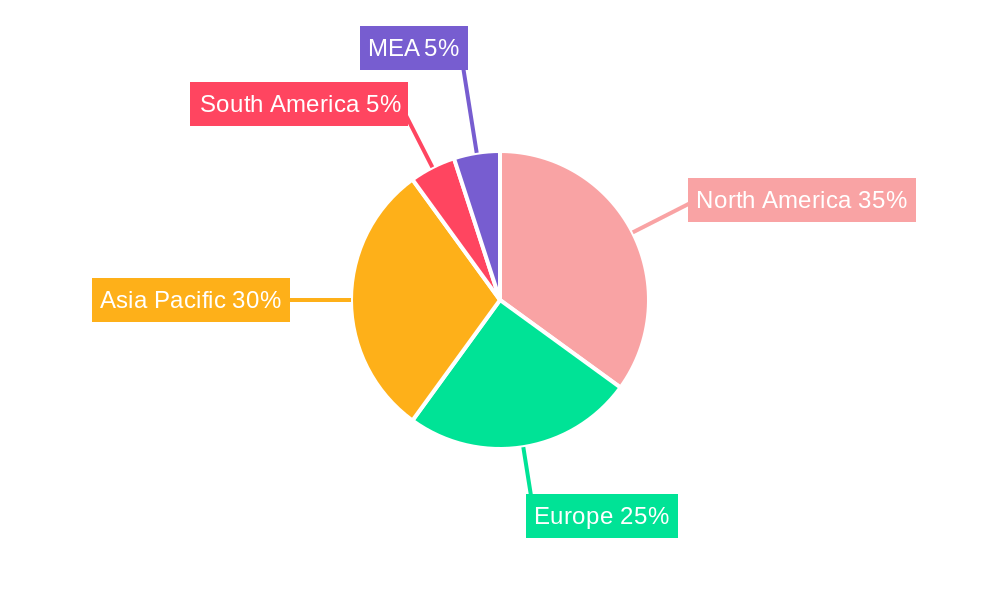
The sodium-sulfur (NaS) battery market is experiencing robust growth, driven by the increasing demand for energy storage solutions in renewable energy integration, backup power systems, and load-leveling applications. The market's Compound Annual Growth Rate (CAGR) exceeding 13% from 2019 to 2024 indicates significant investor interest and technological advancements. While precise market size figures for 2025 are unavailable, extrapolating from the provided CAGR and considering the current market trends, a reasonable estimate for the 2025 market size would be in the range of $2-3 billion. This growth is fueled by the inherent advantages of NaS batteries, including their high energy density, long lifespan, and relatively low cost compared to other advanced battery technologies like lithium-ion. However, challenges remain, such as the operational temperature requirements (typically above 300°C), which necessitates specialized infrastructure and may limit widespread adoption. Furthermore, the relatively nascent commercialization phase and potential environmental concerns related to sulfur sourcing and handling need careful consideration. The segment breakdown shows significant potential across various applications, with renewable energy stabilization expected to be a leading driver, closely followed by backup power and load-leveling applications. Key players such as NGK Insulators Ltd, BASF SE, SAMSUNG SDI, A123 Systems Corp, and Sion Power Corporation are actively involved in research, development, and commercialization efforts, which will further drive market growth in the coming years. Geographic distribution shows North America and Asia Pacific as leading regions, with significant growth potential in other developing economies.
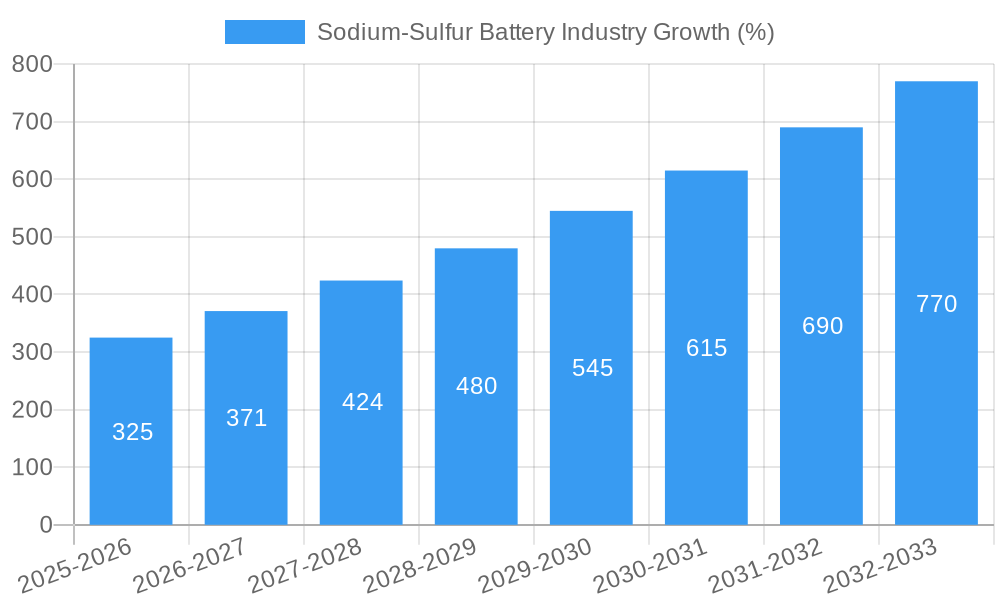
The forecast period (2025-2033) anticipates continued expansion of the NaS battery market, driven by ongoing technological improvements addressing the operational temperature challenges, enhanced safety features, and increasing government support for renewable energy infrastructure. The market is likely to see diversification in applications, expanding beyond its current core segments into emerging areas such as electric vehicles and grid-scale energy storage. While the high initial investment cost might pose a challenge to wider adoption, the long-term cost-effectiveness and environmental benefits of NaS batteries will likely drive substantial market growth, particularly in regions with robust renewable energy integration policies. The competitive landscape is expected to remain dynamic, with existing players consolidating their positions and new entrants leveraging advancements in material science and manufacturing technologies.
Sodium-Sulfur Battery Industry Market Report: 2019-2033
This comprehensive report provides an in-depth analysis of the Sodium-Sulfur (NaS) Battery industry, encompassing market dynamics, growth trends, regional dominance, product landscape, key players, and future outlook. With a focus on both the parent market (energy storage solutions) and the child market (NaS batteries), this report is essential for industry professionals, investors, and strategic decision-makers seeking a clear understanding of this rapidly evolving sector. The study period covers 2019-2033, with a base year of 2025 and a forecast period of 2025-2033.
Sodium-Sulfur Battery Industry Market Dynamics & Structure
The NaS battery market, while still nascent compared to Lithium-ion, exhibits significant growth potential driven by technological advancements and the increasing demand for large-scale energy storage solutions. Market concentration is currently moderate, with key players like NGK Insulators Ltd and BASF SE holding significant shares. However, the market is expected to become more fragmented as new entrants emerge and technological breakthroughs accelerate. The regulatory landscape, particularly government incentives for renewable energy integration, plays a crucial role in shaping market dynamics. Competitive substitutes include other large-scale energy storage technologies such as pumped hydro and flow batteries.
- Market Concentration: Moderate, with a projected xx% market share held by the top 3 players by 2025.
- Technological Innovation: Focus on improving cycle life, energy density, and reducing manufacturing costs.
- Regulatory Framework: Government subsidies and renewable energy mandates are key growth drivers.
- Competitive Substitutes: Pumped hydro storage, flow batteries, and other advanced battery technologies.
- End-User Demographics: Primarily utilities, grid operators, and industrial facilities requiring large-scale energy storage.
- M&A Trends: A moderate level of M&A activity is expected, driven by the need for technological collaborations and market consolidation. An estimated xx M&A deals are projected between 2025 and 2033.
Sodium-Sulfur Battery Industry Growth Trends & Insights
The NaS battery market is projected to experience significant growth over the forecast period, driven by the increasing adoption of renewable energy sources and the need for grid stabilization. The Compound Annual Growth Rate (CAGR) is estimated at xx% from 2025 to 2033, with market size expanding from xx million units in 2025 to xx million units by 2033. This growth is fueled by decreasing battery costs, improving performance metrics, and the rising demand for reliable and efficient energy storage solutions. Technological advancements, such as improved electrolyte formulations and enhanced cell designs, are driving adoption rates. Consumer behavior shifts towards sustainability and decarbonization are further strengthening market demand.
Dominant Regions, Countries, or Segments in Sodium-Sulfur Battery Industry
The renewable energy sector, particularly in regions with robust renewable energy policies and substantial grid integration challenges, is a primary driver of NaS battery adoption. Asia-Pacific, specifically China, is expected to dominate the market due to significant investments in renewable energy infrastructure and supportive government policies. Europe and North America also exhibit strong growth potential, driven by the increasing need for grid stabilization and backup power.
- Renewable Energy Stabilization: This segment is the largest contributor, driven by the growing penetration of intermittent renewable energy sources like solar and wind power.
- Backup Power: Increasing demand for reliable backup power in critical infrastructure applications is driving growth.
- Load Leveling: The need for efficient load leveling in industrial processes and microgrids is fueling market adoption.
- Key Drivers: Government incentives for renewable energy, increasing electricity prices, grid modernization initiatives, and stringent environmental regulations.
Sodium-Sulfur Battery Industry Product Landscape
NaS batteries offer unique advantages including high energy density, long cycle life, and suitability for large-scale applications. Recent innovations have focused on enhancing thermal management, improving safety features, and reducing manufacturing costs. These advancements are broadening the applicability of NaS batteries across various segments, contributing to their overall market growth. Key features like higher energy storage capacity compared to other battery technologies offer a strong unique selling proposition.
Key Drivers, Barriers & Challenges in Sodium-Sulfur Battery Industry
Key Drivers:
- Increasing demand for grid-scale energy storage solutions
- Growing adoption of renewable energy sources
- Government incentives and supportive policies
- Advancements in battery technology leading to improved performance and reduced costs
Challenges:
- Relatively high initial investment costs
- Thermal management complexities
- Competition from other energy storage technologies (e.g., Lithium-ion)
- Supply chain constraints for certain raw materials
Emerging Opportunities in Sodium-Sulfur Battery Industry
- Expansion into emerging markets with high renewable energy potential.
- Development of hybrid NaS-other battery systems for optimized performance.
- Integration with smart grid technologies for enhanced efficiency and grid management.
Growth Accelerators in the Sodium-Sulfur Battery Industry Industry
Technological breakthroughs in materials science and battery design, coupled with strategic partnerships between major players like BASF SE and NGK Insulators Ltd, are accelerating market growth. Continued investment in research and development, along with expansion into new geographical markets, will further fuel the industry’s long-term potential.
Key Players Shaping the Sodium-Sulfur Battery Industry Market
- NGK Insulators Ltd
- BASF SE
- SAMSUNG SDI
- A123 Systems Corp
- Sion Power Corporation
Notable Milestones in Sodium-Sulfur Battery Industry Sector
- October 2021: BASF's subsidiary BASF New Business (BNB) commissioned an energy storage system using NaS batteries in Antwerp, Belgium.
- January 2020: BASF SE and NGK entered a strategic partnership to develop next-generation NaS batteries.
In-Depth Sodium-Sulfur Battery Industry Market Outlook
The future of the NaS battery market looks promising, driven by strong growth drivers and ongoing technological advancements. Strategic partnerships, coupled with supportive government policies and the increasing demand for large-scale energy storage, will continue to propel market expansion. The focus on improving efficiency, reducing costs, and enhancing safety features will further broaden the adoption of NaS batteries across various applications, solidifying their position in the energy storage landscape.
Sodium-Sulfur Battery Industry Segmentation
-
1. Application
- 1.1. Renewable Energy Stabilization
- 1.2. Back-Up Power
- 1.3. Load levelling
- 1.4. Other Applications
Sodium-Sulfur Battery Industry Segmentation By Geography
- 1. North America
- 2. Europe
- 3. Asia Pacific
- 4. South America
- 5. Middle East
Sodium-Sulfur Battery Industry REPORT HIGHLIGHTS
| Aspects | Details |
|---|---|
| Study Period | 2019-2033 |
| Base Year | 2024 |
| Estimated Year | 2025 |
| Forecast Period | 2025-2033 |
| Historical Period | 2019-2024 |
| Growth Rate | CAGR of > 13.00% from 2019-2033 |
| Segmentation |
|
Table of Contents
- 1. Introduction
- 1.1. Research Scope
- 1.2. Market Segmentation
- 1.3. Research Methodology
- 1.4. Definitions and Assumptions
- 2. Executive Summary
- 2.1. Introduction
- 3. Market Dynamics
- 3.1. Introduction
- 3.2. Market Drivers
- 3.2.1 4.; Increasing Amount of Waste Generation
- 3.2.2 Growing Concern for Waste Management to Meet the Needs for Sustainable Urban Living4.; Increasing Focus on Non-fossil Fuel Sources of Energy
- 3.3. Market Restrains
- 3.3.1. 4.; Expensive Nature of Incinerators
- 3.4. Market Trends
- 3.4.1. Renewable Energy Stabilization Expected to Witness Significant Growth
- 4. Market Factor Analysis
- 4.1. Porters Five Forces
- 4.2. Supply/Value Chain
- 4.3. PESTEL analysis
- 4.4. Market Entropy
- 4.5. Patent/Trademark Analysis
- 5. Global Sodium-Sulfur Battery Industry Analysis, Insights and Forecast, 2019-2031
- 5.1. Market Analysis, Insights and Forecast - by Application
- 5.1.1. Renewable Energy Stabilization
- 5.1.2. Back-Up Power
- 5.1.3. Load levelling
- 5.1.4. Other Applications
- 5.2. Market Analysis, Insights and Forecast - by Region
- 5.2.1. North America
- 5.2.2. Europe
- 5.2.3. Asia Pacific
- 5.2.4. South America
- 5.2.5. Middle East
- 5.1. Market Analysis, Insights and Forecast - by Application
- 6. North America Sodium-Sulfur Battery Industry Analysis, Insights and Forecast, 2019-2031
- 6.1. Market Analysis, Insights and Forecast - by Application
- 6.1.1. Renewable Energy Stabilization
- 6.1.2. Back-Up Power
- 6.1.3. Load levelling
- 6.1.4. Other Applications
- 6.1. Market Analysis, Insights and Forecast - by Application
- 7. Europe Sodium-Sulfur Battery Industry Analysis, Insights and Forecast, 2019-2031
- 7.1. Market Analysis, Insights and Forecast - by Application
- 7.1.1. Renewable Energy Stabilization
- 7.1.2. Back-Up Power
- 7.1.3. Load levelling
- 7.1.4. Other Applications
- 7.1. Market Analysis, Insights and Forecast - by Application
- 8. Asia Pacific Sodium-Sulfur Battery Industry Analysis, Insights and Forecast, 2019-2031
- 8.1. Market Analysis, Insights and Forecast - by Application
- 8.1.1. Renewable Energy Stabilization
- 8.1.2. Back-Up Power
- 8.1.3. Load levelling
- 8.1.4. Other Applications
- 8.1. Market Analysis, Insights and Forecast - by Application
- 9. South America Sodium-Sulfur Battery Industry Analysis, Insights and Forecast, 2019-2031
- 9.1. Market Analysis, Insights and Forecast - by Application
- 9.1.1. Renewable Energy Stabilization
- 9.1.2. Back-Up Power
- 9.1.3. Load levelling
- 9.1.4. Other Applications
- 9.1. Market Analysis, Insights and Forecast - by Application
- 10. Middle East Sodium-Sulfur Battery Industry Analysis, Insights and Forecast, 2019-2031
- 10.1. Market Analysis, Insights and Forecast - by Application
- 10.1.1. Renewable Energy Stabilization
- 10.1.2. Back-Up Power
- 10.1.3. Load levelling
- 10.1.4. Other Applications
- 10.1. Market Analysis, Insights and Forecast - by Application
- 11. North America Sodium-Sulfur Battery Industry Analysis, Insights and Forecast, 2019-2031
- 11.1. Market Analysis, Insights and Forecast - By Country/Sub-region
- 11.1.1 United States
- 11.1.2 Canada
- 11.1.3 Mexico
- 12. Europe Sodium-Sulfur Battery Industry Analysis, Insights and Forecast, 2019-2031
- 12.1. Market Analysis, Insights and Forecast - By Country/Sub-region
- 12.1.1 Germany
- 12.1.2 United Kingdom
- 12.1.3 France
- 12.1.4 Spain
- 12.1.5 Italy
- 12.1.6 Spain
- 12.1.7 Belgium
- 12.1.8 Netherland
- 12.1.9 Nordics
- 12.1.10 Rest of Europe
- 13. Asia Pacific Sodium-Sulfur Battery Industry Analysis, Insights and Forecast, 2019-2031
- 13.1. Market Analysis, Insights and Forecast - By Country/Sub-region
- 13.1.1 China
- 13.1.2 Japan
- 13.1.3 India
- 13.1.4 South Korea
- 13.1.5 Southeast Asia
- 13.1.6 Australia
- 13.1.7 Indonesia
- 13.1.8 Phillipes
- 13.1.9 Singapore
- 13.1.10 Thailandc
- 13.1.11 Rest of Asia Pacific
- 14. South America Sodium-Sulfur Battery Industry Analysis, Insights and Forecast, 2019-2031
- 14.1. Market Analysis, Insights and Forecast - By Country/Sub-region
- 14.1.1 Brazil
- 14.1.2 Argentina
- 14.1.3 Peru
- 14.1.4 Chile
- 14.1.5 Colombia
- 14.1.6 Ecuador
- 14.1.7 Venezuela
- 14.1.8 Rest of South America
- 15. MEA Sodium-Sulfur Battery Industry Analysis, Insights and Forecast, 2019-2031
- 15.1. Market Analysis, Insights and Forecast - By Country/Sub-region
- 15.1.1 United Arab Emirates
- 15.1.2 Saudi Arabia
- 15.1.3 South Africa
- 15.1.4 Rest of Middle East and Africa
- 16. Competitive Analysis
- 16.1. Global Market Share Analysis 2024
- 16.2. Company Profiles
- 16.2.1 NGK Insulators Ltd
- 16.2.1.1. Overview
- 16.2.1.2. Products
- 16.2.1.3. SWOT Analysis
- 16.2.1.4. Recent Developments
- 16.2.1.5. Financials (Based on Availability)
- 16.2.2 BASF SE
- 16.2.2.1. Overview
- 16.2.2.2. Products
- 16.2.2.3. SWOT Analysis
- 16.2.2.4. Recent Developments
- 16.2.2.5. Financials (Based on Availability)
- 16.2.3 SAMSUNG SDI
- 16.2.3.1. Overview
- 16.2.3.2. Products
- 16.2.3.3. SWOT Analysis
- 16.2.3.4. Recent Developments
- 16.2.3.5. Financials (Based on Availability)
- 16.2.4 A123 Systems Corp
- 16.2.4.1. Overview
- 16.2.4.2. Products
- 16.2.4.3. SWOT Analysis
- 16.2.4.4. Recent Developments
- 16.2.4.5. Financials (Based on Availability)
- 16.2.5 Sion Power Corporation
- 16.2.5.1. Overview
- 16.2.5.2. Products
- 16.2.5.3. SWOT Analysis
- 16.2.5.4. Recent Developments
- 16.2.5.5. Financials (Based on Availability)
- 16.2.1 NGK Insulators Ltd
List of Figures
- Figure 1: Global Sodium-Sulfur Battery Industry Revenue Breakdown (Million, %) by Region 2024 & 2032
- Figure 2: Global Sodium-Sulfur Battery Industry Volume Breakdown (K Unit, %) by Region 2024 & 2032
- Figure 3: North America Sodium-Sulfur Battery Industry Revenue (Million), by Country 2024 & 2032
- Figure 4: North America Sodium-Sulfur Battery Industry Volume (K Unit), by Country 2024 & 2032
- Figure 5: North America Sodium-Sulfur Battery Industry Revenue Share (%), by Country 2024 & 2032
- Figure 6: North America Sodium-Sulfur Battery Industry Volume Share (%), by Country 2024 & 2032
- Figure 7: Europe Sodium-Sulfur Battery Industry Revenue (Million), by Country 2024 & 2032
- Figure 8: Europe Sodium-Sulfur Battery Industry Volume (K Unit), by Country 2024 & 2032
- Figure 9: Europe Sodium-Sulfur Battery Industry Revenue Share (%), by Country 2024 & 2032
- Figure 10: Europe Sodium-Sulfur Battery Industry Volume Share (%), by Country 2024 & 2032
- Figure 11: Asia Pacific Sodium-Sulfur Battery Industry Revenue (Million), by Country 2024 & 2032
- Figure 12: Asia Pacific Sodium-Sulfur Battery Industry Volume (K Unit), by Country 2024 & 2032
- Figure 13: Asia Pacific Sodium-Sulfur Battery Industry Revenue Share (%), by Country 2024 & 2032
- Figure 14: Asia Pacific Sodium-Sulfur Battery Industry Volume Share (%), by Country 2024 & 2032
- Figure 15: South America Sodium-Sulfur Battery Industry Revenue (Million), by Country 2024 & 2032
- Figure 16: South America Sodium-Sulfur Battery Industry Volume (K Unit), by Country 2024 & 2032
- Figure 17: South America Sodium-Sulfur Battery Industry Revenue Share (%), by Country 2024 & 2032
- Figure 18: South America Sodium-Sulfur Battery Industry Volume Share (%), by Country 2024 & 2032
- Figure 19: MEA Sodium-Sulfur Battery Industry Revenue (Million), by Country 2024 & 2032
- Figure 20: MEA Sodium-Sulfur Battery Industry Volume (K Unit), by Country 2024 & 2032
- Figure 21: MEA Sodium-Sulfur Battery Industry Revenue Share (%), by Country 2024 & 2032
- Figure 22: MEA Sodium-Sulfur Battery Industry Volume Share (%), by Country 2024 & 2032
- Figure 23: North America Sodium-Sulfur Battery Industry Revenue (Million), by Application 2024 & 2032
- Figure 24: North America Sodium-Sulfur Battery Industry Volume (K Unit), by Application 2024 & 2032
- Figure 25: North America Sodium-Sulfur Battery Industry Revenue Share (%), by Application 2024 & 2032
- Figure 26: North America Sodium-Sulfur Battery Industry Volume Share (%), by Application 2024 & 2032
- Figure 27: North America Sodium-Sulfur Battery Industry Revenue (Million), by Country 2024 & 2032
- Figure 28: North America Sodium-Sulfur Battery Industry Volume (K Unit), by Country 2024 & 2032
- Figure 29: North America Sodium-Sulfur Battery Industry Revenue Share (%), by Country 2024 & 2032
- Figure 30: North America Sodium-Sulfur Battery Industry Volume Share (%), by Country 2024 & 2032
- Figure 31: Europe Sodium-Sulfur Battery Industry Revenue (Million), by Application 2024 & 2032
- Figure 32: Europe Sodium-Sulfur Battery Industry Volume (K Unit), by Application 2024 & 2032
- Figure 33: Europe Sodium-Sulfur Battery Industry Revenue Share (%), by Application 2024 & 2032
- Figure 34: Europe Sodium-Sulfur Battery Industry Volume Share (%), by Application 2024 & 2032
- Figure 35: Europe Sodium-Sulfur Battery Industry Revenue (Million), by Country 2024 & 2032
- Figure 36: Europe Sodium-Sulfur Battery Industry Volume (K Unit), by Country 2024 & 2032
- Figure 37: Europe Sodium-Sulfur Battery Industry Revenue Share (%), by Country 2024 & 2032
- Figure 38: Europe Sodium-Sulfur Battery Industry Volume Share (%), by Country 2024 & 2032
- Figure 39: Asia Pacific Sodium-Sulfur Battery Industry Revenue (Million), by Application 2024 & 2032
- Figure 40: Asia Pacific Sodium-Sulfur Battery Industry Volume (K Unit), by Application 2024 & 2032
- Figure 41: Asia Pacific Sodium-Sulfur Battery Industry Revenue Share (%), by Application 2024 & 2032
- Figure 42: Asia Pacific Sodium-Sulfur Battery Industry Volume Share (%), by Application 2024 & 2032
- Figure 43: Asia Pacific Sodium-Sulfur Battery Industry Revenue (Million), by Country 2024 & 2032
- Figure 44: Asia Pacific Sodium-Sulfur Battery Industry Volume (K Unit), by Country 2024 & 2032
- Figure 45: Asia Pacific Sodium-Sulfur Battery Industry Revenue Share (%), by Country 2024 & 2032
- Figure 46: Asia Pacific Sodium-Sulfur Battery Industry Volume Share (%), by Country 2024 & 2032
- Figure 47: South America Sodium-Sulfur Battery Industry Revenue (Million), by Application 2024 & 2032
- Figure 48: South America Sodium-Sulfur Battery Industry Volume (K Unit), by Application 2024 & 2032
- Figure 49: South America Sodium-Sulfur Battery Industry Revenue Share (%), by Application 2024 & 2032
- Figure 50: South America Sodium-Sulfur Battery Industry Volume Share (%), by Application 2024 & 2032
- Figure 51: South America Sodium-Sulfur Battery Industry Revenue (Million), by Country 2024 & 2032
- Figure 52: South America Sodium-Sulfur Battery Industry Volume (K Unit), by Country 2024 & 2032
- Figure 53: South America Sodium-Sulfur Battery Industry Revenue Share (%), by Country 2024 & 2032
- Figure 54: South America Sodium-Sulfur Battery Industry Volume Share (%), by Country 2024 & 2032
- Figure 55: Middle East Sodium-Sulfur Battery Industry Revenue (Million), by Application 2024 & 2032
- Figure 56: Middle East Sodium-Sulfur Battery Industry Volume (K Unit), by Application 2024 & 2032
- Figure 57: Middle East Sodium-Sulfur Battery Industry Revenue Share (%), by Application 2024 & 2032
- Figure 58: Middle East Sodium-Sulfur Battery Industry Volume Share (%), by Application 2024 & 2032
- Figure 59: Middle East Sodium-Sulfur Battery Industry Revenue (Million), by Country 2024 & 2032
- Figure 60: Middle East Sodium-Sulfur Battery Industry Volume (K Unit), by Country 2024 & 2032
- Figure 61: Middle East Sodium-Sulfur Battery Industry Revenue Share (%), by Country 2024 & 2032
- Figure 62: Middle East Sodium-Sulfur Battery Industry Volume Share (%), by Country 2024 & 2032
List of Tables
- Table 1: Global Sodium-Sulfur Battery Industry Revenue Million Forecast, by Region 2019 & 2032
- Table 2: Global Sodium-Sulfur Battery Industry Volume K Unit Forecast, by Region 2019 & 2032
- Table 3: Global Sodium-Sulfur Battery Industry Revenue Million Forecast, by Application 2019 & 2032
- Table 4: Global Sodium-Sulfur Battery Industry Volume K Unit Forecast, by Application 2019 & 2032
- Table 5: Global Sodium-Sulfur Battery Industry Revenue Million Forecast, by Region 2019 & 2032
- Table 6: Global Sodium-Sulfur Battery Industry Volume K Unit Forecast, by Region 2019 & 2032
- Table 7: Global Sodium-Sulfur Battery Industry Revenue Million Forecast, by Country 2019 & 2032
- Table 8: Global Sodium-Sulfur Battery Industry Volume K Unit Forecast, by Country 2019 & 2032
- Table 9: United States Sodium-Sulfur Battery Industry Revenue (Million) Forecast, by Application 2019 & 2032
- Table 10: United States Sodium-Sulfur Battery Industry Volume (K Unit) Forecast, by Application 2019 & 2032
- Table 11: Canada Sodium-Sulfur Battery Industry Revenue (Million) Forecast, by Application 2019 & 2032
- Table 12: Canada Sodium-Sulfur Battery Industry Volume (K Unit) Forecast, by Application 2019 & 2032
- Table 13: Mexico Sodium-Sulfur Battery Industry Revenue (Million) Forecast, by Application 2019 & 2032
- Table 14: Mexico Sodium-Sulfur Battery Industry Volume (K Unit) Forecast, by Application 2019 & 2032
- Table 15: Global Sodium-Sulfur Battery Industry Revenue Million Forecast, by Country 2019 & 2032
- Table 16: Global Sodium-Sulfur Battery Industry Volume K Unit Forecast, by Country 2019 & 2032
- Table 17: Germany Sodium-Sulfur Battery Industry Revenue (Million) Forecast, by Application 2019 & 2032
- Table 18: Germany Sodium-Sulfur Battery Industry Volume (K Unit) Forecast, by Application 2019 & 2032
- Table 19: United Kingdom Sodium-Sulfur Battery Industry Revenue (Million) Forecast, by Application 2019 & 2032
- Table 20: United Kingdom Sodium-Sulfur Battery Industry Volume (K Unit) Forecast, by Application 2019 & 2032
- Table 21: France Sodium-Sulfur Battery Industry Revenue (Million) Forecast, by Application 2019 & 2032
- Table 22: France Sodium-Sulfur Battery Industry Volume (K Unit) Forecast, by Application 2019 & 2032
- Table 23: Spain Sodium-Sulfur Battery Industry Revenue (Million) Forecast, by Application 2019 & 2032
- Table 24: Spain Sodium-Sulfur Battery Industry Volume (K Unit) Forecast, by Application 2019 & 2032
- Table 25: Italy Sodium-Sulfur Battery Industry Revenue (Million) Forecast, by Application 2019 & 2032
- Table 26: Italy Sodium-Sulfur Battery Industry Volume (K Unit) Forecast, by Application 2019 & 2032
- Table 27: Spain Sodium-Sulfur Battery Industry Revenue (Million) Forecast, by Application 2019 & 2032
- Table 28: Spain Sodium-Sulfur Battery Industry Volume (K Unit) Forecast, by Application 2019 & 2032
- Table 29: Belgium Sodium-Sulfur Battery Industry Revenue (Million) Forecast, by Application 2019 & 2032
- Table 30: Belgium Sodium-Sulfur Battery Industry Volume (K Unit) Forecast, by Application 2019 & 2032
- Table 31: Netherland Sodium-Sulfur Battery Industry Revenue (Million) Forecast, by Application 2019 & 2032
- Table 32: Netherland Sodium-Sulfur Battery Industry Volume (K Unit) Forecast, by Application 2019 & 2032
- Table 33: Nordics Sodium-Sulfur Battery Industry Revenue (Million) Forecast, by Application 2019 & 2032
- Table 34: Nordics Sodium-Sulfur Battery Industry Volume (K Unit) Forecast, by Application 2019 & 2032
- Table 35: Rest of Europe Sodium-Sulfur Battery Industry Revenue (Million) Forecast, by Application 2019 & 2032
- Table 36: Rest of Europe Sodium-Sulfur Battery Industry Volume (K Unit) Forecast, by Application 2019 & 2032
- Table 37: Global Sodium-Sulfur Battery Industry Revenue Million Forecast, by Country 2019 & 2032
- Table 38: Global Sodium-Sulfur Battery Industry Volume K Unit Forecast, by Country 2019 & 2032
- Table 39: China Sodium-Sulfur Battery Industry Revenue (Million) Forecast, by Application 2019 & 2032
- Table 40: China Sodium-Sulfur Battery Industry Volume (K Unit) Forecast, by Application 2019 & 2032
- Table 41: Japan Sodium-Sulfur Battery Industry Revenue (Million) Forecast, by Application 2019 & 2032
- Table 42: Japan Sodium-Sulfur Battery Industry Volume (K Unit) Forecast, by Application 2019 & 2032
- Table 43: India Sodium-Sulfur Battery Industry Revenue (Million) Forecast, by Application 2019 & 2032
- Table 44: India Sodium-Sulfur Battery Industry Volume (K Unit) Forecast, by Application 2019 & 2032
- Table 45: South Korea Sodium-Sulfur Battery Industry Revenue (Million) Forecast, by Application 2019 & 2032
- Table 46: South Korea Sodium-Sulfur Battery Industry Volume (K Unit) Forecast, by Application 2019 & 2032
- Table 47: Southeast Asia Sodium-Sulfur Battery Industry Revenue (Million) Forecast, by Application 2019 & 2032
- Table 48: Southeast Asia Sodium-Sulfur Battery Industry Volume (K Unit) Forecast, by Application 2019 & 2032
- Table 49: Australia Sodium-Sulfur Battery Industry Revenue (Million) Forecast, by Application 2019 & 2032
- Table 50: Australia Sodium-Sulfur Battery Industry Volume (K Unit) Forecast, by Application 2019 & 2032
- Table 51: Indonesia Sodium-Sulfur Battery Industry Revenue (Million) Forecast, by Application 2019 & 2032
- Table 52: Indonesia Sodium-Sulfur Battery Industry Volume (K Unit) Forecast, by Application 2019 & 2032
- Table 53: Phillipes Sodium-Sulfur Battery Industry Revenue (Million) Forecast, by Application 2019 & 2032
- Table 54: Phillipes Sodium-Sulfur Battery Industry Volume (K Unit) Forecast, by Application 2019 & 2032
- Table 55: Singapore Sodium-Sulfur Battery Industry Revenue (Million) Forecast, by Application 2019 & 2032
- Table 56: Singapore Sodium-Sulfur Battery Industry Volume (K Unit) Forecast, by Application 2019 & 2032
- Table 57: Thailandc Sodium-Sulfur Battery Industry Revenue (Million) Forecast, by Application 2019 & 2032
- Table 58: Thailandc Sodium-Sulfur Battery Industry Volume (K Unit) Forecast, by Application 2019 & 2032
- Table 59: Rest of Asia Pacific Sodium-Sulfur Battery Industry Revenue (Million) Forecast, by Application 2019 & 2032
- Table 60: Rest of Asia Pacific Sodium-Sulfur Battery Industry Volume (K Unit) Forecast, by Application 2019 & 2032
- Table 61: Global Sodium-Sulfur Battery Industry Revenue Million Forecast, by Country 2019 & 2032
- Table 62: Global Sodium-Sulfur Battery Industry Volume K Unit Forecast, by Country 2019 & 2032
- Table 63: Brazil Sodium-Sulfur Battery Industry Revenue (Million) Forecast, by Application 2019 & 2032
- Table 64: Brazil Sodium-Sulfur Battery Industry Volume (K Unit) Forecast, by Application 2019 & 2032
- Table 65: Argentina Sodium-Sulfur Battery Industry Revenue (Million) Forecast, by Application 2019 & 2032
- Table 66: Argentina Sodium-Sulfur Battery Industry Volume (K Unit) Forecast, by Application 2019 & 2032
- Table 67: Peru Sodium-Sulfur Battery Industry Revenue (Million) Forecast, by Application 2019 & 2032
- Table 68: Peru Sodium-Sulfur Battery Industry Volume (K Unit) Forecast, by Application 2019 & 2032
- Table 69: Chile Sodium-Sulfur Battery Industry Revenue (Million) Forecast, by Application 2019 & 2032
- Table 70: Chile Sodium-Sulfur Battery Industry Volume (K Unit) Forecast, by Application 2019 & 2032
- Table 71: Colombia Sodium-Sulfur Battery Industry Revenue (Million) Forecast, by Application 2019 & 2032
- Table 72: Colombia Sodium-Sulfur Battery Industry Volume (K Unit) Forecast, by Application 2019 & 2032
- Table 73: Ecuador Sodium-Sulfur Battery Industry Revenue (Million) Forecast, by Application 2019 & 2032
- Table 74: Ecuador Sodium-Sulfur Battery Industry Volume (K Unit) Forecast, by Application 2019 & 2032
- Table 75: Venezuela Sodium-Sulfur Battery Industry Revenue (Million) Forecast, by Application 2019 & 2032
- Table 76: Venezuela Sodium-Sulfur Battery Industry Volume (K Unit) Forecast, by Application 2019 & 2032
- Table 77: Rest of South America Sodium-Sulfur Battery Industry Revenue (Million) Forecast, by Application 2019 & 2032
- Table 78: Rest of South America Sodium-Sulfur Battery Industry Volume (K Unit) Forecast, by Application 2019 & 2032
- Table 79: Global Sodium-Sulfur Battery Industry Revenue Million Forecast, by Country 2019 & 2032
- Table 80: Global Sodium-Sulfur Battery Industry Volume K Unit Forecast, by Country 2019 & 2032
- Table 81: United Arab Emirates Sodium-Sulfur Battery Industry Revenue (Million) Forecast, by Application 2019 & 2032
- Table 82: United Arab Emirates Sodium-Sulfur Battery Industry Volume (K Unit) Forecast, by Application 2019 & 2032
- Table 83: Saudi Arabia Sodium-Sulfur Battery Industry Revenue (Million) Forecast, by Application 2019 & 2032
- Table 84: Saudi Arabia Sodium-Sulfur Battery Industry Volume (K Unit) Forecast, by Application 2019 & 2032
- Table 85: South Africa Sodium-Sulfur Battery Industry Revenue (Million) Forecast, by Application 2019 & 2032
- Table 86: South Africa Sodium-Sulfur Battery Industry Volume (K Unit) Forecast, by Application 2019 & 2032
- Table 87: Rest of Middle East and Africa Sodium-Sulfur Battery Industry Revenue (Million) Forecast, by Application 2019 & 2032
- Table 88: Rest of Middle East and Africa Sodium-Sulfur Battery Industry Volume (K Unit) Forecast, by Application 2019 & 2032
- Table 89: Global Sodium-Sulfur Battery Industry Revenue Million Forecast, by Application 2019 & 2032
- Table 90: Global Sodium-Sulfur Battery Industry Volume K Unit Forecast, by Application 2019 & 2032
- Table 91: Global Sodium-Sulfur Battery Industry Revenue Million Forecast, by Country 2019 & 2032
- Table 92: Global Sodium-Sulfur Battery Industry Volume K Unit Forecast, by Country 2019 & 2032
- Table 93: Global Sodium-Sulfur Battery Industry Revenue Million Forecast, by Application 2019 & 2032
- Table 94: Global Sodium-Sulfur Battery Industry Volume K Unit Forecast, by Application 2019 & 2032
- Table 95: Global Sodium-Sulfur Battery Industry Revenue Million Forecast, by Country 2019 & 2032
- Table 96: Global Sodium-Sulfur Battery Industry Volume K Unit Forecast, by Country 2019 & 2032
- Table 97: Global Sodium-Sulfur Battery Industry Revenue Million Forecast, by Application 2019 & 2032
- Table 98: Global Sodium-Sulfur Battery Industry Volume K Unit Forecast, by Application 2019 & 2032
- Table 99: Global Sodium-Sulfur Battery Industry Revenue Million Forecast, by Country 2019 & 2032
- Table 100: Global Sodium-Sulfur Battery Industry Volume K Unit Forecast, by Country 2019 & 2032
- Table 101: Global Sodium-Sulfur Battery Industry Revenue Million Forecast, by Application 2019 & 2032
- Table 102: Global Sodium-Sulfur Battery Industry Volume K Unit Forecast, by Application 2019 & 2032
- Table 103: Global Sodium-Sulfur Battery Industry Revenue Million Forecast, by Country 2019 & 2032
- Table 104: Global Sodium-Sulfur Battery Industry Volume K Unit Forecast, by Country 2019 & 2032
- Table 105: Global Sodium-Sulfur Battery Industry Revenue Million Forecast, by Application 2019 & 2032
- Table 106: Global Sodium-Sulfur Battery Industry Volume K Unit Forecast, by Application 2019 & 2032
- Table 107: Global Sodium-Sulfur Battery Industry Revenue Million Forecast, by Country 2019 & 2032
- Table 108: Global Sodium-Sulfur Battery Industry Volume K Unit Forecast, by Country 2019 & 2032
Frequently Asked Questions
1. What is the projected Compound Annual Growth Rate (CAGR) of the Sodium-Sulfur Battery Industry?
The projected CAGR is approximately > 13.00%.
2. Which companies are prominent players in the Sodium-Sulfur Battery Industry?
Key companies in the market include NGK Insulators Ltd, BASF SE, SAMSUNG SDI, A123 Systems Corp , Sion Power Corporation.
3. What are the main segments of the Sodium-Sulfur Battery Industry?
The market segments include Application.
4. Can you provide details about the market size?
The market size is estimated to be USD XX Million as of 2022.
5. What are some drivers contributing to market growth?
4.; Increasing Amount of Waste Generation. Growing Concern for Waste Management to Meet the Needs for Sustainable Urban Living4.; Increasing Focus on Non-fossil Fuel Sources of Energy.
6. What are the notable trends driving market growth?
Renewable Energy Stabilization Expected to Witness Significant Growth.
7. Are there any restraints impacting market growth?
4.; Expensive Nature of Incinerators.
8. Can you provide examples of recent developments in the market?
In October 2021, German chemicals company BASF's subsidiary BASF New Business (BNB) commissioned the energy storage system consisting of four NAS battery containers integrated into the electricity grid at BASF's Verbund site in Antwerp, Belgium.
9. What pricing options are available for accessing the report?
Pricing options include single-user, multi-user, and enterprise licenses priced at USD 4750, USD 5250, and USD 8750 respectively.
10. Is the market size provided in terms of value or volume?
The market size is provided in terms of value, measured in Million and volume, measured in K Unit.
11. Are there any specific market keywords associated with the report?
Yes, the market keyword associated with the report is "Sodium-Sulfur Battery Industry," which aids in identifying and referencing the specific market segment covered.
12. How do I determine which pricing option suits my needs best?
The pricing options vary based on user requirements and access needs. Individual users may opt for single-user licenses, while businesses requiring broader access may choose multi-user or enterprise licenses for cost-effective access to the report.
13. Are there any additional resources or data provided in the Sodium-Sulfur Battery Industry report?
While the report offers comprehensive insights, it's advisable to review the specific contents or supplementary materials provided to ascertain if additional resources or data are available.
14. How can I stay updated on further developments or reports in the Sodium-Sulfur Battery Industry?
To stay informed about further developments, trends, and reports in the Sodium-Sulfur Battery Industry, consider subscribing to industry newsletters, following relevant companies and organizations, or regularly checking reputable industry news sources and publications.
Methodology
Step 1 - Identification of Relevant Samples Size from Population Database


Step 2 - Approaches for Defining Global Market Size (Value, Volume* & Price*)

Note*: In applicable scenarios
Step 3 - Data Sources
Primary Research
- Web Analytics
- Survey Reports
- Research Institute
- Latest Research Reports
- Opinion Leaders
Secondary Research
- Annual Reports
- White Paper
- Latest Press Release
- Industry Association
- Paid Database
- Investor Presentations

Step 4 - Data Triangulation
Involves using different sources of information in order to increase the validity of a study
These sources are likely to be stakeholders in a program - participants, other researchers, program staff, other community members, and so on.
Then we put all data in single framework & apply various statistical tools to find out the dynamic on the market.
During the analysis stage, feedback from the stakeholder groups would be compared to determine areas of agreement as well as areas of divergence


