
Key Insights
The global sodium reduction ingredients market is experiencing robust growth, projected to reach a substantial size driven by increasing health consciousness among consumers and stringent government regulations aimed at curbing sodium intake. The market's Compound Annual Growth Rate (CAGR) of 11.71% from 2019 to 2024 indicates a significant upward trajectory. This expansion is fueled by several key factors. Firstly, the rising prevalence of diet-related diseases like hypertension and cardiovascular ailments is pushing consumers towards low-sodium food options. Secondly, food manufacturers are actively seeking innovative solutions to reduce sodium content without compromising taste or texture, leading to heightened demand for effective sodium reduction ingredients. Furthermore, growing government initiatives promoting healthier diets and the implementation of mandatory sodium reduction targets in several regions further accelerate market growth. The market is segmented by product type (amino acids & glutamates, mineral salts, calcium chloride, yeast extracts, others) and application (bakery & confectionery, condiments, seasonings & sauces, dairy & frozen foods, meat & meat products, snacks, others). The leading players in this competitive landscape are leveraging research and development to introduce innovative and effective sodium reduction solutions. Regional variations in market penetration are expected, with North America and Europe currently holding significant market shares due to high consumer awareness and regulatory pressure. However, the Asia-Pacific region is expected to witness significant growth in the coming years due to its rapidly expanding food processing sector and increasing health awareness.
The market's future growth will likely be influenced by evolving consumer preferences, technological advancements in ingredient development, and the effectiveness of government policies. Companies are investing heavily in research to develop novel sodium reduction solutions that can successfully address the challenges of maintaining palatability and cost-effectiveness. The successful integration of these solutions into food products across various applications will be crucial in determining the market's long-term growth potential. Furthermore, consumer education regarding the benefits of reduced sodium intake and collaboration between food manufacturers, researchers, and regulatory bodies are expected to play a critical role in shaping the future of the sodium reduction ingredients market. Sustained innovation and addressing consumer concerns regarding taste and price will be key determinants of market success.
Sodium Reduction Ingredients Industry Market Report: 2019-2033
This comprehensive report provides an in-depth analysis of the Sodium Reduction Ingredients market, encompassing market dynamics, growth trends, regional dominance, product landscape, key players, and future outlook. The study period covers 2019-2033, with 2025 as the base and estimated year. The report segments the market by product type (Amino Acids & Glutamates, Mineral Salts, Calcium Chloride, Yeast Extracts, Others) and application (Bakery & Confectionery, Condiments, Seasonings & Sauces, Dairy & Frozen Foods, Meat & Meat Products, Snacks, Others), offering granular insights into this vital sector of the food and beverage industry. The global market size is expected to reach xx Million by 2033.
Sodium Reduction Ingredients Industry Market Dynamics & Structure
The Sodium Reduction Ingredients market is characterized by moderate concentration, with several key players holding significant market share. Technological innovation, driven by the increasing demand for healthier food options and stricter regulatory frameworks concerning sodium intake, plays a crucial role. Competitive pressure from product substitutes, such as potassium-based alternatives, is also significant. The market is influenced by evolving end-user demographics, with a growing focus on health and wellness driving demand. M&A activity remains steady, with companies seeking to expand their product portfolios and geographic reach. The report analyzes the market structure and dynamics, incorporating quantitative data (market share, M&A deal volumes) and qualitative factors such as innovation barriers.
- Market Concentration: Moderately concentrated, with top 5 players holding approximately xx% market share (2024).
- Technological Innovation: Focus on developing novel sodium reduction solutions with minimal impact on taste and texture.
- Regulatory Frameworks: Stringent regulations in several regions are driving the adoption of sodium reduction ingredients.
- Competitive Substitutes: Potassium chloride and other mineral salts pose a competitive threat.
- End-User Demographics: Growing health consciousness among consumers fuels market growth.
- M&A Trends: Consolidation through mergers and acquisitions is expected to continue.
Sodium Reduction Ingredients Industry Growth Trends & Insights
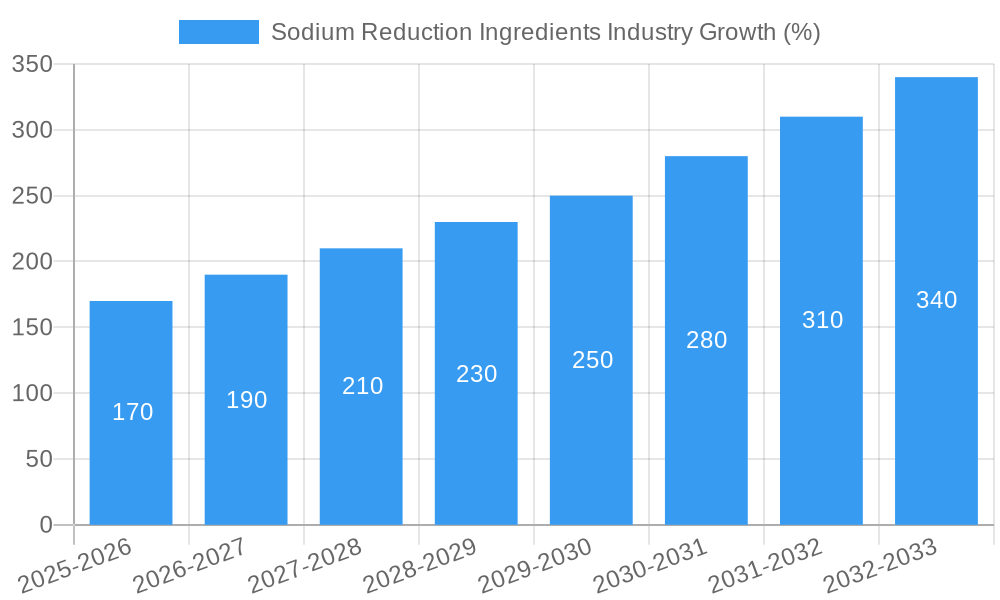
The Sodium Reduction Ingredients market exhibits robust growth, driven by escalating health concerns, changing consumer preferences, and stringent government regulations aimed at reducing sodium consumption. The market size experienced substantial growth during the historical period (2019-2024), registering a CAGR of xx%. This growth trajectory is projected to continue during the forecast period (2025-2033), with a projected CAGR of xx%. Technological advancements in taste masking and preservation techniques further enhance market penetration. Shifting consumer behavior towards healthier dietary habits and increased awareness of the health risks associated with high sodium intake are key factors.
Dominant Regions, Countries, or Segments in Sodium Reduction Ingredients Industry
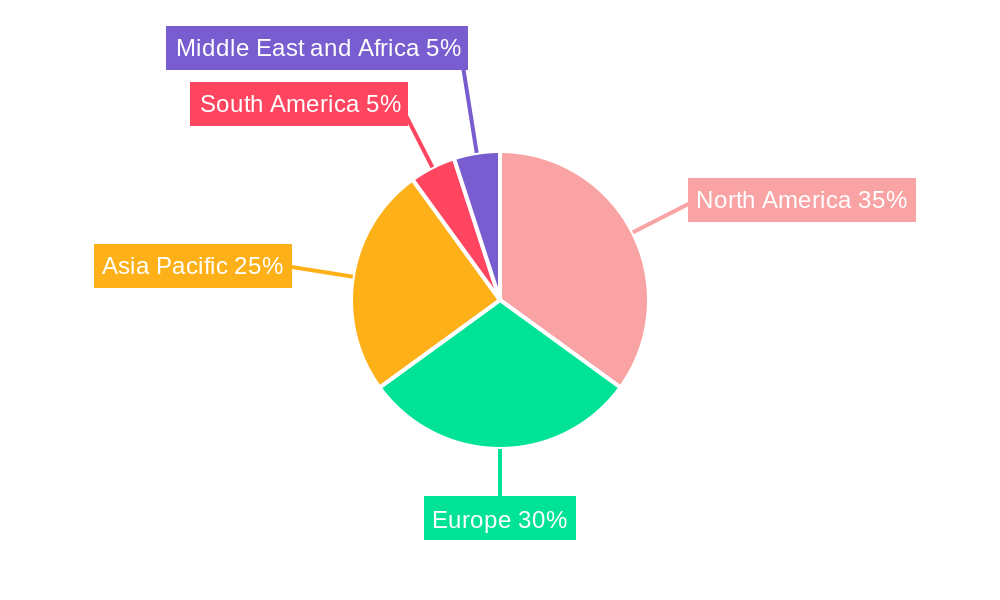
North America and Europe currently dominate the Sodium Reduction Ingredients market, owing to stringent regulations, high consumer awareness, and established food processing industries. However, Asia-Pacific is poised for significant growth, driven by rising disposable incomes, changing dietary habits, and increasing health consciousness. Within the product segments, Mineral Salts and Yeast Extracts currently hold the largest market share, while the Bakery & Confectionery and Condiments, Seasonings & Sauces applications segments demonstrate the highest growth potential.
- Key Drivers: Stringent government regulations, rising health concerns, and changing consumer preferences.
- Dominant Regions: North America and Europe hold a significant market share.
- High-Growth Segments: Mineral Salts and Yeast Extracts by product type; Bakery & Confectionery and Condiments, Seasonings & Sauces by application.
- Growth Potential: Asia-Pacific exhibits high growth potential.
Sodium Reduction Ingredients Industry Product Landscape
The Sodium Reduction Ingredients market is witnessing continuous innovation in product development. Manufacturers are focusing on improving taste and texture while minimizing sodium content. This includes the development of novel salt substitutes, advanced flavor enhancers, and improved formulations of existing products. Technological advancements, such as microencapsulation and controlled release technologies, enhance the functionality and performance of these ingredients. Unique selling propositions include improved taste, texture, and functionality, and reduced sodium content.
Key Drivers, Barriers & Challenges in Sodium Reduction Ingredients Industry
Key Drivers: Growing health awareness, stringent government regulations promoting sodium reduction, increasing demand for healthier food products. Examples include the FDA's voluntary sodium reduction targets and various national initiatives.
Challenges: High cost of production for some sodium reduction ingredients compared to traditional salt, potential impact on taste and texture, regulatory hurdles and varying regulations across different regions, competitive pressures from existing and emerging players.
Emerging Opportunities in Sodium Reduction Ingredients Industry
Emerging opportunities lie in developing innovative sodium reduction solutions for emerging markets, exploring novel applications of existing ingredients in new product categories, catering to niche dietary needs (e.g., vegan, organic), and capitalizing on growing interest in functional foods.
Growth Accelerators in the Sodium Reduction Ingredients Industry
Technological breakthroughs in taste masking and flavor enhancement, coupled with strategic partnerships between ingredient suppliers and food manufacturers, will accelerate market growth. Furthermore, expanding into new geographic markets and developing tailored solutions for specific food applications will be crucial for sustained expansion.
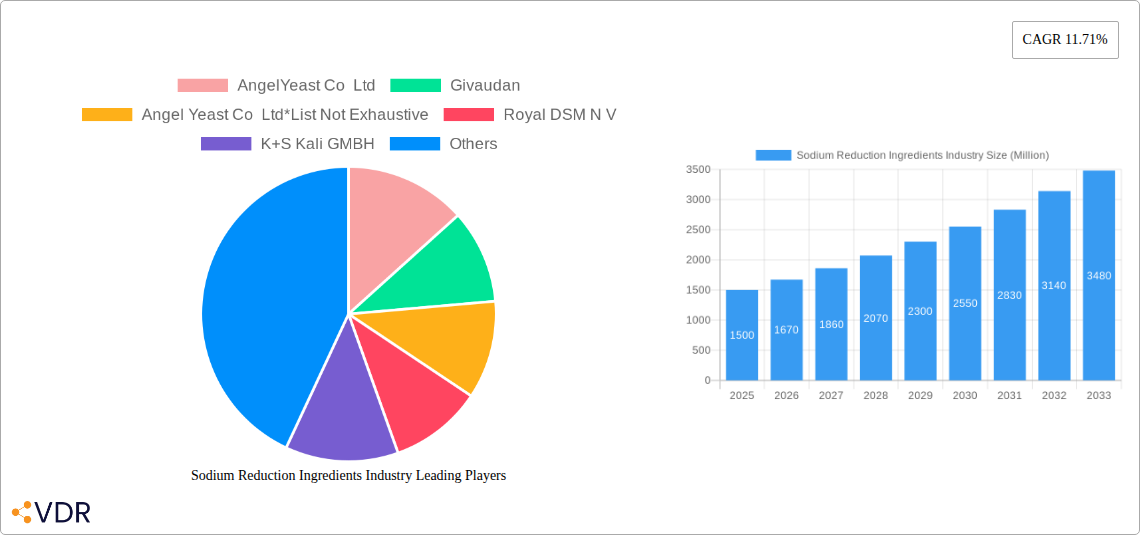
Key Players Shaping the Sodium Reduction Ingredients Industry Market
- Angel Yeast Co Ltd
- Givaudan
- Royal DSM N V
- K+S Kali GMBH
- Advanced Food Systems Inc
- Kerry Group Plc
- DuPont
- Dr Paul Lohmann GmbH & Co KGaA
- Cargill Inc
Notable Milestones in Sodium Reduction Ingredients Industry Sector
- 2021 (November): Cargill Salt launched a new purified sea salt flour, suitable for various blending applications.
- 2021: Tata Salt introduced India's first 30% low-sodium salt, Tata Salt SuperLite.
- 2021: Food For Life launched three low-sodium products: Ezekiel 4:9 Low Sodium Sprouted Flourless English Muffins, Ezekiel 4:9 Low Sodium Sprouted Flourless Crunchy Cereal, and Ezekiel 4:9 Low Sodium Sprouted Flourless Tortillas.
In-Depth Sodium Reduction Ingredients Industry Market Outlook
The Sodium Reduction Ingredients market is poised for continued growth, driven by sustained consumer demand for healthier options and ongoing regulatory efforts. Strategic partnerships, technological advancements, and expansion into untapped markets will shape future market dynamics. The market presents lucrative opportunities for players who can innovate, adapt to evolving consumer preferences, and navigate regulatory complexities.
Sodium Reduction Ingredients Industry Segmentation
-
1. Product Type
- 1.1. Amino Acids & Glutamates
-
1.2. Mineral Salts
- 1.2.1. Potassium Chloride
- 1.2.2. Magnesium Sulphate
- 1.2.3. Potassium Lactate
- 1.2.4. Calcium Chloride
- 1.3. Yeast Extracts
- 1.4. Others
-
2. Application
- 2.1. Bakery & Confectionery
- 2.2. Condiments, Seasonings & Sauces
- 2.3. Dairy & Frozen Foods
- 2.4. Meat & Meat Products
- 2.5. Snacks
- 2.6. Others
Sodium Reduction Ingredients Industry Segmentation By Geography
-
1. North America
- 1.1. United States
- 1.2. Canada
- 1.3. Mexico
- 1.4. Rest of North America
-
2. Europe
- 2.1. United Kingdom
- 2.2. Germany
- 2.3. France
- 2.4. Russia
- 2.5. Italy
- 2.6. Spain
- 2.7. Rest of Europe
-
3. Asia Pacific
- 3.1. India
- 3.2. China
- 3.3. Japan
- 3.4. Australia
- 3.5. Rest of Asia Pacific
-
4. South America
- 4.1. Brazil
- 4.2. Argentina
- 4.3. Rest of South America
-
5. Middle East and Africa
- 5.1. South Africa
- 5.2. Saudi Arabia
- 5.3. Rest of Middle East and Africa
Sodium Reduction Ingredients Industry REPORT HIGHLIGHTS
| Aspects | Details |
|---|---|
| Study Period | 2019-2033 |
| Base Year | 2024 |
| Estimated Year | 2025 |
| Forecast Period | 2025-2033 |
| Historical Period | 2019-2024 |
| Growth Rate | CAGR of 11.71% from 2019-2033 |
| Segmentation |
|
Table of Contents
- 1. Introduction
- 1.1. Research Scope
- 1.2. Market Segmentation
- 1.3. Research Methodology
- 1.4. Definitions and Assumptions
- 2. Executive Summary
- 2.1. Introduction
- 3. Market Dynamics
- 3.1. Introduction
- 3.2. Market Drivers
- 3.2.1. Increasing Focus on Maintaining Health and Well-Being; Launching Supplements For Specific Purposes and Targeted Population
- 3.3. Market Restrains
- 3.3.1. Supplement Consumption and Their Side-effects; Inclination Towards Substitute Products
- 3.4. Market Trends
- 3.4.1. Growing Consumer Awareness Toward High Sodium Intake
- 4. Market Factor Analysis
- 4.1. Porters Five Forces
- 4.2. Supply/Value Chain
- 4.3. PESTEL analysis
- 4.4. Market Entropy
- 4.5. Patent/Trademark Analysis
- 5. Global Sodium Reduction Ingredients Industry Analysis, Insights and Forecast, 2019-2031
- 5.1. Market Analysis, Insights and Forecast - by Product Type
- 5.1.1. Amino Acids & Glutamates
- 5.1.2. Mineral Salts
- 5.1.2.1. Potassium Chloride
- 5.1.2.2. Magnesium Sulphate
- 5.1.2.3. Potassium Lactate
- 5.1.2.4. Calcium Chloride
- 5.1.3. Yeast Extracts
- 5.1.4. Others
- 5.2. Market Analysis, Insights and Forecast - by Application
- 5.2.1. Bakery & Confectionery
- 5.2.2. Condiments, Seasonings & Sauces
- 5.2.3. Dairy & Frozen Foods
- 5.2.4. Meat & Meat Products
- 5.2.5. Snacks
- 5.2.6. Others
- 5.3. Market Analysis, Insights and Forecast - by Region
- 5.3.1. North America
- 5.3.2. Europe
- 5.3.3. Asia Pacific
- 5.3.4. South America
- 5.3.5. Middle East and Africa
- 5.1. Market Analysis, Insights and Forecast - by Product Type
- 6. North America Sodium Reduction Ingredients Industry Analysis, Insights and Forecast, 2019-2031
- 6.1. Market Analysis, Insights and Forecast - by Product Type
- 6.1.1. Amino Acids & Glutamates
- 6.1.2. Mineral Salts
- 6.1.2.1. Potassium Chloride
- 6.1.2.2. Magnesium Sulphate
- 6.1.2.3. Potassium Lactate
- 6.1.2.4. Calcium Chloride
- 6.1.3. Yeast Extracts
- 6.1.4. Others
- 6.2. Market Analysis, Insights and Forecast - by Application
- 6.2.1. Bakery & Confectionery
- 6.2.2. Condiments, Seasonings & Sauces
- 6.2.3. Dairy & Frozen Foods
- 6.2.4. Meat & Meat Products
- 6.2.5. Snacks
- 6.2.6. Others
- 6.1. Market Analysis, Insights and Forecast - by Product Type
- 7. Europe Sodium Reduction Ingredients Industry Analysis, Insights and Forecast, 2019-2031
- 7.1. Market Analysis, Insights and Forecast - by Product Type
- 7.1.1. Amino Acids & Glutamates
- 7.1.2. Mineral Salts
- 7.1.2.1. Potassium Chloride
- 7.1.2.2. Magnesium Sulphate
- 7.1.2.3. Potassium Lactate
- 7.1.2.4. Calcium Chloride
- 7.1.3. Yeast Extracts
- 7.1.4. Others
- 7.2. Market Analysis, Insights and Forecast - by Application
- 7.2.1. Bakery & Confectionery
- 7.2.2. Condiments, Seasonings & Sauces
- 7.2.3. Dairy & Frozen Foods
- 7.2.4. Meat & Meat Products
- 7.2.5. Snacks
- 7.2.6. Others
- 7.1. Market Analysis, Insights and Forecast - by Product Type
- 8. Asia Pacific Sodium Reduction Ingredients Industry Analysis, Insights and Forecast, 2019-2031
- 8.1. Market Analysis, Insights and Forecast - by Product Type
- 8.1.1. Amino Acids & Glutamates
- 8.1.2. Mineral Salts
- 8.1.2.1. Potassium Chloride
- 8.1.2.2. Magnesium Sulphate
- 8.1.2.3. Potassium Lactate
- 8.1.2.4. Calcium Chloride
- 8.1.3. Yeast Extracts
- 8.1.4. Others
- 8.2. Market Analysis, Insights and Forecast - by Application
- 8.2.1. Bakery & Confectionery
- 8.2.2. Condiments, Seasonings & Sauces
- 8.2.3. Dairy & Frozen Foods
- 8.2.4. Meat & Meat Products
- 8.2.5. Snacks
- 8.2.6. Others
- 8.1. Market Analysis, Insights and Forecast - by Product Type
- 9. South America Sodium Reduction Ingredients Industry Analysis, Insights and Forecast, 2019-2031
- 9.1. Market Analysis, Insights and Forecast - by Product Type
- 9.1.1. Amino Acids & Glutamates
- 9.1.2. Mineral Salts
- 9.1.2.1. Potassium Chloride
- 9.1.2.2. Magnesium Sulphate
- 9.1.2.3. Potassium Lactate
- 9.1.2.4. Calcium Chloride
- 9.1.3. Yeast Extracts
- 9.1.4. Others
- 9.2. Market Analysis, Insights and Forecast - by Application
- 9.2.1. Bakery & Confectionery
- 9.2.2. Condiments, Seasonings & Sauces
- 9.2.3. Dairy & Frozen Foods
- 9.2.4. Meat & Meat Products
- 9.2.5. Snacks
- 9.2.6. Others
- 9.1. Market Analysis, Insights and Forecast - by Product Type
- 10. Middle East and Africa Sodium Reduction Ingredients Industry Analysis, Insights and Forecast, 2019-2031
- 10.1. Market Analysis, Insights and Forecast - by Product Type
- 10.1.1. Amino Acids & Glutamates
- 10.1.2. Mineral Salts
- 10.1.2.1. Potassium Chloride
- 10.1.2.2. Magnesium Sulphate
- 10.1.2.3. Potassium Lactate
- 10.1.2.4. Calcium Chloride
- 10.1.3. Yeast Extracts
- 10.1.4. Others
- 10.2. Market Analysis, Insights and Forecast - by Application
- 10.2.1. Bakery & Confectionery
- 10.2.2. Condiments, Seasonings & Sauces
- 10.2.3. Dairy & Frozen Foods
- 10.2.4. Meat & Meat Products
- 10.2.5. Snacks
- 10.2.6. Others
- 10.1. Market Analysis, Insights and Forecast - by Product Type
- 11. North America Sodium Reduction Ingredients Industry Analysis, Insights and Forecast, 2019-2031
- 11.1. Market Analysis, Insights and Forecast - By Country/Sub-region
- 11.1.1 United States
- 11.1.2 Canada
- 11.1.3 Mexico
- 11.1.4 Rest of North America
- 12. Europe Sodium Reduction Ingredients Industry Analysis, Insights and Forecast, 2019-2031
- 12.1. Market Analysis, Insights and Forecast - By Country/Sub-region
- 12.1.1 United Kingdom
- 12.1.2 Germany
- 12.1.3 France
- 12.1.4 Russia
- 12.1.5 Italy
- 12.1.6 Spain
- 12.1.7 Rest of Europe
- 13. Asia Pacific Sodium Reduction Ingredients Industry Analysis, Insights and Forecast, 2019-2031
- 13.1. Market Analysis, Insights and Forecast - By Country/Sub-region
- 13.1.1 India
- 13.1.2 China
- 13.1.3 Japan
- 13.1.4 Australia
- 13.1.5 Rest of Asia Pacific
- 14. South America Sodium Reduction Ingredients Industry Analysis, Insights and Forecast, 2019-2031
- 14.1. Market Analysis, Insights and Forecast - By Country/Sub-region
- 14.1.1 Brazil
- 14.1.2 Argentina
- 14.1.3 Rest of South America
- 15. Middle East and Africa Sodium Reduction Ingredients Industry Analysis, Insights and Forecast, 2019-2031
- 15.1. Market Analysis, Insights and Forecast - By Country/Sub-region
- 15.1.1 South Africa
- 15.1.2 Saudi Arabia
- 15.1.3 Rest of Middle East and Africa
- 16. Competitive Analysis
- 16.1. Global Market Share Analysis 2024
- 16.2. Company Profiles
- 16.2.1 AngelYeast Co Ltd
- 16.2.1.1. Overview
- 16.2.1.2. Products
- 16.2.1.3. SWOT Analysis
- 16.2.1.4. Recent Developments
- 16.2.1.5. Financials (Based on Availability)
- 16.2.2 Givaudan
- 16.2.2.1. Overview
- 16.2.2.2. Products
- 16.2.2.3. SWOT Analysis
- 16.2.2.4. Recent Developments
- 16.2.2.5. Financials (Based on Availability)
- 16.2.3 Angel Yeast Co Ltd*List Not Exhaustive
- 16.2.3.1. Overview
- 16.2.3.2. Products
- 16.2.3.3. SWOT Analysis
- 16.2.3.4. Recent Developments
- 16.2.3.5. Financials (Based on Availability)
- 16.2.4 Royal DSM N V
- 16.2.4.1. Overview
- 16.2.4.2. Products
- 16.2.4.3. SWOT Analysis
- 16.2.4.4. Recent Developments
- 16.2.4.5. Financials (Based on Availability)
- 16.2.5 K+S Kali GMBH
- 16.2.5.1. Overview
- 16.2.5.2. Products
- 16.2.5.3. SWOT Analysis
- 16.2.5.4. Recent Developments
- 16.2.5.5. Financials (Based on Availability)
- 16.2.6 Advanced Food Systems Inc
- 16.2.6.1. Overview
- 16.2.6.2. Products
- 16.2.6.3. SWOT Analysis
- 16.2.6.4. Recent Developments
- 16.2.6.5. Financials (Based on Availability)
- 16.2.7 Kerry Group Plc
- 16.2.7.1. Overview
- 16.2.7.2. Products
- 16.2.7.3. SWOT Analysis
- 16.2.7.4. Recent Developments
- 16.2.7.5. Financials (Based on Availability)
- 16.2.8 DuPont
- 16.2.8.1. Overview
- 16.2.8.2. Products
- 16.2.8.3. SWOT Analysis
- 16.2.8.4. Recent Developments
- 16.2.8.5. Financials (Based on Availability)
- 16.2.9 Dr Paul Lohmann GmbH & Co KGaA
- 16.2.9.1. Overview
- 16.2.9.2. Products
- 16.2.9.3. SWOT Analysis
- 16.2.9.4. Recent Developments
- 16.2.9.5. Financials (Based on Availability)
- 16.2.10 Cargill Inc
- 16.2.10.1. Overview
- 16.2.10.2. Products
- 16.2.10.3. SWOT Analysis
- 16.2.10.4. Recent Developments
- 16.2.10.5. Financials (Based on Availability)
- 16.2.1 AngelYeast Co Ltd
List of Figures
- Figure 1: Global Sodium Reduction Ingredients Industry Revenue Breakdown (Million, %) by Region 2024 & 2032
- Figure 2: North America Sodium Reduction Ingredients Industry Revenue (Million), by Country 2024 & 2032
- Figure 3: North America Sodium Reduction Ingredients Industry Revenue Share (%), by Country 2024 & 2032
- Figure 4: Europe Sodium Reduction Ingredients Industry Revenue (Million), by Country 2024 & 2032
- Figure 5: Europe Sodium Reduction Ingredients Industry Revenue Share (%), by Country 2024 & 2032
- Figure 6: Asia Pacific Sodium Reduction Ingredients Industry Revenue (Million), by Country 2024 & 2032
- Figure 7: Asia Pacific Sodium Reduction Ingredients Industry Revenue Share (%), by Country 2024 & 2032
- Figure 8: South America Sodium Reduction Ingredients Industry Revenue (Million), by Country 2024 & 2032
- Figure 9: South America Sodium Reduction Ingredients Industry Revenue Share (%), by Country 2024 & 2032
- Figure 10: Middle East and Africa Sodium Reduction Ingredients Industry Revenue (Million), by Country 2024 & 2032
- Figure 11: Middle East and Africa Sodium Reduction Ingredients Industry Revenue Share (%), by Country 2024 & 2032
- Figure 12: North America Sodium Reduction Ingredients Industry Revenue (Million), by Product Type 2024 & 2032
- Figure 13: North America Sodium Reduction Ingredients Industry Revenue Share (%), by Product Type 2024 & 2032
- Figure 14: North America Sodium Reduction Ingredients Industry Revenue (Million), by Application 2024 & 2032
- Figure 15: North America Sodium Reduction Ingredients Industry Revenue Share (%), by Application 2024 & 2032
- Figure 16: North America Sodium Reduction Ingredients Industry Revenue (Million), by Country 2024 & 2032
- Figure 17: North America Sodium Reduction Ingredients Industry Revenue Share (%), by Country 2024 & 2032
- Figure 18: Europe Sodium Reduction Ingredients Industry Revenue (Million), by Product Type 2024 & 2032
- Figure 19: Europe Sodium Reduction Ingredients Industry Revenue Share (%), by Product Type 2024 & 2032
- Figure 20: Europe Sodium Reduction Ingredients Industry Revenue (Million), by Application 2024 & 2032
- Figure 21: Europe Sodium Reduction Ingredients Industry Revenue Share (%), by Application 2024 & 2032
- Figure 22: Europe Sodium Reduction Ingredients Industry Revenue (Million), by Country 2024 & 2032
- Figure 23: Europe Sodium Reduction Ingredients Industry Revenue Share (%), by Country 2024 & 2032
- Figure 24: Asia Pacific Sodium Reduction Ingredients Industry Revenue (Million), by Product Type 2024 & 2032
- Figure 25: Asia Pacific Sodium Reduction Ingredients Industry Revenue Share (%), by Product Type 2024 & 2032
- Figure 26: Asia Pacific Sodium Reduction Ingredients Industry Revenue (Million), by Application 2024 & 2032
- Figure 27: Asia Pacific Sodium Reduction Ingredients Industry Revenue Share (%), by Application 2024 & 2032
- Figure 28: Asia Pacific Sodium Reduction Ingredients Industry Revenue (Million), by Country 2024 & 2032
- Figure 29: Asia Pacific Sodium Reduction Ingredients Industry Revenue Share (%), by Country 2024 & 2032
- Figure 30: South America Sodium Reduction Ingredients Industry Revenue (Million), by Product Type 2024 & 2032
- Figure 31: South America Sodium Reduction Ingredients Industry Revenue Share (%), by Product Type 2024 & 2032
- Figure 32: South America Sodium Reduction Ingredients Industry Revenue (Million), by Application 2024 & 2032
- Figure 33: South America Sodium Reduction Ingredients Industry Revenue Share (%), by Application 2024 & 2032
- Figure 34: South America Sodium Reduction Ingredients Industry Revenue (Million), by Country 2024 & 2032
- Figure 35: South America Sodium Reduction Ingredients Industry Revenue Share (%), by Country 2024 & 2032
- Figure 36: Middle East and Africa Sodium Reduction Ingredients Industry Revenue (Million), by Product Type 2024 & 2032
- Figure 37: Middle East and Africa Sodium Reduction Ingredients Industry Revenue Share (%), by Product Type 2024 & 2032
- Figure 38: Middle East and Africa Sodium Reduction Ingredients Industry Revenue (Million), by Application 2024 & 2032
- Figure 39: Middle East and Africa Sodium Reduction Ingredients Industry Revenue Share (%), by Application 2024 & 2032
- Figure 40: Middle East and Africa Sodium Reduction Ingredients Industry Revenue (Million), by Country 2024 & 2032
- Figure 41: Middle East and Africa Sodium Reduction Ingredients Industry Revenue Share (%), by Country 2024 & 2032
List of Tables
- Table 1: Global Sodium Reduction Ingredients Industry Revenue Million Forecast, by Region 2019 & 2032
- Table 2: Global Sodium Reduction Ingredients Industry Revenue Million Forecast, by Product Type 2019 & 2032
- Table 3: Global Sodium Reduction Ingredients Industry Revenue Million Forecast, by Application 2019 & 2032
- Table 4: Global Sodium Reduction Ingredients Industry Revenue Million Forecast, by Region 2019 & 2032
- Table 5: Global Sodium Reduction Ingredients Industry Revenue Million Forecast, by Country 2019 & 2032
- Table 6: United States Sodium Reduction Ingredients Industry Revenue (Million) Forecast, by Application 2019 & 2032
- Table 7: Canada Sodium Reduction Ingredients Industry Revenue (Million) Forecast, by Application 2019 & 2032
- Table 8: Mexico Sodium Reduction Ingredients Industry Revenue (Million) Forecast, by Application 2019 & 2032
- Table 9: Rest of North America Sodium Reduction Ingredients Industry Revenue (Million) Forecast, by Application 2019 & 2032
- Table 10: Global Sodium Reduction Ingredients Industry Revenue Million Forecast, by Country 2019 & 2032
- Table 11: United Kingdom Sodium Reduction Ingredients Industry Revenue (Million) Forecast, by Application 2019 & 2032
- Table 12: Germany Sodium Reduction Ingredients Industry Revenue (Million) Forecast, by Application 2019 & 2032
- Table 13: France Sodium Reduction Ingredients Industry Revenue (Million) Forecast, by Application 2019 & 2032
- Table 14: Russia Sodium Reduction Ingredients Industry Revenue (Million) Forecast, by Application 2019 & 2032
- Table 15: Italy Sodium Reduction Ingredients Industry Revenue (Million) Forecast, by Application 2019 & 2032
- Table 16: Spain Sodium Reduction Ingredients Industry Revenue (Million) Forecast, by Application 2019 & 2032
- Table 17: Rest of Europe Sodium Reduction Ingredients Industry Revenue (Million) Forecast, by Application 2019 & 2032
- Table 18: Global Sodium Reduction Ingredients Industry Revenue Million Forecast, by Country 2019 & 2032
- Table 19: India Sodium Reduction Ingredients Industry Revenue (Million) Forecast, by Application 2019 & 2032
- Table 20: China Sodium Reduction Ingredients Industry Revenue (Million) Forecast, by Application 2019 & 2032
- Table 21: Japan Sodium Reduction Ingredients Industry Revenue (Million) Forecast, by Application 2019 & 2032
- Table 22: Australia Sodium Reduction Ingredients Industry Revenue (Million) Forecast, by Application 2019 & 2032
- Table 23: Rest of Asia Pacific Sodium Reduction Ingredients Industry Revenue (Million) Forecast, by Application 2019 & 2032
- Table 24: Global Sodium Reduction Ingredients Industry Revenue Million Forecast, by Country 2019 & 2032
- Table 25: Brazil Sodium Reduction Ingredients Industry Revenue (Million) Forecast, by Application 2019 & 2032
- Table 26: Argentina Sodium Reduction Ingredients Industry Revenue (Million) Forecast, by Application 2019 & 2032
- Table 27: Rest of South America Sodium Reduction Ingredients Industry Revenue (Million) Forecast, by Application 2019 & 2032
- Table 28: Global Sodium Reduction Ingredients Industry Revenue Million Forecast, by Country 2019 & 2032
- Table 29: South Africa Sodium Reduction Ingredients Industry Revenue (Million) Forecast, by Application 2019 & 2032
- Table 30: Saudi Arabia Sodium Reduction Ingredients Industry Revenue (Million) Forecast, by Application 2019 & 2032
- Table 31: Rest of Middle East and Africa Sodium Reduction Ingredients Industry Revenue (Million) Forecast, by Application 2019 & 2032
- Table 32: Global Sodium Reduction Ingredients Industry Revenue Million Forecast, by Product Type 2019 & 2032
- Table 33: Global Sodium Reduction Ingredients Industry Revenue Million Forecast, by Application 2019 & 2032
- Table 34: Global Sodium Reduction Ingredients Industry Revenue Million Forecast, by Country 2019 & 2032
- Table 35: United States Sodium Reduction Ingredients Industry Revenue (Million) Forecast, by Application 2019 & 2032
- Table 36: Canada Sodium Reduction Ingredients Industry Revenue (Million) Forecast, by Application 2019 & 2032
- Table 37: Mexico Sodium Reduction Ingredients Industry Revenue (Million) Forecast, by Application 2019 & 2032
- Table 38: Rest of North America Sodium Reduction Ingredients Industry Revenue (Million) Forecast, by Application 2019 & 2032
- Table 39: Global Sodium Reduction Ingredients Industry Revenue Million Forecast, by Product Type 2019 & 2032
- Table 40: Global Sodium Reduction Ingredients Industry Revenue Million Forecast, by Application 2019 & 2032
- Table 41: Global Sodium Reduction Ingredients Industry Revenue Million Forecast, by Country 2019 & 2032
- Table 42: United Kingdom Sodium Reduction Ingredients Industry Revenue (Million) Forecast, by Application 2019 & 2032
- Table 43: Germany Sodium Reduction Ingredients Industry Revenue (Million) Forecast, by Application 2019 & 2032
- Table 44: France Sodium Reduction Ingredients Industry Revenue (Million) Forecast, by Application 2019 & 2032
- Table 45: Russia Sodium Reduction Ingredients Industry Revenue (Million) Forecast, by Application 2019 & 2032
- Table 46: Italy Sodium Reduction Ingredients Industry Revenue (Million) Forecast, by Application 2019 & 2032
- Table 47: Spain Sodium Reduction Ingredients Industry Revenue (Million) Forecast, by Application 2019 & 2032
- Table 48: Rest of Europe Sodium Reduction Ingredients Industry Revenue (Million) Forecast, by Application 2019 & 2032
- Table 49: Global Sodium Reduction Ingredients Industry Revenue Million Forecast, by Product Type 2019 & 2032
- Table 50: Global Sodium Reduction Ingredients Industry Revenue Million Forecast, by Application 2019 & 2032
- Table 51: Global Sodium Reduction Ingredients Industry Revenue Million Forecast, by Country 2019 & 2032
- Table 52: India Sodium Reduction Ingredients Industry Revenue (Million) Forecast, by Application 2019 & 2032
- Table 53: China Sodium Reduction Ingredients Industry Revenue (Million) Forecast, by Application 2019 & 2032
- Table 54: Japan Sodium Reduction Ingredients Industry Revenue (Million) Forecast, by Application 2019 & 2032
- Table 55: Australia Sodium Reduction Ingredients Industry Revenue (Million) Forecast, by Application 2019 & 2032
- Table 56: Rest of Asia Pacific Sodium Reduction Ingredients Industry Revenue (Million) Forecast, by Application 2019 & 2032
- Table 57: Global Sodium Reduction Ingredients Industry Revenue Million Forecast, by Product Type 2019 & 2032
- Table 58: Global Sodium Reduction Ingredients Industry Revenue Million Forecast, by Application 2019 & 2032
- Table 59: Global Sodium Reduction Ingredients Industry Revenue Million Forecast, by Country 2019 & 2032
- Table 60: Brazil Sodium Reduction Ingredients Industry Revenue (Million) Forecast, by Application 2019 & 2032
- Table 61: Argentina Sodium Reduction Ingredients Industry Revenue (Million) Forecast, by Application 2019 & 2032
- Table 62: Rest of South America Sodium Reduction Ingredients Industry Revenue (Million) Forecast, by Application 2019 & 2032
- Table 63: Global Sodium Reduction Ingredients Industry Revenue Million Forecast, by Product Type 2019 & 2032
- Table 64: Global Sodium Reduction Ingredients Industry Revenue Million Forecast, by Application 2019 & 2032
- Table 65: Global Sodium Reduction Ingredients Industry Revenue Million Forecast, by Country 2019 & 2032
- Table 66: South Africa Sodium Reduction Ingredients Industry Revenue (Million) Forecast, by Application 2019 & 2032
- Table 67: Saudi Arabia Sodium Reduction Ingredients Industry Revenue (Million) Forecast, by Application 2019 & 2032
- Table 68: Rest of Middle East and Africa Sodium Reduction Ingredients Industry Revenue (Million) Forecast, by Application 2019 & 2032
Frequently Asked Questions
1. What is the projected Compound Annual Growth Rate (CAGR) of the Sodium Reduction Ingredients Industry?
The projected CAGR is approximately 11.71%.
2. Which companies are prominent players in the Sodium Reduction Ingredients Industry?
Key companies in the market include AngelYeast Co Ltd, Givaudan, Angel Yeast Co Ltd*List Not Exhaustive, Royal DSM N V, K+S Kali GMBH, Advanced Food Systems Inc, Kerry Group Plc, DuPont, Dr Paul Lohmann GmbH & Co KGaA, Cargill Inc.
3. What are the main segments of the Sodium Reduction Ingredients Industry?
The market segments include Product Type, Application.
4. Can you provide details about the market size?
The market size is estimated to be USD XX Million as of 2022.
5. What are some drivers contributing to market growth?
Increasing Focus on Maintaining Health and Well-Being; Launching Supplements For Specific Purposes and Targeted Population.
6. What are the notable trends driving market growth?
Growing Consumer Awareness Toward High Sodium Intake.
7. Are there any restraints impacting market growth?
Supplement Consumption and Their Side-effects; Inclination Towards Substitute Products.
8. Can you provide examples of recent developments in the market?
In 2021, Cargill Salt launched a new purified sea salt flour. The ingredient is a unique type of ultra-fine cut, powder-like sodium chloride. It is suitable for blending applications that require perfect sizing, including dry soup, cereal, flour, spice mixes, and topping snack foods.
9. What pricing options are available for accessing the report?
Pricing options include single-user, multi-user, and enterprise licenses priced at USD 4750, USD 5250, and USD 8750 respectively.
10. Is the market size provided in terms of value or volume?
The market size is provided in terms of value, measured in Million.
11. Are there any specific market keywords associated with the report?
Yes, the market keyword associated with the report is "Sodium Reduction Ingredients Industry," which aids in identifying and referencing the specific market segment covered.
12. How do I determine which pricing option suits my needs best?
The pricing options vary based on user requirements and access needs. Individual users may opt for single-user licenses, while businesses requiring broader access may choose multi-user or enterprise licenses for cost-effective access to the report.
13. Are there any additional resources or data provided in the Sodium Reduction Ingredients Industry report?
While the report offers comprehensive insights, it's advisable to review the specific contents or supplementary materials provided to ascertain if additional resources or data are available.
14. How can I stay updated on further developments or reports in the Sodium Reduction Ingredients Industry?
To stay informed about further developments, trends, and reports in the Sodium Reduction Ingredients Industry, consider subscribing to industry newsletters, following relevant companies and organizations, or regularly checking reputable industry news sources and publications.
Methodology
Step 1 - Identification of Relevant Samples Size from Population Database


Step 2 - Approaches for Defining Global Market Size (Value, Volume* & Price*)

Note*: In applicable scenarios
Step 3 - Data Sources
Primary Research
- Web Analytics
- Survey Reports
- Research Institute
- Latest Research Reports
- Opinion Leaders
Secondary Research
- Annual Reports
- White Paper
- Latest Press Release
- Industry Association
- Paid Database
- Investor Presentations

Step 4 - Data Triangulation
Involves using different sources of information in order to increase the validity of a study
These sources are likely to be stakeholders in a program - participants, other researchers, program staff, other community members, and so on.
Then we put all data in single framework & apply various statistical tools to find out the dynamic on the market.
During the analysis stage, feedback from the stakeholder groups would be compared to determine areas of agreement as well as areas of divergence


