
Key Insights
The smart polymers market is experiencing robust growth, driven by increasing demand across diverse sectors. The market's Compound Annual Growth Rate (CAGR) exceeding 15% from 2019 to 2024 indicates significant expansion. This surge is fueled by the inherent advantages of smart polymers – their responsiveness to stimuli like temperature, pH, or light – enabling applications in self-healing materials, advanced drug delivery systems, and adaptive electronics. The biomedical and healthcare sectors are leading adopters, utilizing smart polymers in implants, biosensors, and targeted drug release mechanisms. The automotive and textile industries are also significant contributors, integrating these materials for enhanced performance and functionality in vehicles and fabrics respectively. Technological advancements in polymer synthesis and modification are further accelerating market penetration. While regulatory hurdles and high initial production costs pose challenges, ongoing research and development efforts are continuously addressing these limitations. The market is segmented by type (physical, chemical, biological stimuli-responsive), application (biomedical, electronics, textiles, automotive), and material (electroactive, magnetically-responsive, pH-responsive, enzyme-responsive). Geographic expansion is also a key factor, with the Asia-Pacific region, specifically China and India, exhibiting substantial growth potential due to rising industrialization and increasing investment in research and development.
Continued innovation in smart polymer technologies is projected to maintain the market's high growth trajectory through 2033. The development of more sophisticated and biocompatible polymers will expand applications in regenerative medicine and personalized healthcare. Advancements in material processing and manufacturing techniques will lead to cost reductions, thereby broadening the market's accessibility. Furthermore, increasing environmental awareness and the need for sustainable materials will drive demand for biodegradable and recyclable smart polymers. Competition among established players and emerging startups will further stimulate innovation and drive the market toward greater efficiency and cost-effectiveness. The strategic partnerships and collaborations observed within the industry underscore the collective commitment to exploring new avenues for smart polymer applications and pushing the boundaries of material science. This collaborative approach is expected to accelerate market expansion across diverse sectors and geographical regions.
Smart Polymers Industry Market Report: 2019-2033
This comprehensive report provides an in-depth analysis of the Smart Polymers market, encompassing market dynamics, growth trends, regional dominance, product landscape, key challenges, emerging opportunities, and key players. The study period covers 2019-2033, with a base year of 2025 and a forecast period of 2025-2033. The report leverages extensive research and data analysis to offer actionable insights for industry professionals, investors, and strategic decision-makers. The total market size is projected to reach xx Million by 2033.
Smart Polymers Industry Market Dynamics & Structure
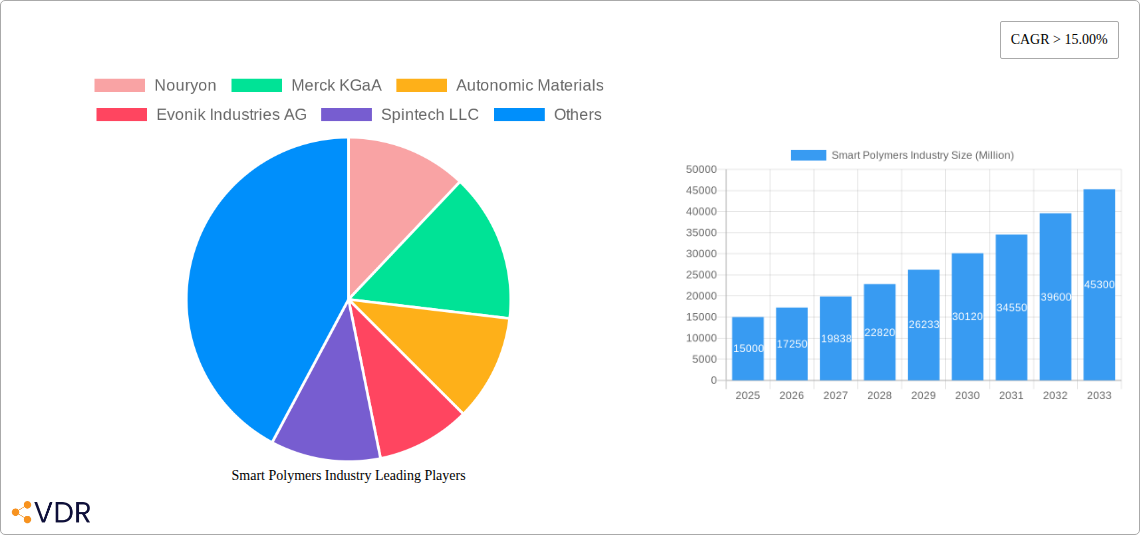
This section analyzes the Smart Polymers market's competitive landscape, technological advancements, regulatory influences, and market trends. The market is moderately concentrated, with key players such as Nouryon, Merck KGaA, and Evonik Industries AG holding significant market share. However, the emergence of innovative startups and strategic partnerships is fostering competition. Technological innovations, particularly in bio-responsive and self-healing polymers, are key drivers, while regulatory frameworks regarding material safety and environmental impact are shaping market dynamics. The substitution of traditional polymers with smart polymers in various applications is also a significant factor.
- Market Concentration: Moderately concentrated, with top 5 players holding approximately xx% market share in 2024.
- Technological Innovation: Significant advancements in bio-inspired polymers, stimuli-responsive materials, and additive manufacturing are driving growth.
- Regulatory Framework: Stringent regulations on material safety and environmental impact are influencing product development and market access.
- Competitive Substitutes: Traditional polymers pose a competitive threat, although smart polymers offer superior performance in specific applications.
- M&A Activity: A moderate level of mergers and acquisitions, with recent examples including Evonik's acquisition of JeNaCell in 2021. The total deal volume in 2024 is estimated at xx Million.
- End-user Demographics: The increasing demand for advanced materials across diverse sectors like healthcare, electronics, and automotive is driving market growth.
Smart Polymers Industry Growth Trends & Insights
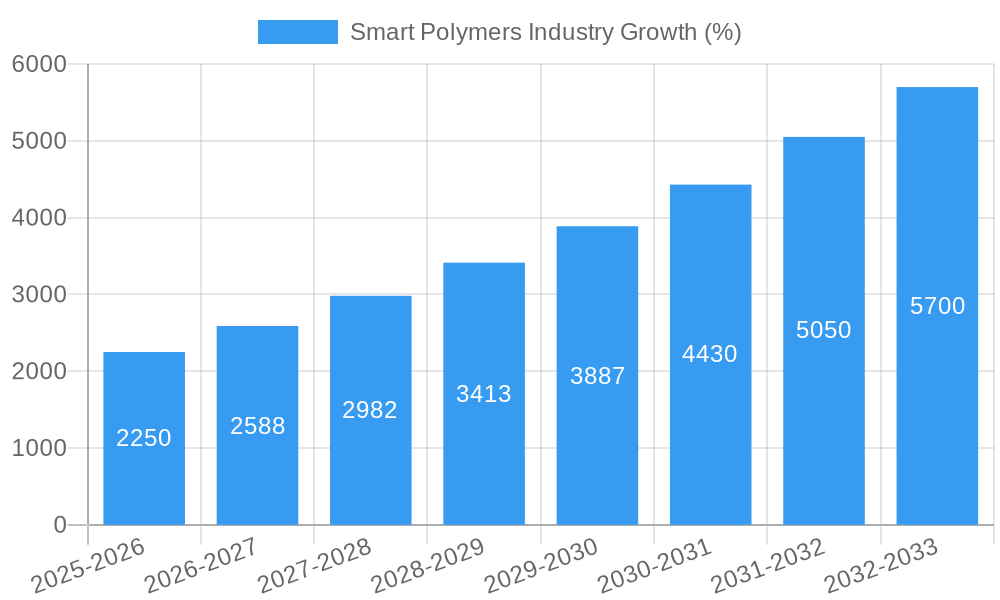
The Smart Polymers market exhibits robust growth, driven by increasing demand across diverse end-use industries. The market size expanded from xx Million in 2019 to xx Million in 2024, exhibiting a CAGR of xx%. This growth is attributed to technological advancements, rising consumer preference for sustainable and high-performance materials, and supportive government policies. Adoption rates are particularly high in the biomedical and electronics sectors, due to the unique properties of smart polymers. Consumer behavior shifts towards environmentally friendly products further fuel market growth. Technological disruptions, such as the development of new polymer types and improved manufacturing processes, are expected to accelerate market expansion in the forecast period. Market penetration is expected to reach xx% by 2033.
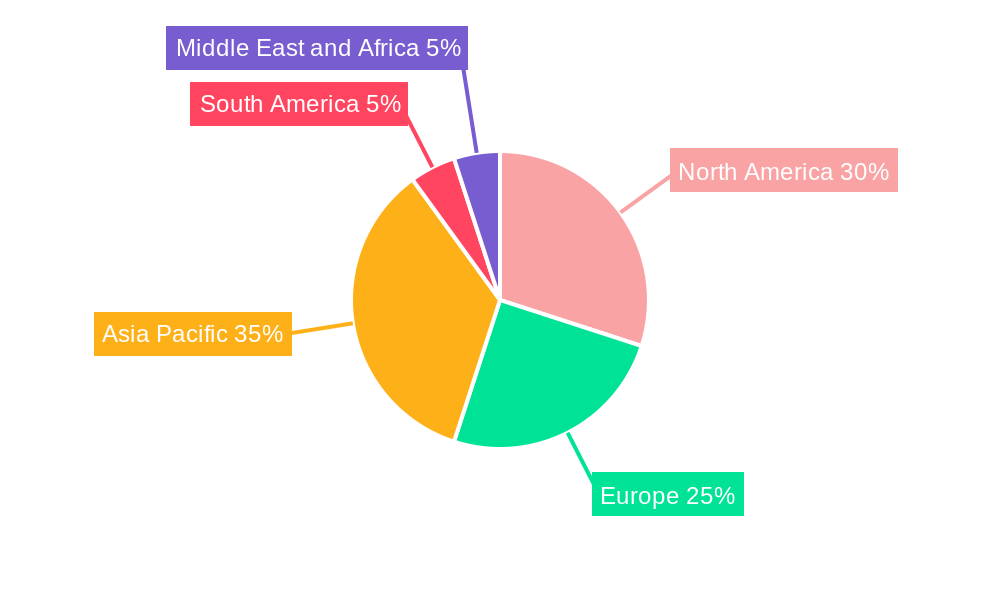
Dominant Regions, Countries, or Segments in Smart Polymers Industry
North America currently holds the largest market share in the Smart Polymers industry, followed by Europe and Asia-Pacific. Within segments, the Biomedical and Healthcare sector shows the highest growth potential, driven by increasing demand for advanced medical devices and drug delivery systems. The Electroactive and Magnetically-Responsive Polymers segment is also experiencing significant growth due to its use in various applications, including sensors and actuators.
Leading Regions: North America, Europe, and Asia-Pacific are the dominant regions.
Key Segments: Biomedical and Healthcare, Electrical and Electronics, and Electroactive and Magnetically-Responsive Polymers are leading segments.
Growth Drivers: Technological advancements, rising healthcare expenditure, and increasing adoption in electronics.
Biomedical and Healthcare: This segment is projected to grow at a CAGR of xx% during the forecast period. Key drivers include the development of new drug delivery systems and implantable devices.
Electrical and Electronics: This segment is witnessing substantial growth due to increasing demand for flexible electronics and wearable sensors. Expected CAGR: xx%.
Automotive: Growing adoption of smart polymers in automotive applications like lightweight components and sensors drives this segment's growth. Projected CAGR: xx%.
Smart Polymers Industry Product Landscape
Smart polymers exhibit a wide range of properties, including stimuli-responsiveness, self-healing capabilities, and biocompatibility. Product innovations focus on enhancing performance metrics such as strength, durability, and biodegradability. Unique selling propositions include improved functionality, reduced material consumption, and enhanced sustainability. Technological advancements, such as nanotechnology and advanced polymerization techniques, are enabling the development of novel materials with superior properties.
Key Drivers, Barriers & Challenges in Smart Polymers Industry
Key Drivers:
- Technological advancements driving innovation in material properties and applications.
- Growing demand across various industries (biomedical, electronics, automotive).
- Increasing focus on sustainability and eco-friendly materials.
Key Challenges:
- High manufacturing costs and limited scalability.
- Stringent regulatory requirements for certain applications (e.g., medical devices).
- Competition from traditional polymers with established market presence.
Emerging Opportunities in Smart Polymers Industry
- Expanding applications in emerging fields such as flexible electronics, wearable sensors, and 3D printing.
- Development of bio-based and biodegradable smart polymers to address environmental concerns.
- Customization and personalization of smart polymer products to meet specific end-user needs.
Growth Accelerators in the Smart Polymers Industry Industry
Technological breakthroughs, particularly in bio-inspired polymers and additive manufacturing, are accelerating market growth. Strategic partnerships between polymer manufacturers and end-users are fostering innovation and market expansion. Government initiatives promoting the adoption of sustainable materials are also contributing to market growth.
Key Players Shaping the Smart Polymers Industry Market
- Nouryon
- Merck KGaA
- Autonomic Materials
- Evonik Industries AG
- Spintech LLC
- Huntsman International LLC
- DuPont
- The Lubrizol Corporation
- Covestro AG
- SMP Technologies Inc
- TNO
Notable Milestones in Smart Polymers Industry Sector
- August 2021: Evonik acquired JeNaCell, expanding its biomaterials portfolio.
- March 2021: Nouryon launched LumaTreat, a smart-tagged polymer line for water management.
In-Depth Smart Polymers Industry Market Outlook
The Smart Polymers market is poised for significant growth in the coming years, driven by ongoing technological advancements, increasing demand from diverse industries, and a growing focus on sustainability. Strategic partnerships, investments in R&D, and expansion into new markets will further propel market growth. The market's future potential is substantial, presenting numerous opportunities for industry players to capitalize on the increasing adoption of smart polymers across various applications.
Smart Polymers Industry Segmentation
-
1. Type
- 1.1. Physical Stimuli-responsive
- 1.2. Chemical Stimuli-responsive
- 1.3. Biological Stimuli-responsive
- 1.4. Self-healing Polymers
- 1.5. Other Types (Thermally Responsive, Etc.)
-
2. End-user Industry
- 2.1. Biomedical and Healthcare
- 2.2. Electrical and Electronics
- 2.3. Textile
- 2.4. Automotive
- 2.5. Other End-user Industries (Agriculture, Etc.)
Smart Polymers Industry Segmentation By Geography
-
1. Asia Pacific
- 1.1. China
- 1.2. India
- 1.3. Japan
- 1.4. South Korea
- 1.5. Rest of Asia Pacific
-
2. North America
- 2.1. United States
- 2.2. Canada
- 2.3. Mexico
-
3. Europe
- 3.1. Germany
- 3.2. United Kingdom
- 3.3. Italy
- 3.4. France
- 3.5. Rest of Europe
-
4. South America
- 4.1. Brazil
- 4.2. Argentina
- 4.3. Rest of South America
-
5. Middle East and Africa
- 5.1. Saudi Arabia
- 5.2. South Africa
- 5.3. Rest of Middle East and Africa
Smart Polymers Industry REPORT HIGHLIGHTS
| Aspects | Details |
|---|---|
| Study Period | 2019-2033 |
| Base Year | 2024 |
| Estimated Year | 2025 |
| Forecast Period | 2025-2033 |
| Historical Period | 2019-2024 |
| Growth Rate | CAGR of > 15.00% from 2019-2033 |
| Segmentation |
|
Table of Contents
- 1. Introduction
- 1.1. Research Scope
- 1.2. Market Segmentation
- 1.3. Research Methodology
- 1.4. Definitions and Assumptions
- 2. Executive Summary
- 2.1. Introduction
- 3. Market Dynamics
- 3.1. Introduction
- 3.2. Market Drivers
- 3.2.1. Increasing Application of Shape Memory Polymer in Textile Industry; Increasing Need for Efficient Drug Delivery System; Development of Smart Biopolymers
- 3.3. Market Restrains
- 3.3.1. High Cost of Technology and Development of Smart Polymers; Other Restraints
- 3.4. Market Trends
- 3.4.1. Biomedical and Healthcare to Dominate the Market
- 4. Market Factor Analysis
- 4.1. Porters Five Forces
- 4.2. Supply/Value Chain
- 4.3. PESTEL analysis
- 4.4. Market Entropy
- 4.5. Patent/Trademark Analysis
- 5. Global Smart Polymers Industry Analysis, Insights and Forecast, 2019-2031
- 5.1. Market Analysis, Insights and Forecast - by Type
- 5.1.1. Physical Stimuli-responsive
- 5.1.2. Chemical Stimuli-responsive
- 5.1.3. Biological Stimuli-responsive
- 5.1.4. Self-healing Polymers
- 5.1.5. Other Types (Thermally Responsive, Etc.)
- 5.2. Market Analysis, Insights and Forecast - by End-user Industry
- 5.2.1. Biomedical and Healthcare
- 5.2.2. Electrical and Electronics
- 5.2.3. Textile
- 5.2.4. Automotive
- 5.2.5. Other End-user Industries (Agriculture, Etc.)
- 5.3. Market Analysis, Insights and Forecast - by Region
- 5.3.1. Asia Pacific
- 5.3.2. North America
- 5.3.3. Europe
- 5.3.4. South America
- 5.3.5. Middle East and Africa
- 5.1. Market Analysis, Insights and Forecast - by Type
- 6. Asia Pacific Smart Polymers Industry Analysis, Insights and Forecast, 2019-2031
- 6.1. Market Analysis, Insights and Forecast - by Type
- 6.1.1. Physical Stimuli-responsive
- 6.1.2. Chemical Stimuli-responsive
- 6.1.3. Biological Stimuli-responsive
- 6.1.4. Self-healing Polymers
- 6.1.5. Other Types (Thermally Responsive, Etc.)
- 6.2. Market Analysis, Insights and Forecast - by End-user Industry
- 6.2.1. Biomedical and Healthcare
- 6.2.2. Electrical and Electronics
- 6.2.3. Textile
- 6.2.4. Automotive
- 6.2.5. Other End-user Industries (Agriculture, Etc.)
- 6.1. Market Analysis, Insights and Forecast - by Type
- 7. North America Smart Polymers Industry Analysis, Insights and Forecast, 2019-2031
- 7.1. Market Analysis, Insights and Forecast - by Type
- 7.1.1. Physical Stimuli-responsive
- 7.1.2. Chemical Stimuli-responsive
- 7.1.3. Biological Stimuli-responsive
- 7.1.4. Self-healing Polymers
- 7.1.5. Other Types (Thermally Responsive, Etc.)
- 7.2. Market Analysis, Insights and Forecast - by End-user Industry
- 7.2.1. Biomedical and Healthcare
- 7.2.2. Electrical and Electronics
- 7.2.3. Textile
- 7.2.4. Automotive
- 7.2.5. Other End-user Industries (Agriculture, Etc.)
- 7.1. Market Analysis, Insights and Forecast - by Type
- 8. Europe Smart Polymers Industry Analysis, Insights and Forecast, 2019-2031
- 8.1. Market Analysis, Insights and Forecast - by Type
- 8.1.1. Physical Stimuli-responsive
- 8.1.2. Chemical Stimuli-responsive
- 8.1.3. Biological Stimuli-responsive
- 8.1.4. Self-healing Polymers
- 8.1.5. Other Types (Thermally Responsive, Etc.)
- 8.2. Market Analysis, Insights and Forecast - by End-user Industry
- 8.2.1. Biomedical and Healthcare
- 8.2.2. Electrical and Electronics
- 8.2.3. Textile
- 8.2.4. Automotive
- 8.2.5. Other End-user Industries (Agriculture, Etc.)
- 8.1. Market Analysis, Insights and Forecast - by Type
- 9. South America Smart Polymers Industry Analysis, Insights and Forecast, 2019-2031
- 9.1. Market Analysis, Insights and Forecast - by Type
- 9.1.1. Physical Stimuli-responsive
- 9.1.2. Chemical Stimuli-responsive
- 9.1.3. Biological Stimuli-responsive
- 9.1.4. Self-healing Polymers
- 9.1.5. Other Types (Thermally Responsive, Etc.)
- 9.2. Market Analysis, Insights and Forecast - by End-user Industry
- 9.2.1. Biomedical and Healthcare
- 9.2.2. Electrical and Electronics
- 9.2.3. Textile
- 9.2.4. Automotive
- 9.2.5. Other End-user Industries (Agriculture, Etc.)
- 9.1. Market Analysis, Insights and Forecast - by Type
- 10. Middle East and Africa Smart Polymers Industry Analysis, Insights and Forecast, 2019-2031
- 10.1. Market Analysis, Insights and Forecast - by Type
- 10.1.1. Physical Stimuli-responsive
- 10.1.2. Chemical Stimuli-responsive
- 10.1.3. Biological Stimuli-responsive
- 10.1.4. Self-healing Polymers
- 10.1.5. Other Types (Thermally Responsive, Etc.)
- 10.2. Market Analysis, Insights and Forecast - by End-user Industry
- 10.2.1. Biomedical and Healthcare
- 10.2.2. Electrical and Electronics
- 10.2.3. Textile
- 10.2.4. Automotive
- 10.2.5. Other End-user Industries (Agriculture, Etc.)
- 10.1. Market Analysis, Insights and Forecast - by Type
- 11. Asia Pacific Smart Polymers Industry Analysis, Insights and Forecast, 2019-2031
- 11.1. Market Analysis, Insights and Forecast - By Country/Sub-region
- 11.1.1 China
- 11.1.2 India
- 11.1.3 Japan
- 11.1.4 South Korea
- 11.1.5 Rest of Asia Pacific
- 12. North America Smart Polymers Industry Analysis, Insights and Forecast, 2019-2031
- 12.1. Market Analysis, Insights and Forecast - By Country/Sub-region
- 12.1.1 United States
- 12.1.2 Canada
- 12.1.3 Mexico
- 13. Europe Smart Polymers Industry Analysis, Insights and Forecast, 2019-2031
- 13.1. Market Analysis, Insights and Forecast - By Country/Sub-region
- 13.1.1 Germany
- 13.1.2 United Kingdom
- 13.1.3 Italy
- 13.1.4 France
- 13.1.5 Rest of Europe
- 14. South America Smart Polymers Industry Analysis, Insights and Forecast, 2019-2031
- 14.1. Market Analysis, Insights and Forecast - By Country/Sub-region
- 14.1.1 Brazil
- 14.1.2 Argentina
- 14.1.3 Rest of South America
- 15. Middle East and Africa Smart Polymers Industry Analysis, Insights and Forecast, 2019-2031
- 15.1. Market Analysis, Insights and Forecast - By Country/Sub-region
- 15.1.1 Saudi Arabia
- 15.1.2 South Africa
- 15.1.3 Rest of Middle East and Africa
- 16. Competitive Analysis
- 16.1. Global Market Share Analysis 2024
- 16.2. Company Profiles
- 16.2.1 Nouryon
- 16.2.1.1. Overview
- 16.2.1.2. Products
- 16.2.1.3. SWOT Analysis
- 16.2.1.4. Recent Developments
- 16.2.1.5. Financials (Based on Availability)
- 16.2.2 Merck KGaA
- 16.2.2.1. Overview
- 16.2.2.2. Products
- 16.2.2.3. SWOT Analysis
- 16.2.2.4. Recent Developments
- 16.2.2.5. Financials (Based on Availability)
- 16.2.3 Autonomic Materials
- 16.2.3.1. Overview
- 16.2.3.2. Products
- 16.2.3.3. SWOT Analysis
- 16.2.3.4. Recent Developments
- 16.2.3.5. Financials (Based on Availability)
- 16.2.4 Evonik Industries AG
- 16.2.4.1. Overview
- 16.2.4.2. Products
- 16.2.4.3. SWOT Analysis
- 16.2.4.4. Recent Developments
- 16.2.4.5. Financials (Based on Availability)
- 16.2.5 Spintech LLC
- 16.2.5.1. Overview
- 16.2.5.2. Products
- 16.2.5.3. SWOT Analysis
- 16.2.5.4. Recent Developments
- 16.2.5.5. Financials (Based on Availability)
- 16.2.6 Huntsman International LLC
- 16.2.6.1. Overview
- 16.2.6.2. Products
- 16.2.6.3. SWOT Analysis
- 16.2.6.4. Recent Developments
- 16.2.6.5. Financials (Based on Availability)
- 16.2.7 DuPont
- 16.2.7.1. Overview
- 16.2.7.2. Products
- 16.2.7.3. SWOT Analysis
- 16.2.7.4. Recent Developments
- 16.2.7.5. Financials (Based on Availability)
- 16.2.8 The Lubrizol Corporation
- 16.2.8.1. Overview
- 16.2.8.2. Products
- 16.2.8.3. SWOT Analysis
- 16.2.8.4. Recent Developments
- 16.2.8.5. Financials (Based on Availability)
- 16.2.9 Covestro AG
- 16.2.9.1. Overview
- 16.2.9.2. Products
- 16.2.9.3. SWOT Analysis
- 16.2.9.4. Recent Developments
- 16.2.9.5. Financials (Based on Availability)
- 16.2.10 SMP Technologies Inc
- 16.2.10.1. Overview
- 16.2.10.2. Products
- 16.2.10.3. SWOT Analysis
- 16.2.10.4. Recent Developments
- 16.2.10.5. Financials (Based on Availability)
- 16.2.11 TNO
- 16.2.11.1. Overview
- 16.2.11.2. Products
- 16.2.11.3. SWOT Analysis
- 16.2.11.4. Recent Developments
- 16.2.11.5. Financials (Based on Availability)
- 16.2.1 Nouryon
List of Figures
- Figure 1: Global Smart Polymers Industry Revenue Breakdown (Million, %) by Region 2024 & 2032
- Figure 2: Global Smart Polymers Industry Volume Breakdown (K Tons, %) by Region 2024 & 2032
- Figure 3: Asia Pacific Smart Polymers Industry Revenue (Million), by Country 2024 & 2032
- Figure 4: Asia Pacific Smart Polymers Industry Volume (K Tons), by Country 2024 & 2032
- Figure 5: Asia Pacific Smart Polymers Industry Revenue Share (%), by Country 2024 & 2032
- Figure 6: Asia Pacific Smart Polymers Industry Volume Share (%), by Country 2024 & 2032
- Figure 7: North America Smart Polymers Industry Revenue (Million), by Country 2024 & 2032
- Figure 8: North America Smart Polymers Industry Volume (K Tons), by Country 2024 & 2032
- Figure 9: North America Smart Polymers Industry Revenue Share (%), by Country 2024 & 2032
- Figure 10: North America Smart Polymers Industry Volume Share (%), by Country 2024 & 2032
- Figure 11: Europe Smart Polymers Industry Revenue (Million), by Country 2024 & 2032
- Figure 12: Europe Smart Polymers Industry Volume (K Tons), by Country 2024 & 2032
- Figure 13: Europe Smart Polymers Industry Revenue Share (%), by Country 2024 & 2032
- Figure 14: Europe Smart Polymers Industry Volume Share (%), by Country 2024 & 2032
- Figure 15: South America Smart Polymers Industry Revenue (Million), by Country 2024 & 2032
- Figure 16: South America Smart Polymers Industry Volume (K Tons), by Country 2024 & 2032
- Figure 17: South America Smart Polymers Industry Revenue Share (%), by Country 2024 & 2032
- Figure 18: South America Smart Polymers Industry Volume Share (%), by Country 2024 & 2032
- Figure 19: Middle East and Africa Smart Polymers Industry Revenue (Million), by Country 2024 & 2032
- Figure 20: Middle East and Africa Smart Polymers Industry Volume (K Tons), by Country 2024 & 2032
- Figure 21: Middle East and Africa Smart Polymers Industry Revenue Share (%), by Country 2024 & 2032
- Figure 22: Middle East and Africa Smart Polymers Industry Volume Share (%), by Country 2024 & 2032
- Figure 23: Asia Pacific Smart Polymers Industry Revenue (Million), by Type 2024 & 2032
- Figure 24: Asia Pacific Smart Polymers Industry Volume (K Tons), by Type 2024 & 2032
- Figure 25: Asia Pacific Smart Polymers Industry Revenue Share (%), by Type 2024 & 2032
- Figure 26: Asia Pacific Smart Polymers Industry Volume Share (%), by Type 2024 & 2032
- Figure 27: Asia Pacific Smart Polymers Industry Revenue (Million), by End-user Industry 2024 & 2032
- Figure 28: Asia Pacific Smart Polymers Industry Volume (K Tons), by End-user Industry 2024 & 2032
- Figure 29: Asia Pacific Smart Polymers Industry Revenue Share (%), by End-user Industry 2024 & 2032
- Figure 30: Asia Pacific Smart Polymers Industry Volume Share (%), by End-user Industry 2024 & 2032
- Figure 31: Asia Pacific Smart Polymers Industry Revenue (Million), by Country 2024 & 2032
- Figure 32: Asia Pacific Smart Polymers Industry Volume (K Tons), by Country 2024 & 2032
- Figure 33: Asia Pacific Smart Polymers Industry Revenue Share (%), by Country 2024 & 2032
- Figure 34: Asia Pacific Smart Polymers Industry Volume Share (%), by Country 2024 & 2032
- Figure 35: North America Smart Polymers Industry Revenue (Million), by Type 2024 & 2032
- Figure 36: North America Smart Polymers Industry Volume (K Tons), by Type 2024 & 2032
- Figure 37: North America Smart Polymers Industry Revenue Share (%), by Type 2024 & 2032
- Figure 38: North America Smart Polymers Industry Volume Share (%), by Type 2024 & 2032
- Figure 39: North America Smart Polymers Industry Revenue (Million), by End-user Industry 2024 & 2032
- Figure 40: North America Smart Polymers Industry Volume (K Tons), by End-user Industry 2024 & 2032
- Figure 41: North America Smart Polymers Industry Revenue Share (%), by End-user Industry 2024 & 2032
- Figure 42: North America Smart Polymers Industry Volume Share (%), by End-user Industry 2024 & 2032
- Figure 43: North America Smart Polymers Industry Revenue (Million), by Country 2024 & 2032
- Figure 44: North America Smart Polymers Industry Volume (K Tons), by Country 2024 & 2032
- Figure 45: North America Smart Polymers Industry Revenue Share (%), by Country 2024 & 2032
- Figure 46: North America Smart Polymers Industry Volume Share (%), by Country 2024 & 2032
- Figure 47: Europe Smart Polymers Industry Revenue (Million), by Type 2024 & 2032
- Figure 48: Europe Smart Polymers Industry Volume (K Tons), by Type 2024 & 2032
- Figure 49: Europe Smart Polymers Industry Revenue Share (%), by Type 2024 & 2032
- Figure 50: Europe Smart Polymers Industry Volume Share (%), by Type 2024 & 2032
- Figure 51: Europe Smart Polymers Industry Revenue (Million), by End-user Industry 2024 & 2032
- Figure 52: Europe Smart Polymers Industry Volume (K Tons), by End-user Industry 2024 & 2032
- Figure 53: Europe Smart Polymers Industry Revenue Share (%), by End-user Industry 2024 & 2032
- Figure 54: Europe Smart Polymers Industry Volume Share (%), by End-user Industry 2024 & 2032
- Figure 55: Europe Smart Polymers Industry Revenue (Million), by Country 2024 & 2032
- Figure 56: Europe Smart Polymers Industry Volume (K Tons), by Country 2024 & 2032
- Figure 57: Europe Smart Polymers Industry Revenue Share (%), by Country 2024 & 2032
- Figure 58: Europe Smart Polymers Industry Volume Share (%), by Country 2024 & 2032
- Figure 59: South America Smart Polymers Industry Revenue (Million), by Type 2024 & 2032
- Figure 60: South America Smart Polymers Industry Volume (K Tons), by Type 2024 & 2032
- Figure 61: South America Smart Polymers Industry Revenue Share (%), by Type 2024 & 2032
- Figure 62: South America Smart Polymers Industry Volume Share (%), by Type 2024 & 2032
- Figure 63: South America Smart Polymers Industry Revenue (Million), by End-user Industry 2024 & 2032
- Figure 64: South America Smart Polymers Industry Volume (K Tons), by End-user Industry 2024 & 2032
- Figure 65: South America Smart Polymers Industry Revenue Share (%), by End-user Industry 2024 & 2032
- Figure 66: South America Smart Polymers Industry Volume Share (%), by End-user Industry 2024 & 2032
- Figure 67: South America Smart Polymers Industry Revenue (Million), by Country 2024 & 2032
- Figure 68: South America Smart Polymers Industry Volume (K Tons), by Country 2024 & 2032
- Figure 69: South America Smart Polymers Industry Revenue Share (%), by Country 2024 & 2032
- Figure 70: South America Smart Polymers Industry Volume Share (%), by Country 2024 & 2032
- Figure 71: Middle East and Africa Smart Polymers Industry Revenue (Million), by Type 2024 & 2032
- Figure 72: Middle East and Africa Smart Polymers Industry Volume (K Tons), by Type 2024 & 2032
- Figure 73: Middle East and Africa Smart Polymers Industry Revenue Share (%), by Type 2024 & 2032
- Figure 74: Middle East and Africa Smart Polymers Industry Volume Share (%), by Type 2024 & 2032
- Figure 75: Middle East and Africa Smart Polymers Industry Revenue (Million), by End-user Industry 2024 & 2032
- Figure 76: Middle East and Africa Smart Polymers Industry Volume (K Tons), by End-user Industry 2024 & 2032
- Figure 77: Middle East and Africa Smart Polymers Industry Revenue Share (%), by End-user Industry 2024 & 2032
- Figure 78: Middle East and Africa Smart Polymers Industry Volume Share (%), by End-user Industry 2024 & 2032
- Figure 79: Middle East and Africa Smart Polymers Industry Revenue (Million), by Country 2024 & 2032
- Figure 80: Middle East and Africa Smart Polymers Industry Volume (K Tons), by Country 2024 & 2032
- Figure 81: Middle East and Africa Smart Polymers Industry Revenue Share (%), by Country 2024 & 2032
- Figure 82: Middle East and Africa Smart Polymers Industry Volume Share (%), by Country 2024 & 2032
List of Tables
- Table 1: Global Smart Polymers Industry Revenue Million Forecast, by Region 2019 & 2032
- Table 2: Global Smart Polymers Industry Volume K Tons Forecast, by Region 2019 & 2032
- Table 3: Global Smart Polymers Industry Revenue Million Forecast, by Type 2019 & 2032
- Table 4: Global Smart Polymers Industry Volume K Tons Forecast, by Type 2019 & 2032
- Table 5: Global Smart Polymers Industry Revenue Million Forecast, by End-user Industry 2019 & 2032
- Table 6: Global Smart Polymers Industry Volume K Tons Forecast, by End-user Industry 2019 & 2032
- Table 7: Global Smart Polymers Industry Revenue Million Forecast, by Region 2019 & 2032
- Table 8: Global Smart Polymers Industry Volume K Tons Forecast, by Region 2019 & 2032
- Table 9: Global Smart Polymers Industry Revenue Million Forecast, by Country 2019 & 2032
- Table 10: Global Smart Polymers Industry Volume K Tons Forecast, by Country 2019 & 2032
- Table 11: China Smart Polymers Industry Revenue (Million) Forecast, by Application 2019 & 2032
- Table 12: China Smart Polymers Industry Volume (K Tons) Forecast, by Application 2019 & 2032
- Table 13: India Smart Polymers Industry Revenue (Million) Forecast, by Application 2019 & 2032
- Table 14: India Smart Polymers Industry Volume (K Tons) Forecast, by Application 2019 & 2032
- Table 15: Japan Smart Polymers Industry Revenue (Million) Forecast, by Application 2019 & 2032
- Table 16: Japan Smart Polymers Industry Volume (K Tons) Forecast, by Application 2019 & 2032
- Table 17: South Korea Smart Polymers Industry Revenue (Million) Forecast, by Application 2019 & 2032
- Table 18: South Korea Smart Polymers Industry Volume (K Tons) Forecast, by Application 2019 & 2032
- Table 19: Rest of Asia Pacific Smart Polymers Industry Revenue (Million) Forecast, by Application 2019 & 2032
- Table 20: Rest of Asia Pacific Smart Polymers Industry Volume (K Tons) Forecast, by Application 2019 & 2032
- Table 21: Global Smart Polymers Industry Revenue Million Forecast, by Country 2019 & 2032
- Table 22: Global Smart Polymers Industry Volume K Tons Forecast, by Country 2019 & 2032
- Table 23: United States Smart Polymers Industry Revenue (Million) Forecast, by Application 2019 & 2032
- Table 24: United States Smart Polymers Industry Volume (K Tons) Forecast, by Application 2019 & 2032
- Table 25: Canada Smart Polymers Industry Revenue (Million) Forecast, by Application 2019 & 2032
- Table 26: Canada Smart Polymers Industry Volume (K Tons) Forecast, by Application 2019 & 2032
- Table 27: Mexico Smart Polymers Industry Revenue (Million) Forecast, by Application 2019 & 2032
- Table 28: Mexico Smart Polymers Industry Volume (K Tons) Forecast, by Application 2019 & 2032
- Table 29: Global Smart Polymers Industry Revenue Million Forecast, by Country 2019 & 2032
- Table 30: Global Smart Polymers Industry Volume K Tons Forecast, by Country 2019 & 2032
- Table 31: Germany Smart Polymers Industry Revenue (Million) Forecast, by Application 2019 & 2032
- Table 32: Germany Smart Polymers Industry Volume (K Tons) Forecast, by Application 2019 & 2032
- Table 33: United Kingdom Smart Polymers Industry Revenue (Million) Forecast, by Application 2019 & 2032
- Table 34: United Kingdom Smart Polymers Industry Volume (K Tons) Forecast, by Application 2019 & 2032
- Table 35: Italy Smart Polymers Industry Revenue (Million) Forecast, by Application 2019 & 2032
- Table 36: Italy Smart Polymers Industry Volume (K Tons) Forecast, by Application 2019 & 2032
- Table 37: France Smart Polymers Industry Revenue (Million) Forecast, by Application 2019 & 2032
- Table 38: France Smart Polymers Industry Volume (K Tons) Forecast, by Application 2019 & 2032
- Table 39: Rest of Europe Smart Polymers Industry Revenue (Million) Forecast, by Application 2019 & 2032
- Table 40: Rest of Europe Smart Polymers Industry Volume (K Tons) Forecast, by Application 2019 & 2032
- Table 41: Global Smart Polymers Industry Revenue Million Forecast, by Country 2019 & 2032
- Table 42: Global Smart Polymers Industry Volume K Tons Forecast, by Country 2019 & 2032
- Table 43: Brazil Smart Polymers Industry Revenue (Million) Forecast, by Application 2019 & 2032
- Table 44: Brazil Smart Polymers Industry Volume (K Tons) Forecast, by Application 2019 & 2032
- Table 45: Argentina Smart Polymers Industry Revenue (Million) Forecast, by Application 2019 & 2032
- Table 46: Argentina Smart Polymers Industry Volume (K Tons) Forecast, by Application 2019 & 2032
- Table 47: Rest of South America Smart Polymers Industry Revenue (Million) Forecast, by Application 2019 & 2032
- Table 48: Rest of South America Smart Polymers Industry Volume (K Tons) Forecast, by Application 2019 & 2032
- Table 49: Global Smart Polymers Industry Revenue Million Forecast, by Country 2019 & 2032
- Table 50: Global Smart Polymers Industry Volume K Tons Forecast, by Country 2019 & 2032
- Table 51: Saudi Arabia Smart Polymers Industry Revenue (Million) Forecast, by Application 2019 & 2032
- Table 52: Saudi Arabia Smart Polymers Industry Volume (K Tons) Forecast, by Application 2019 & 2032
- Table 53: South Africa Smart Polymers Industry Revenue (Million) Forecast, by Application 2019 & 2032
- Table 54: South Africa Smart Polymers Industry Volume (K Tons) Forecast, by Application 2019 & 2032
- Table 55: Rest of Middle East and Africa Smart Polymers Industry Revenue (Million) Forecast, by Application 2019 & 2032
- Table 56: Rest of Middle East and Africa Smart Polymers Industry Volume (K Tons) Forecast, by Application 2019 & 2032
- Table 57: Global Smart Polymers Industry Revenue Million Forecast, by Type 2019 & 2032
- Table 58: Global Smart Polymers Industry Volume K Tons Forecast, by Type 2019 & 2032
- Table 59: Global Smart Polymers Industry Revenue Million Forecast, by End-user Industry 2019 & 2032
- Table 60: Global Smart Polymers Industry Volume K Tons Forecast, by End-user Industry 2019 & 2032
- Table 61: Global Smart Polymers Industry Revenue Million Forecast, by Country 2019 & 2032
- Table 62: Global Smart Polymers Industry Volume K Tons Forecast, by Country 2019 & 2032
- Table 63: China Smart Polymers Industry Revenue (Million) Forecast, by Application 2019 & 2032
- Table 64: China Smart Polymers Industry Volume (K Tons) Forecast, by Application 2019 & 2032
- Table 65: India Smart Polymers Industry Revenue (Million) Forecast, by Application 2019 & 2032
- Table 66: India Smart Polymers Industry Volume (K Tons) Forecast, by Application 2019 & 2032
- Table 67: Japan Smart Polymers Industry Revenue (Million) Forecast, by Application 2019 & 2032
- Table 68: Japan Smart Polymers Industry Volume (K Tons) Forecast, by Application 2019 & 2032
- Table 69: South Korea Smart Polymers Industry Revenue (Million) Forecast, by Application 2019 & 2032
- Table 70: South Korea Smart Polymers Industry Volume (K Tons) Forecast, by Application 2019 & 2032
- Table 71: Rest of Asia Pacific Smart Polymers Industry Revenue (Million) Forecast, by Application 2019 & 2032
- Table 72: Rest of Asia Pacific Smart Polymers Industry Volume (K Tons) Forecast, by Application 2019 & 2032
- Table 73: Global Smart Polymers Industry Revenue Million Forecast, by Type 2019 & 2032
- Table 74: Global Smart Polymers Industry Volume K Tons Forecast, by Type 2019 & 2032
- Table 75: Global Smart Polymers Industry Revenue Million Forecast, by End-user Industry 2019 & 2032
- Table 76: Global Smart Polymers Industry Volume K Tons Forecast, by End-user Industry 2019 & 2032
- Table 77: Global Smart Polymers Industry Revenue Million Forecast, by Country 2019 & 2032
- Table 78: Global Smart Polymers Industry Volume K Tons Forecast, by Country 2019 & 2032
- Table 79: United States Smart Polymers Industry Revenue (Million) Forecast, by Application 2019 & 2032
- Table 80: United States Smart Polymers Industry Volume (K Tons) Forecast, by Application 2019 & 2032
- Table 81: Canada Smart Polymers Industry Revenue (Million) Forecast, by Application 2019 & 2032
- Table 82: Canada Smart Polymers Industry Volume (K Tons) Forecast, by Application 2019 & 2032
- Table 83: Mexico Smart Polymers Industry Revenue (Million) Forecast, by Application 2019 & 2032
- Table 84: Mexico Smart Polymers Industry Volume (K Tons) Forecast, by Application 2019 & 2032
- Table 85: Global Smart Polymers Industry Revenue Million Forecast, by Type 2019 & 2032
- Table 86: Global Smart Polymers Industry Volume K Tons Forecast, by Type 2019 & 2032
- Table 87: Global Smart Polymers Industry Revenue Million Forecast, by End-user Industry 2019 & 2032
- Table 88: Global Smart Polymers Industry Volume K Tons Forecast, by End-user Industry 2019 & 2032
- Table 89: Global Smart Polymers Industry Revenue Million Forecast, by Country 2019 & 2032
- Table 90: Global Smart Polymers Industry Volume K Tons Forecast, by Country 2019 & 2032
- Table 91: Germany Smart Polymers Industry Revenue (Million) Forecast, by Application 2019 & 2032
- Table 92: Germany Smart Polymers Industry Volume (K Tons) Forecast, by Application 2019 & 2032
- Table 93: United Kingdom Smart Polymers Industry Revenue (Million) Forecast, by Application 2019 & 2032
- Table 94: United Kingdom Smart Polymers Industry Volume (K Tons) Forecast, by Application 2019 & 2032
- Table 95: Italy Smart Polymers Industry Revenue (Million) Forecast, by Application 2019 & 2032
- Table 96: Italy Smart Polymers Industry Volume (K Tons) Forecast, by Application 2019 & 2032
- Table 97: France Smart Polymers Industry Revenue (Million) Forecast, by Application 2019 & 2032
- Table 98: France Smart Polymers Industry Volume (K Tons) Forecast, by Application 2019 & 2032
- Table 99: Rest of Europe Smart Polymers Industry Revenue (Million) Forecast, by Application 2019 & 2032
- Table 100: Rest of Europe Smart Polymers Industry Volume (K Tons) Forecast, by Application 2019 & 2032
- Table 101: Global Smart Polymers Industry Revenue Million Forecast, by Type 2019 & 2032
- Table 102: Global Smart Polymers Industry Volume K Tons Forecast, by Type 2019 & 2032
- Table 103: Global Smart Polymers Industry Revenue Million Forecast, by End-user Industry 2019 & 2032
- Table 104: Global Smart Polymers Industry Volume K Tons Forecast, by End-user Industry 2019 & 2032
- Table 105: Global Smart Polymers Industry Revenue Million Forecast, by Country 2019 & 2032
- Table 106: Global Smart Polymers Industry Volume K Tons Forecast, by Country 2019 & 2032
- Table 107: Brazil Smart Polymers Industry Revenue (Million) Forecast, by Application 2019 & 2032
- Table 108: Brazil Smart Polymers Industry Volume (K Tons) Forecast, by Application 2019 & 2032
- Table 109: Argentina Smart Polymers Industry Revenue (Million) Forecast, by Application 2019 & 2032
- Table 110: Argentina Smart Polymers Industry Volume (K Tons) Forecast, by Application 2019 & 2032
- Table 111: Rest of South America Smart Polymers Industry Revenue (Million) Forecast, by Application 2019 & 2032
- Table 112: Rest of South America Smart Polymers Industry Volume (K Tons) Forecast, by Application 2019 & 2032
- Table 113: Global Smart Polymers Industry Revenue Million Forecast, by Type 2019 & 2032
- Table 114: Global Smart Polymers Industry Volume K Tons Forecast, by Type 2019 & 2032
- Table 115: Global Smart Polymers Industry Revenue Million Forecast, by End-user Industry 2019 & 2032
- Table 116: Global Smart Polymers Industry Volume K Tons Forecast, by End-user Industry 2019 & 2032
- Table 117: Global Smart Polymers Industry Revenue Million Forecast, by Country 2019 & 2032
- Table 118: Global Smart Polymers Industry Volume K Tons Forecast, by Country 2019 & 2032
- Table 119: Saudi Arabia Smart Polymers Industry Revenue (Million) Forecast, by Application 2019 & 2032
- Table 120: Saudi Arabia Smart Polymers Industry Volume (K Tons) Forecast, by Application 2019 & 2032
- Table 121: South Africa Smart Polymers Industry Revenue (Million) Forecast, by Application 2019 & 2032
- Table 122: South Africa Smart Polymers Industry Volume (K Tons) Forecast, by Application 2019 & 2032
- Table 123: Rest of Middle East and Africa Smart Polymers Industry Revenue (Million) Forecast, by Application 2019 & 2032
- Table 124: Rest of Middle East and Africa Smart Polymers Industry Volume (K Tons) Forecast, by Application 2019 & 2032
Frequently Asked Questions
1. What is the projected Compound Annual Growth Rate (CAGR) of the Smart Polymers Industry?
The projected CAGR is approximately > 15.00%.
2. Which companies are prominent players in the Smart Polymers Industry?
Key companies in the market include Nouryon, Merck KGaA, Autonomic Materials, Evonik Industries AG, Spintech LLC, Huntsman International LLC, DuPont, The Lubrizol Corporation, Covestro AG, SMP Technologies Inc, TNO.
3. What are the main segments of the Smart Polymers Industry?
The market segments include Type, End-user Industry.
4. Can you provide details about the market size?
The market size is estimated to be USD XX Million as of 2022.
5. What are some drivers contributing to market growth?
Increasing Application of Shape Memory Polymer in Textile Industry; Increasing Need for Efficient Drug Delivery System; Development of Smart Biopolymers.
6. What are the notable trends driving market growth?
Biomedical and Healthcare to Dominate the Market.
7. Are there any restraints impacting market growth?
High Cost of Technology and Development of Smart Polymers; Other Restraints.
8. Can you provide examples of recent developments in the market?
In August 2021, Evonik aquired the German biotech company JeNaCell. The acquisition adds biotechnologically produced cellulose to Evonik's portfolio of biomaterials.
9. What pricing options are available for accessing the report?
Pricing options include single-user, multi-user, and enterprise licenses priced at USD 4750, USD 5250, and USD 8750 respectively.
10. Is the market size provided in terms of value or volume?
The market size is provided in terms of value, measured in Million and volume, measured in K Tons.
11. Are there any specific market keywords associated with the report?
Yes, the market keyword associated with the report is "Smart Polymers Industry," which aids in identifying and referencing the specific market segment covered.
12. How do I determine which pricing option suits my needs best?
The pricing options vary based on user requirements and access needs. Individual users may opt for single-user licenses, while businesses requiring broader access may choose multi-user or enterprise licenses for cost-effective access to the report.
13. Are there any additional resources or data provided in the Smart Polymers Industry report?
While the report offers comprehensive insights, it's advisable to review the specific contents or supplementary materials provided to ascertain if additional resources or data are available.
14. How can I stay updated on further developments or reports in the Smart Polymers Industry?
To stay informed about further developments, trends, and reports in the Smart Polymers Industry, consider subscribing to industry newsletters, following relevant companies and organizations, or regularly checking reputable industry news sources and publications.
Methodology
Step 1 - Identification of Relevant Samples Size from Population Database


Step 2 - Approaches for Defining Global Market Size (Value, Volume* & Price*)

Note*: In applicable scenarios
Step 3 - Data Sources
Primary Research
- Web Analytics
- Survey Reports
- Research Institute
- Latest Research Reports
- Opinion Leaders
Secondary Research
- Annual Reports
- White Paper
- Latest Press Release
- Industry Association
- Paid Database
- Investor Presentations

Step 4 - Data Triangulation
Involves using different sources of information in order to increase the validity of a study
These sources are likely to be stakeholders in a program - participants, other researchers, program staff, other community members, and so on.
Then we put all data in single framework & apply various statistical tools to find out the dynamic on the market.
During the analysis stage, feedback from the stakeholder groups would be compared to determine areas of agreement as well as areas of divergence


