

Key Insights
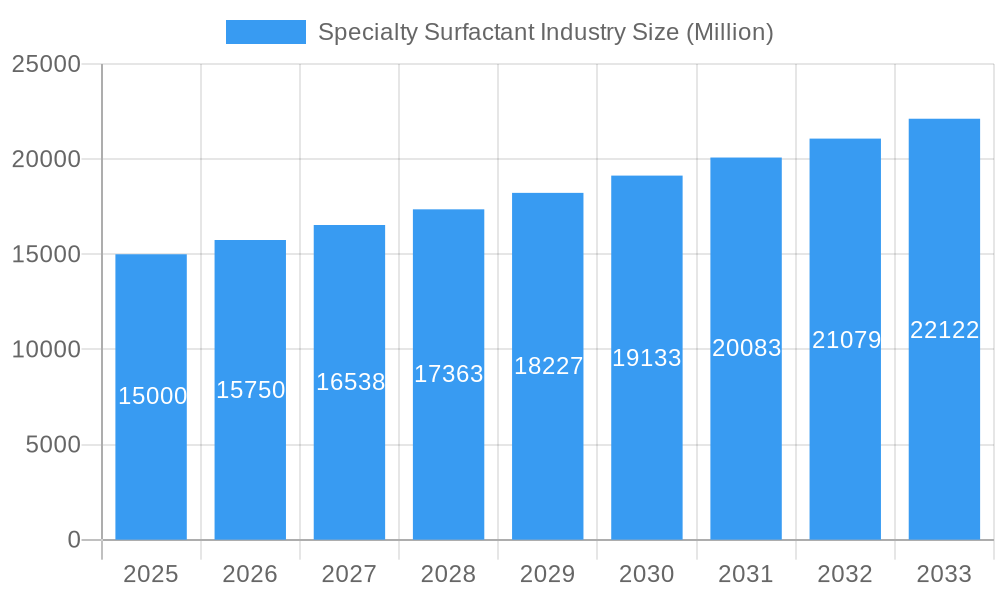
The global specialty surfactant market is projected for substantial expansion, estimated at 47.4 billion by 2025 and anticipated to grow at a compound annual growth rate (CAGR) of 5.3% from 2025 to 2033. This robust growth is fueled by escalating demand from the household soap and detergent sector, driven by increasing global populations and rising disposable incomes. The expanding personal care industry, particularly in emerging economies, further propels market growth as consumers increasingly prioritize hygiene and beauty products. Technological advancements, including the development of bio-based and sustainable surfactant options, are also stimulating expansion in response to the global drive for environmentally responsible alternatives. The adoption of specialty surfactants across diverse applications such as lubricants, food processing, and agricultural chemicals contributes significantly to overall market growth. However, market expansion faces challenges from stringent environmental regulations and volatile raw material prices. The market segmentation indicates a dominance of synthetic surfactants, with a notable increase in demand for bio-based alternatives. Anionic surfactants currently represent the largest segment by type, although demand for cationic and non-ionic surfactants is steadily rising, reflecting evolving application needs. The Asia-Pacific region, led by China and India, is expected to dominate the market due to high population density and growing consumer expenditure. Competitive dynamics are characterized by a mix of large multinational corporations and regional enterprises, fostering both innovation and price competition.
Specialty Surfactant Industry Market Size (In Billion)
The competitive arena features established global leaders such as Clariant, BASF, and Dow, alongside specialized regional players. Continuous research and development efforts focused on high-performance, sustainable, and tailored surfactants are defining the market's future trajectory. Segments like bio-based surfactants are anticipated to experience exceptionally rapid growth, driven by heightened consumer environmental awareness and stricter regulatory policies on chemical usage. Sustained innovation, effective navigation of regulatory landscapes, and continued penetration into new and emerging applications across various industries will be crucial for future market growth. Strategic collaborations and mergers and acquisitions are poised to further reshape the industry landscape in the coming years.
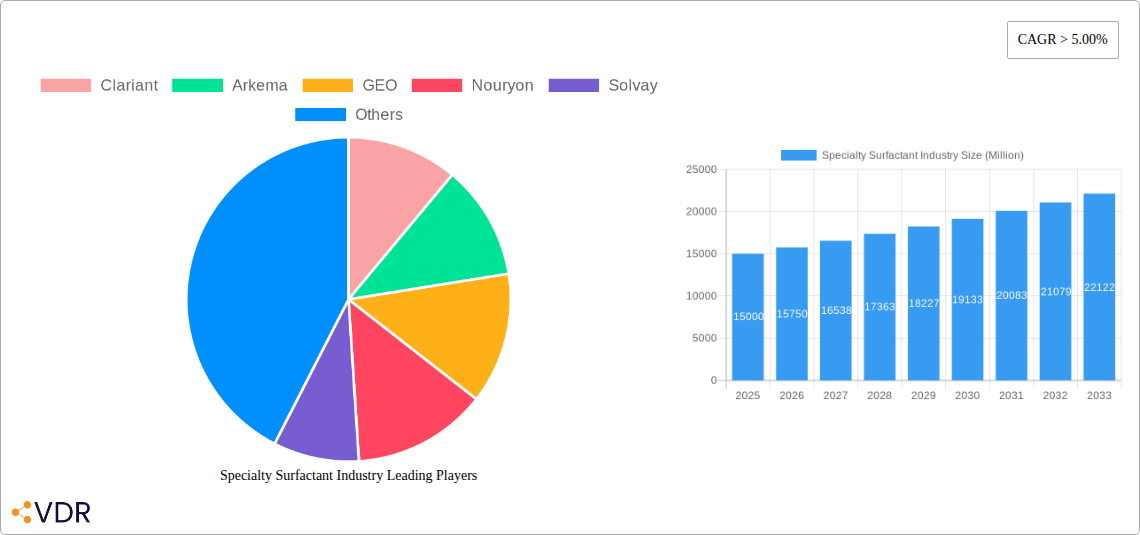
Specialty Surfactant Industry Company Market Share
Specialty Surfactant Industry Market Report: 2019-2033
This comprehensive report provides a detailed analysis of the global specialty surfactant market, encompassing market dynamics, growth trends, regional insights, product landscape, key players, and future outlook. The study period covers 2019-2033, with a base year of 2025 and a forecast period of 2025-2033. The report segments the market by application (Household Soap and Detergent, Personal Care, Lubricants and Fuel Additives, Industry and Institutional Cleaning, Food Processing, Oilfield Chemicals, Agricultural Chemicals, Textile Processing, Other Applications), origin (Synthetic Surfactants, Bio-based Surfactants), and type (Anionic Surfactants, Cationic Surfactants, Non-ionic Surfactants, Amphoteric Surfactants, Silicone Surfactants, Other Types). Key players analyzed include Clariant, Arkema, GEO, Nouryon, Solvay, and many more. This report is essential for industry professionals, investors, and researchers seeking to understand this dynamic market.
Specialty Surfactant Industry Market Dynamics & Structure
The specialty surfactant market is characterized by moderate concentration, with several large multinational companies holding significant market share. Technological innovation, particularly in bio-based surfactants and sustainable formulations, is a key driver. Regulatory frameworks, such as those focused on environmental impact and safety, significantly influence product development and market access. Competitive pressures from substitute products and emerging technologies are also prominent. The market witnesses continuous M&A activity, reflecting consolidation and expansion strategies by major players.
- Market Concentration: Moderately concentrated, with top 10 players holding approximately xx% of the market share in 2024.
- Technological Innovation: Focus on bio-based and sustainable surfactants, enhanced performance characteristics, and customized solutions.
- Regulatory Landscape: Stringent environmental regulations and safety standards drive innovation and necessitate compliance.
- Competitive Substitutes: Pressure from alternative technologies and materials in specific applications.
- M&A Activity: Significant M&A deal volume observed in the past five years, with xx deals valued at approximately $xx Million.
- End-User Demographics: Growth driven by increasing demand from key end-use sectors, like personal care and industrial cleaning.
Specialty Surfactant Industry Growth Trends & Insights
The global specialty surfactant market experienced robust growth during the historical period (2019-2024), exhibiting a CAGR of xx%. This growth is attributed to several factors, including rising demand from diverse end-use sectors, increasing consumer awareness of sustainable products, and ongoing technological advancements in surfactant production. Market penetration rates vary significantly across different applications and geographical regions. Technological disruptions, such as the development of novel surfactant types with improved performance, are transforming the industry landscape. Shifting consumer preferences towards eco-friendly and high-performance products are also driving market growth. The forecast period (2025-2033) anticipates continued expansion, albeit at a slightly moderated CAGR of xx%, driven by factors such as increasing demand for sustainable products, technological advancements, and expansion into emerging markets. The total market size is estimated to reach $xx Million by 2025 and $xx Million by 2033.
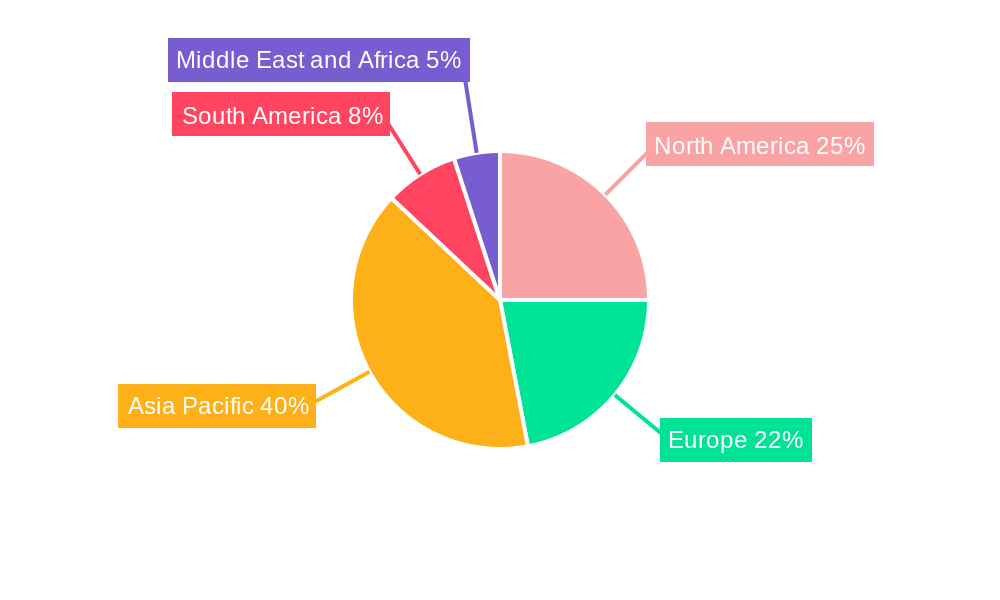
Dominant Regions, Countries, or Segments in Specialty Surfactant Industry
The Asia-Pacific region holds the largest market share in the specialty surfactant market, driven by robust economic growth, increasing industrialization, and expanding consumer base. Within applications, the Household Soap and Detergent segment holds the largest market share globally. In terms of type, the Anionic Surfactants segment dominates, followed by Non-ionic Surfactants. The bio-based surfactant segment demonstrates high growth potential due to increasing demand for sustainable products.
- Key Drivers in Asia-Pacific: Rapid economic growth, industrialization, rising disposable incomes, and expanding consumer base in countries like China and India.
- Household Soap and Detergent Dominance: Driven by high consumption rates in both developed and developing economies.
- Anionic Surfactant Market Leadership: Wide applications across various industries and cost-effectiveness.
- Bio-based Surfactants Growth Potential: Driven by increasing environmental awareness and regulatory pressures.
Specialty Surfactant Industry Product Landscape
The specialty surfactant market is characterized by a diverse product portfolio, including anionic, cationic, non-ionic, amphoteric, and silicone surfactants. Recent innovations focus on enhancing biodegradability, improving performance characteristics (e.g., foam stability, detergency), and developing customized solutions for specific applications. Many manufacturers emphasize the unique selling propositions of their products, focusing on aspects such as sustainability, high performance, and cost-effectiveness. Technological advancements include the development of novel surfactant structures, improving their efficiency and minimizing environmental impact.
Key Drivers, Barriers & Challenges in Specialty Surfactant Industry
Key Drivers:
- Growing demand from diverse end-use sectors, particularly personal care and industrial cleaning.
- Increasing focus on sustainable and bio-based surfactants.
- Technological advancements leading to improved product performance and efficiency.
Key Challenges:
- Fluctuations in raw material prices and supply chain disruptions.
- Stringent environmental regulations and safety standards.
- Intense competition from established players and emerging market entrants. This leads to price pressures and necessitates continuous innovation to maintain a competitive edge. The impact is estimated to reduce market growth by xx% in the next five years.
Emerging Opportunities in Specialty Surfactant Industry
- Untapped markets in developing economies.
- Growth in niche applications, such as agricultural chemicals and oilfield chemicals.
- Increasing demand for high-performance specialty surfactants in areas such as electronics and pharmaceuticals.
- Development of innovative formulations tailored to specific customer needs.
Growth Accelerators in the Specialty Surfactant Industry Industry
Technological breakthroughs, strategic partnerships and collaborations, and successful market expansion strategies are primary drivers of long-term growth in this sector. The development of sustainable and high-performance surfactants will continue to drive market expansion, while strategic alliances will facilitate access to new markets and technologies.
Key Players Shaping the Specialty Surfactant Industry Market
- Clariant
- Arkema
- GEO
- Nouryon
- Solvay
- Sanyo Chemical Industries Ltd
- KLK OLEO
- Reliance Industries Limited
- Evonik Industries AG
- 3M
- Stepan Company
- Croda International Plc
- Ashland
- Emery Oleochemicals
- BASF SE
- Huntsman International LLC
- ELEMENTIS PLC
- Sasol
- Akzo Nobel N V
- Dow
- KAO CORPORATION
- Godrej Industries Limited
- Sumitomo Corporation
- GALAXY
- Lonza
- Mitsui & Co Ltd
- Innospec
Notable Milestones in Specialty Surfactant Industry Sector
- December 2022: Nouryon expands its specialized surfactant alkoxylation presence in Southeast Asia.
- October 2022: BASF and Hannong Chemicals announce plans to establish a production joint venture for non-ionic specialty surfactants in the Asia-Pacific region.
In-Depth Specialty Surfactant Industry Market Outlook
The specialty surfactant market is poised for continued growth, driven by technological advancements, increasing demand from diverse end-use sectors, and a growing focus on sustainability. Strategic partnerships, market expansion into emerging economies, and the development of innovative product formulations will further propel market expansion. The market presents significant opportunities for companies that can successfully navigate the challenges posed by regulatory changes and intense competition.
Specialty Surfactant Industry Segmentation
-
1. Origin
- 1.1. Synthetic Surfactants
- 1.2. Bio-based Surfactants
-
2. Type
- 2.1. Anionic Surfactants
- 2.2. Cationic Surfactants
- 2.3. Non-ionic Surfactants
- 2.4. Amphoteric Surfactants
- 2.5. Silicone Surfactants
- 2.6. Other Types
-
3. Application
- 3.1. Household Soap and Detergent
- 3.2. Personal Care
- 3.3. Lubricants and Fuel Additives
- 3.4. Industry and Institutional Cleaning
- 3.5. Food Processing
- 3.6. Oilfield Chemicals
- 3.7. Agricultural Chemicals
- 3.8. Textile Processing
- 3.9. Other Applications
Specialty Surfactant Industry Segmentation By Geography
-
1. Asia Pacific
- 1.1. China
- 1.2. India
- 1.3. Japan
- 1.4. South Korea
- 1.5. ASEAN Countries
- 1.6. Rest of Asia Pacific
-
2. North America
- 2.1. United States
- 2.2. Canada
- 2.3. Mexico
-
3. Europe
- 3.1. Germany
- 3.2. United Kingdom
- 3.3. Italy
- 3.4. France
- 3.5. Rest of Europe
-
4. South America
- 4.1. Brazil
- 4.2. Argentina
- 4.3. Rest of South America
-
5. Middle East and Africa
- 5.1. Saudi Arabia
- 5.2. South Africa
- 5.3. Rest of Middle East and Africa
Specialty Surfactant Industry Regional Market Share
Geographic Coverage of Specialty Surfactant Industry
Specialty Surfactant Industry REPORT HIGHLIGHTS
| Aspects | Details |
|---|---|
| Study Period | 2020-2034 |
| Base Year | 2025 |
| Estimated Year | 2026 |
| Forecast Period | 2026-2034 |
| Historical Period | 2020-2025 |
| Growth Rate | CAGR of 5.3% from 2020-2034 |
| Segmentation |
|
Table of Contents
- 1. Introduction
- 1.1. Research Scope
- 1.2. Market Segmentation
- 1.3. Research Objective
- 1.4. Definitions and Assumptions
- 2. Executive Summary
- 2.1. Market Snapshot
- 3. Market Dynamics
- 3.1. Market Drivers
- 3.2. Market Restrains
- 3.3. Market Trends
- 3.4. Market Opportunities
- 4. Market Factor Analysis
- 4.1. Porters Five Forces
- 4.1.1. Bargaining Power of Suppliers
- 4.1.2. Bargaining Power of Buyers
- 4.1.3. Threat of New Entrants
- 4.1.4. Threat of Substitutes
- 4.1.5. Competitive Rivalry
- 4.2. PESTEL analysis
- 4.3. BCG Analysis
- 4.3.1. Stars (High Growth, High Market Share)
- 4.3.2. Cash Cows (Low Growth, High Market Share)
- 4.3.3. Question Mark (High Growth, Low Market Share)
- 4.3.4. Dogs (Low Growth, Low Market Share)
- 4.4. Ansoff Matrix Analysis
- 4.5. Supply Chain Analysis
- 4.6. Regulatory Landscape
- 4.7. Current Market Potential and Opportunity Assessment (TAM–SAM–SOM Framework)
- 4.8. VDR Analyst Note
- 4.1. Porters Five Forces
- 5. Market Analysis, Insights and Forecast 2021-2033
- 5.1. Market Analysis, Insights and Forecast - by Origin
- 5.1.1. Synthetic Surfactants
- 5.1.2. Bio-based Surfactants
- 5.2. Market Analysis, Insights and Forecast - by Type
- 5.2.1. Anionic Surfactants
- 5.2.2. Cationic Surfactants
- 5.2.3. Non-ionic Surfactants
- 5.2.4. Amphoteric Surfactants
- 5.2.5. Silicone Surfactants
- 5.2.6. Other Types
- 5.3. Market Analysis, Insights and Forecast - by Application
- 5.3.1. Household Soap and Detergent
- 5.3.2. Personal Care
- 5.3.3. Lubricants and Fuel Additives
- 5.3.4. Industry and Institutional Cleaning
- 5.3.5. Food Processing
- 5.3.6. Oilfield Chemicals
- 5.3.7. Agricultural Chemicals
- 5.3.8. Textile Processing
- 5.3.9. Other Applications
- 5.4. Market Analysis, Insights and Forecast - by Region
- 5.4.1. Asia Pacific
- 5.4.2. North America
- 5.4.3. Europe
- 5.4.4. South America
- 5.4.5. Middle East and Africa
- 5.1. Market Analysis, Insights and Forecast - by Origin
- 6. Global Specialty Surfactant Industry Analysis, Insights and Forecast, 2021-2033
- 6.1. Market Analysis, Insights and Forecast - by Origin
- 6.1.1. Synthetic Surfactants
- 6.1.2. Bio-based Surfactants
- 6.2. Market Analysis, Insights and Forecast - by Type
- 6.2.1. Anionic Surfactants
- 6.2.2. Cationic Surfactants
- 6.2.3. Non-ionic Surfactants
- 6.2.4. Amphoteric Surfactants
- 6.2.5. Silicone Surfactants
- 6.2.6. Other Types
- 6.3. Market Analysis, Insights and Forecast - by Application
- 6.3.1. Household Soap and Detergent
- 6.3.2. Personal Care
- 6.3.3. Lubricants and Fuel Additives
- 6.3.4. Industry and Institutional Cleaning
- 6.3.5. Food Processing
- 6.3.6. Oilfield Chemicals
- 6.3.7. Agricultural Chemicals
- 6.3.8. Textile Processing
- 6.3.9. Other Applications
- 6.1. Market Analysis, Insights and Forecast - by Origin
- 7. Asia Pacific Specialty Surfactant Industry Analysis, Insights and Forecast, 2021-2033
- 7.1. Market Analysis, Insights and Forecast - by Origin
- 7.1.1. Synthetic Surfactants
- 7.1.2. Bio-based Surfactants
- 7.2. Market Analysis, Insights and Forecast - by Type
- 7.2.1. Anionic Surfactants
- 7.2.2. Cationic Surfactants
- 7.2.3. Non-ionic Surfactants
- 7.2.4. Amphoteric Surfactants
- 7.2.5. Silicone Surfactants
- 7.2.6. Other Types
- 7.3. Market Analysis, Insights and Forecast - by Application
- 7.3.1. Household Soap and Detergent
- 7.3.2. Personal Care
- 7.3.3. Lubricants and Fuel Additives
- 7.3.4. Industry and Institutional Cleaning
- 7.3.5. Food Processing
- 7.3.6. Oilfield Chemicals
- 7.3.7. Agricultural Chemicals
- 7.3.8. Textile Processing
- 7.3.9. Other Applications
- 7.1. Market Analysis, Insights and Forecast - by Origin
- 8. North America Specialty Surfactant Industry Analysis, Insights and Forecast, 2021-2033
- 8.1. Market Analysis, Insights and Forecast - by Origin
- 8.1.1. Synthetic Surfactants
- 8.1.2. Bio-based Surfactants
- 8.2. Market Analysis, Insights and Forecast - by Type
- 8.2.1. Anionic Surfactants
- 8.2.2. Cationic Surfactants
- 8.2.3. Non-ionic Surfactants
- 8.2.4. Amphoteric Surfactants
- 8.2.5. Silicone Surfactants
- 8.2.6. Other Types
- 8.3. Market Analysis, Insights and Forecast - by Application
- 8.3.1. Household Soap and Detergent
- 8.3.2. Personal Care
- 8.3.3. Lubricants and Fuel Additives
- 8.3.4. Industry and Institutional Cleaning
- 8.3.5. Food Processing
- 8.3.6. Oilfield Chemicals
- 8.3.7. Agricultural Chemicals
- 8.3.8. Textile Processing
- 8.3.9. Other Applications
- 8.1. Market Analysis, Insights and Forecast - by Origin
- 9. Europe Specialty Surfactant Industry Analysis, Insights and Forecast, 2021-2033
- 9.1. Market Analysis, Insights and Forecast - by Origin
- 9.1.1. Synthetic Surfactants
- 9.1.2. Bio-based Surfactants
- 9.2. Market Analysis, Insights and Forecast - by Type
- 9.2.1. Anionic Surfactants
- 9.2.2. Cationic Surfactants
- 9.2.3. Non-ionic Surfactants
- 9.2.4. Amphoteric Surfactants
- 9.2.5. Silicone Surfactants
- 9.2.6. Other Types
- 9.3. Market Analysis, Insights and Forecast - by Application
- 9.3.1. Household Soap and Detergent
- 9.3.2. Personal Care
- 9.3.3. Lubricants and Fuel Additives
- 9.3.4. Industry and Institutional Cleaning
- 9.3.5. Food Processing
- 9.3.6. Oilfield Chemicals
- 9.3.7. Agricultural Chemicals
- 9.3.8. Textile Processing
- 9.3.9. Other Applications
- 9.1. Market Analysis, Insights and Forecast - by Origin
- 10. South America Specialty Surfactant Industry Analysis, Insights and Forecast, 2021-2033
- 10.1. Market Analysis, Insights and Forecast - by Origin
- 10.1.1. Synthetic Surfactants
- 10.1.2. Bio-based Surfactants
- 10.2. Market Analysis, Insights and Forecast - by Type
- 10.2.1. Anionic Surfactants
- 10.2.2. Cationic Surfactants
- 10.2.3. Non-ionic Surfactants
- 10.2.4. Amphoteric Surfactants
- 10.2.5. Silicone Surfactants
- 10.2.6. Other Types
- 10.3. Market Analysis, Insights and Forecast - by Application
- 10.3.1. Household Soap and Detergent
- 10.3.2. Personal Care
- 10.3.3. Lubricants and Fuel Additives
- 10.3.4. Industry and Institutional Cleaning
- 10.3.5. Food Processing
- 10.3.6. Oilfield Chemicals
- 10.3.7. Agricultural Chemicals
- 10.3.8. Textile Processing
- 10.3.9. Other Applications
- 10.1. Market Analysis, Insights and Forecast - by Origin
- 11. Middle East and Africa Specialty Surfactant Industry Analysis, Insights and Forecast, 2021-2033
- 11.1. Market Analysis, Insights and Forecast - by Origin
- 11.1.1. Synthetic Surfactants
- 11.1.2. Bio-based Surfactants
- 11.2. Market Analysis, Insights and Forecast - by Type
- 11.2.1. Anionic Surfactants
- 11.2.2. Cationic Surfactants
- 11.2.3. Non-ionic Surfactants
- 11.2.4. Amphoteric Surfactants
- 11.2.5. Silicone Surfactants
- 11.2.6. Other Types
- 11.3. Market Analysis, Insights and Forecast - by Application
- 11.3.1. Household Soap and Detergent
- 11.3.2. Personal Care
- 11.3.3. Lubricants and Fuel Additives
- 11.3.4. Industry and Institutional Cleaning
- 11.3.5. Food Processing
- 11.3.6. Oilfield Chemicals
- 11.3.7. Agricultural Chemicals
- 11.3.8. Textile Processing
- 11.3.9. Other Applications
- 11.1. Market Analysis, Insights and Forecast - by Origin
- 12. Competitive Analysis
- 12.1. Company Profiles
- 12.1.1 Clariant
- 12.1.1.1. Company Overview
- 12.1.1.2. Products
- 12.1.1.3. Company Financials
- 12.1.1.4. SWOT Analysis
- 12.1.2 Arkema
- 12.1.2.1. Company Overview
- 12.1.2.2. Products
- 12.1.2.3. Company Financials
- 12.1.2.4. SWOT Analysis
- 12.1.3 GEO
- 12.1.3.1. Company Overview
- 12.1.3.2. Products
- 12.1.3.3. Company Financials
- 12.1.3.4. SWOT Analysis
- 12.1.4 Nouryon
- 12.1.4.1. Company Overview
- 12.1.4.2. Products
- 12.1.4.3. Company Financials
- 12.1.4.4. SWOT Analysis
- 12.1.5 Solvay
- 12.1.5.1. Company Overview
- 12.1.5.2. Products
- 12.1.5.3. Company Financials
- 12.1.5.4. SWOT Analysis
- 12.1.6 Sanyo Chemical Industries Ltd
- 12.1.6.1. Company Overview
- 12.1.6.2. Products
- 12.1.6.3. Company Financials
- 12.1.6.4. SWOT Analysis
- 12.1.7 KLK OLEO
- 12.1.7.1. Company Overview
- 12.1.7.2. Products
- 12.1.7.3. Company Financials
- 12.1.7.4. SWOT Analysis
- 12.1.8 Reliance Industries Limited
- 12.1.8.1. Company Overview
- 12.1.8.2. Products
- 12.1.8.3. Company Financials
- 12.1.8.4. SWOT Analysis
- 12.1.9 Evonik Industries AG
- 12.1.9.1. Company Overview
- 12.1.9.2. Products
- 12.1.9.3. Company Financials
- 12.1.9.4. SWOT Analysis
- 12.1.10 3M
- 12.1.10.1. Company Overview
- 12.1.10.2. Products
- 12.1.10.3. Company Financials
- 12.1.10.4. SWOT Analysis
- 12.1.11 Stepan Company
- 12.1.11.1. Company Overview
- 12.1.11.2. Products
- 12.1.11.3. Company Financials
- 12.1.11.4. SWOT Analysis
- 12.1.12 Croda International Plc
- 12.1.12.1. Company Overview
- 12.1.12.2. Products
- 12.1.12.3. Company Financials
- 12.1.12.4. SWOT Analysis
- 12.1.13 Ashland
- 12.1.13.1. Company Overview
- 12.1.13.2. Products
- 12.1.13.3. Company Financials
- 12.1.13.4. SWOT Analysis
- 12.1.14 Emery Oleochemicals
- 12.1.14.1. Company Overview
- 12.1.14.2. Products
- 12.1.14.3. Company Financials
- 12.1.14.4. SWOT Analysis
- 12.1.15 BASF SE
- 12.1.15.1. Company Overview
- 12.1.15.2. Products
- 12.1.15.3. Company Financials
- 12.1.15.4. SWOT Analysis
- 12.1.16 Huntsman International LLC
- 12.1.16.1. Company Overview
- 12.1.16.2. Products
- 12.1.16.3. Company Financials
- 12.1.16.4. SWOT Analysis
- 12.1.17 ELEMENTIS PLC
- 12.1.17.1. Company Overview
- 12.1.17.2. Products
- 12.1.17.3. Company Financials
- 12.1.17.4. SWOT Analysis
- 12.1.18 Sasol
- 12.1.18.1. Company Overview
- 12.1.18.2. Products
- 12.1.18.3. Company Financials
- 12.1.18.4. SWOT Analysis
- 12.1.19 Akzo Nobel N V
- 12.1.19.1. Company Overview
- 12.1.19.2. Products
- 12.1.19.3. Company Financials
- 12.1.19.4. SWOT Analysis
- 12.1.20 Dow
- 12.1.20.1. Company Overview
- 12.1.20.2. Products
- 12.1.20.3. Company Financials
- 12.1.20.4. SWOT Analysis
- 12.1.21 KAO CORPORATION
- 12.1.21.1. Company Overview
- 12.1.21.2. Products
- 12.1.21.3. Company Financials
- 12.1.21.4. SWOT Analysis
- 12.1.22 Godrej Industries Limited
- 12.1.22.1. Company Overview
- 12.1.22.2. Products
- 12.1.22.3. Company Financials
- 12.1.22.4. SWOT Analysis
- 12.1.23 Sumitomo Corporation*List Not Exhaustive
- 12.1.23.1. Company Overview
- 12.1.23.2. Products
- 12.1.23.3. Company Financials
- 12.1.23.4. SWOT Analysis
- 12.1.24 GALAXY
- 12.1.24.1. Company Overview
- 12.1.24.2. Products
- 12.1.24.3. Company Financials
- 12.1.24.4. SWOT Analysis
- 12.1.25 Lonza
- 12.1.25.1. Company Overview
- 12.1.25.2. Products
- 12.1.25.3. Company Financials
- 12.1.25.4. SWOT Analysis
- 12.1.26 Mitsui & Co Ltd
- 12.1.26.1. Company Overview
- 12.1.26.2. Products
- 12.1.26.3. Company Financials
- 12.1.26.4. SWOT Analysis
- 12.1.27 Innospec
- 12.1.27.1. Company Overview
- 12.1.27.2. Products
- 12.1.27.3. Company Financials
- 12.1.27.4. SWOT Analysis
- 12.1.1 Clariant
- 12.2. Market Entropy
- 12.2.1 Company's Key Areas Served
- 12.2.2 Recent Developments
- 12.3. Company Market Share Analysis 2025
- 12.3.1 Top 5 Companies Market Share Analysis
- 12.3.2 Top 3 Companies Market Share Analysis
- 12.4. List of Potential Customers
- 13. Research Methodology
List of Figures
- Figure 1: Global Specialty Surfactant Industry Revenue Breakdown (billion, %) by Region 2025 & 2033
- Figure 2: Asia Pacific Specialty Surfactant Industry Revenue (billion), by Origin 2025 & 2033
- Figure 3: Asia Pacific Specialty Surfactant Industry Revenue Share (%), by Origin 2025 & 2033
- Figure 4: Asia Pacific Specialty Surfactant Industry Revenue (billion), by Type 2025 & 2033
- Figure 5: Asia Pacific Specialty Surfactant Industry Revenue Share (%), by Type 2025 & 2033
- Figure 6: Asia Pacific Specialty Surfactant Industry Revenue (billion), by Application 2025 & 2033
- Figure 7: Asia Pacific Specialty Surfactant Industry Revenue Share (%), by Application 2025 & 2033
- Figure 8: Asia Pacific Specialty Surfactant Industry Revenue (billion), by Country 2025 & 2033
- Figure 9: Asia Pacific Specialty Surfactant Industry Revenue Share (%), by Country 2025 & 2033
- Figure 10: North America Specialty Surfactant Industry Revenue (billion), by Origin 2025 & 2033
- Figure 11: North America Specialty Surfactant Industry Revenue Share (%), by Origin 2025 & 2033
- Figure 12: North America Specialty Surfactant Industry Revenue (billion), by Type 2025 & 2033
- Figure 13: North America Specialty Surfactant Industry Revenue Share (%), by Type 2025 & 2033
- Figure 14: North America Specialty Surfactant Industry Revenue (billion), by Application 2025 & 2033
- Figure 15: North America Specialty Surfactant Industry Revenue Share (%), by Application 2025 & 2033
- Figure 16: North America Specialty Surfactant Industry Revenue (billion), by Country 2025 & 2033
- Figure 17: North America Specialty Surfactant Industry Revenue Share (%), by Country 2025 & 2033
- Figure 18: Europe Specialty Surfactant Industry Revenue (billion), by Origin 2025 & 2033
- Figure 19: Europe Specialty Surfactant Industry Revenue Share (%), by Origin 2025 & 2033
- Figure 20: Europe Specialty Surfactant Industry Revenue (billion), by Type 2025 & 2033
- Figure 21: Europe Specialty Surfactant Industry Revenue Share (%), by Type 2025 & 2033
- Figure 22: Europe Specialty Surfactant Industry Revenue (billion), by Application 2025 & 2033
- Figure 23: Europe Specialty Surfactant Industry Revenue Share (%), by Application 2025 & 2033
- Figure 24: Europe Specialty Surfactant Industry Revenue (billion), by Country 2025 & 2033
- Figure 25: Europe Specialty Surfactant Industry Revenue Share (%), by Country 2025 & 2033
- Figure 26: South America Specialty Surfactant Industry Revenue (billion), by Origin 2025 & 2033
- Figure 27: South America Specialty Surfactant Industry Revenue Share (%), by Origin 2025 & 2033
- Figure 28: South America Specialty Surfactant Industry Revenue (billion), by Type 2025 & 2033
- Figure 29: South America Specialty Surfactant Industry Revenue Share (%), by Type 2025 & 2033
- Figure 30: South America Specialty Surfactant Industry Revenue (billion), by Application 2025 & 2033
- Figure 31: South America Specialty Surfactant Industry Revenue Share (%), by Application 2025 & 2033
- Figure 32: South America Specialty Surfactant Industry Revenue (billion), by Country 2025 & 2033
- Figure 33: South America Specialty Surfactant Industry Revenue Share (%), by Country 2025 & 2033
- Figure 34: Middle East and Africa Specialty Surfactant Industry Revenue (billion), by Origin 2025 & 2033
- Figure 35: Middle East and Africa Specialty Surfactant Industry Revenue Share (%), by Origin 2025 & 2033
- Figure 36: Middle East and Africa Specialty Surfactant Industry Revenue (billion), by Type 2025 & 2033
- Figure 37: Middle East and Africa Specialty Surfactant Industry Revenue Share (%), by Type 2025 & 2033
- Figure 38: Middle East and Africa Specialty Surfactant Industry Revenue (billion), by Application 2025 & 2033
- Figure 39: Middle East and Africa Specialty Surfactant Industry Revenue Share (%), by Application 2025 & 2033
- Figure 40: Middle East and Africa Specialty Surfactant Industry Revenue (billion), by Country 2025 & 2033
- Figure 41: Middle East and Africa Specialty Surfactant Industry Revenue Share (%), by Country 2025 & 2033
List of Tables
- Table 1: Global Specialty Surfactant Industry Revenue billion Forecast, by Origin 2020 & 2033
- Table 2: Global Specialty Surfactant Industry Revenue billion Forecast, by Type 2020 & 2033
- Table 3: Global Specialty Surfactant Industry Revenue billion Forecast, by Application 2020 & 2033
- Table 4: Global Specialty Surfactant Industry Revenue billion Forecast, by Region 2020 & 2033
- Table 5: Global Specialty Surfactant Industry Revenue billion Forecast, by Origin 2020 & 2033
- Table 6: Global Specialty Surfactant Industry Revenue billion Forecast, by Type 2020 & 2033
- Table 7: Global Specialty Surfactant Industry Revenue billion Forecast, by Application 2020 & 2033
- Table 8: Global Specialty Surfactant Industry Revenue billion Forecast, by Country 2020 & 2033
- Table 9: China Specialty Surfactant Industry Revenue (billion) Forecast, by Application 2020 & 2033
- Table 10: India Specialty Surfactant Industry Revenue (billion) Forecast, by Application 2020 & 2033
- Table 11: Japan Specialty Surfactant Industry Revenue (billion) Forecast, by Application 2020 & 2033
- Table 12: South Korea Specialty Surfactant Industry Revenue (billion) Forecast, by Application 2020 & 2033
- Table 13: ASEAN Countries Specialty Surfactant Industry Revenue (billion) Forecast, by Application 2020 & 2033
- Table 14: Rest of Asia Pacific Specialty Surfactant Industry Revenue (billion) Forecast, by Application 2020 & 2033
- Table 15: Global Specialty Surfactant Industry Revenue billion Forecast, by Origin 2020 & 2033
- Table 16: Global Specialty Surfactant Industry Revenue billion Forecast, by Type 2020 & 2033
- Table 17: Global Specialty Surfactant Industry Revenue billion Forecast, by Application 2020 & 2033
- Table 18: Global Specialty Surfactant Industry Revenue billion Forecast, by Country 2020 & 2033
- Table 19: United States Specialty Surfactant Industry Revenue (billion) Forecast, by Application 2020 & 2033
- Table 20: Canada Specialty Surfactant Industry Revenue (billion) Forecast, by Application 2020 & 2033
- Table 21: Mexico Specialty Surfactant Industry Revenue (billion) Forecast, by Application 2020 & 2033
- Table 22: Global Specialty Surfactant Industry Revenue billion Forecast, by Origin 2020 & 2033
- Table 23: Global Specialty Surfactant Industry Revenue billion Forecast, by Type 2020 & 2033
- Table 24: Global Specialty Surfactant Industry Revenue billion Forecast, by Application 2020 & 2033
- Table 25: Global Specialty Surfactant Industry Revenue billion Forecast, by Country 2020 & 2033
- Table 26: Germany Specialty Surfactant Industry Revenue (billion) Forecast, by Application 2020 & 2033
- Table 27: United Kingdom Specialty Surfactant Industry Revenue (billion) Forecast, by Application 2020 & 2033
- Table 28: Italy Specialty Surfactant Industry Revenue (billion) Forecast, by Application 2020 & 2033
- Table 29: France Specialty Surfactant Industry Revenue (billion) Forecast, by Application 2020 & 2033
- Table 30: Rest of Europe Specialty Surfactant Industry Revenue (billion) Forecast, by Application 2020 & 2033
- Table 31: Global Specialty Surfactant Industry Revenue billion Forecast, by Origin 2020 & 2033
- Table 32: Global Specialty Surfactant Industry Revenue billion Forecast, by Type 2020 & 2033
- Table 33: Global Specialty Surfactant Industry Revenue billion Forecast, by Application 2020 & 2033
- Table 34: Global Specialty Surfactant Industry Revenue billion Forecast, by Country 2020 & 2033
- Table 35: Brazil Specialty Surfactant Industry Revenue (billion) Forecast, by Application 2020 & 2033
- Table 36: Argentina Specialty Surfactant Industry Revenue (billion) Forecast, by Application 2020 & 2033
- Table 37: Rest of South America Specialty Surfactant Industry Revenue (billion) Forecast, by Application 2020 & 2033
- Table 38: Global Specialty Surfactant Industry Revenue billion Forecast, by Origin 2020 & 2033
- Table 39: Global Specialty Surfactant Industry Revenue billion Forecast, by Type 2020 & 2033
- Table 40: Global Specialty Surfactant Industry Revenue billion Forecast, by Application 2020 & 2033
- Table 41: Global Specialty Surfactant Industry Revenue billion Forecast, by Country 2020 & 2033
- Table 42: Saudi Arabia Specialty Surfactant Industry Revenue (billion) Forecast, by Application 2020 & 2033
- Table 43: South Africa Specialty Surfactant Industry Revenue (billion) Forecast, by Application 2020 & 2033
- Table 44: Rest of Middle East and Africa Specialty Surfactant Industry Revenue (billion) Forecast, by Application 2020 & 2033
Frequently Asked Questions
1. What is the projected Compound Annual Growth Rate (CAGR) of the Specialty Surfactant Industry?
The projected CAGR is approximately 5.3%.
2. Which companies are prominent players in the Specialty Surfactant Industry?
Key companies in the market include Clariant, Arkema, GEO, Nouryon, Solvay, Sanyo Chemical Industries Ltd, KLK OLEO, Reliance Industries Limited, Evonik Industries AG, 3M, Stepan Company, Croda International Plc, Ashland, Emery Oleochemicals, BASF SE, Huntsman International LLC, ELEMENTIS PLC, Sasol, Akzo Nobel N V, Dow, KAO CORPORATION, Godrej Industries Limited, Sumitomo Corporation*List Not Exhaustive, GALAXY, Lonza, Mitsui & Co Ltd, Innospec.
3. What are the main segments of the Specialty Surfactant Industry?
The market segments include Origin, Type, Application.
4. Can you provide details about the market size?
The market size is estimated to be USD 47.4 billion as of 2022.
5. What are some drivers contributing to market growth?
Growing Personal Care Industry In Asia-pacific; Growth Of The Oleo Chemicals Market.
6. What are the notable trends driving market growth?
Household Soap and Detergent Application to Dominate the Market.
7. Are there any restraints impacting market growth?
Increasing Focus On Environmental Regulations.
8. Can you provide examples of recent developments in the market?
December 2022: Nouryon expanded its specialized surfactant alkoxylation presence in Southeast Asia through an asset purchase on Jurong Island in Singapore. The purchased plant will help Nouryon meet expanding regional customer demand in important end-markets such as agriculture and food, home and personal care, natural resources, and paints and coatings.
9. What pricing options are available for accessing the report?
Pricing options include single-user, multi-user, and enterprise licenses priced at USD 4750, USD 5250, and USD 8750 respectively.
10. Is the market size provided in terms of value or volume?
The market size is provided in terms of value, measured in billion.
11. Are there any specific market keywords associated with the report?
Yes, the market keyword associated with the report is "Specialty Surfactant Industry," which aids in identifying and referencing the specific market segment covered.
12. How do I determine which pricing option suits my needs best?
The pricing options vary based on user requirements and access needs. Individual users may opt for single-user licenses, while businesses requiring broader access may choose multi-user or enterprise licenses for cost-effective access to the report.
13. Are there any additional resources or data provided in the Specialty Surfactant Industry report?
While the report offers comprehensive insights, it's advisable to review the specific contents or supplementary materials provided to ascertain if additional resources or data are available.
14. How can I stay updated on further developments or reports in the Specialty Surfactant Industry?
To stay informed about further developments, trends, and reports in the Specialty Surfactant Industry, consider subscribing to industry newsletters, following relevant companies and organizations, or regularly checking reputable industry news sources and publications.
Methodology
Step 1 - Identification of Relevant Samples Size from Population Database


Step 2 - Approaches for Defining Global Market Size (Value, Volume* & Price*)

Note*: In applicable scenarios
Step 3 - Data Sources
Primary Research
- Web Analytics
- Survey Reports
- Research Institute
- Latest Research Reports
- Opinion Leaders
Secondary Research
- Annual Reports
- White Paper
- Latest Press Release
- Industry Association
- Paid Database
- Investor Presentations

Step 4 - Data Triangulation
Involves using different sources of information in order to increase the validity of a study
These sources are likely to be stakeholders in a program - participants, other researchers, program staff, other community members, and so on.
Then we put all data in single framework & apply various statistical tools to find out the dynamic on the market.
During the analysis stage, feedback from the stakeholder groups would be compared to determine areas of agreement as well as areas of divergence