
Key Insights
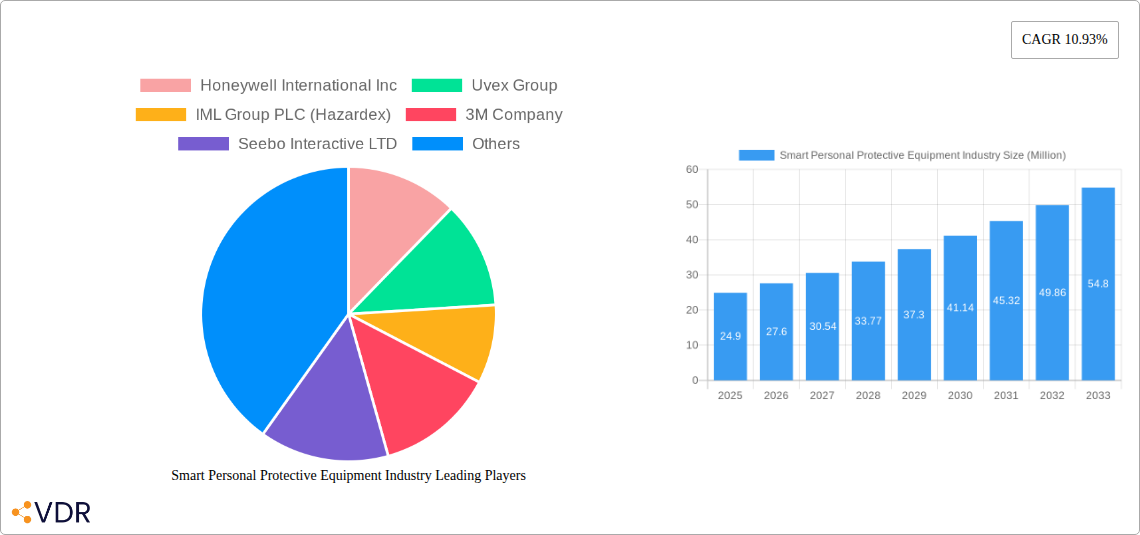
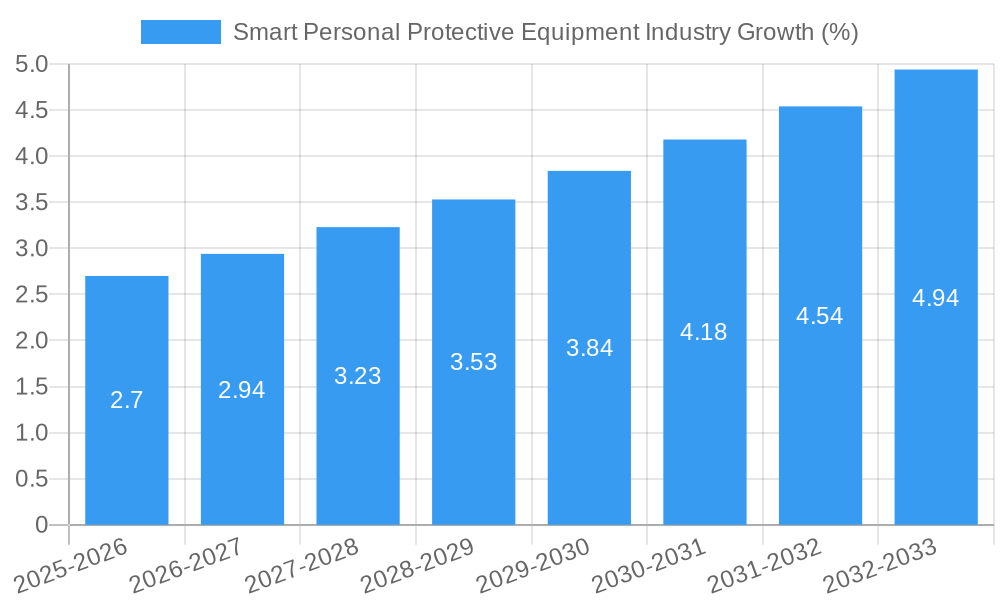
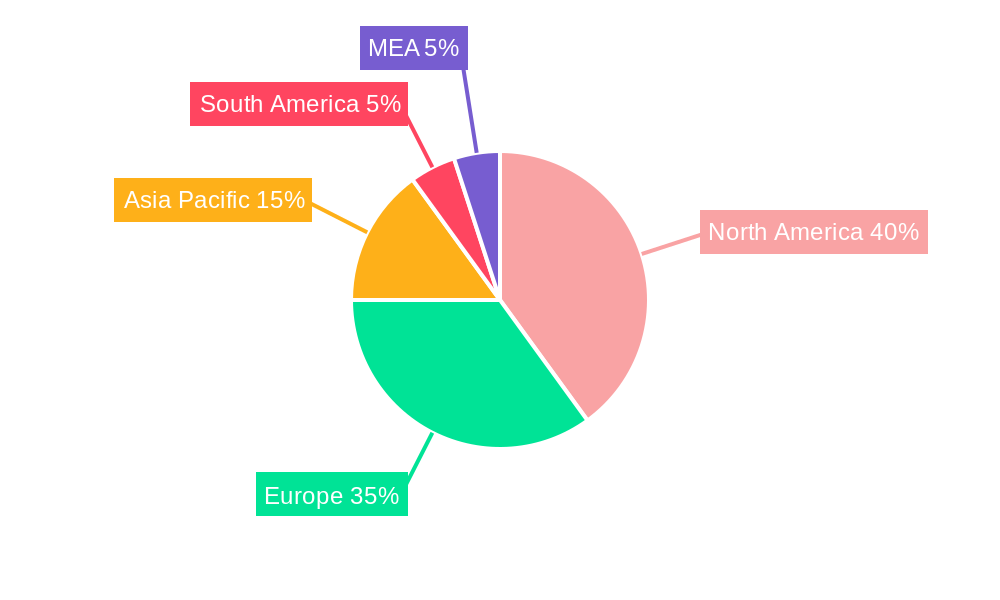
The Smart Personal Protective Equipment (PPE) market is experiencing robust growth, projected to reach \$24.90 million in 2025 and exhibiting a Compound Annual Growth Rate (CAGR) of 10.93% from 2025 to 2033. This expansion is driven by several key factors. Increasing workplace safety regulations across various industries, particularly in construction, manufacturing, and oil & gas, are mandating the adoption of advanced safety solutions. Furthermore, the growing awareness of worker safety and the rising cost of workplace injuries are compelling companies to invest in smart PPE technologies that enhance safety and productivity. Technological advancements, such as the integration of sensors, connectivity, and data analytics into PPE, are enabling real-time monitoring of worker conditions and environmental hazards, leading to proactive interventions and reduced risks. The incorporation of features like fall detection, impact monitoring, and proximity warnings within smart helmets, clothing, and other equipment are driving market growth. The market is segmented by equipment type (eye and face protection, hearing protection, head protection, fall protection, smart clothing, and others) and end-user industry (construction, mining, oil & gas, manufacturing, automotive, and others), allowing for targeted market penetration strategies. North America and Europe currently dominate the market due to stringent safety regulations and high technological adoption rates, but the Asia-Pacific region is expected to witness significant growth in the coming years due to increasing industrialization and rising worker safety concerns.
The competitive landscape is characterized by a mix of established players like Honeywell International Inc., 3M Company, and Uvex Group, along with innovative startups focusing on specific smart PPE solutions. The market's future hinges on the continuous development and adoption of sophisticated technologies, along with the integration of data analytics platforms for efficient risk management and improved worker safety outcomes. The increasing adoption of IoT (Internet of Things) technologies for real-time data collection and analysis, coupled with the development of user-friendly interfaces, will be crucial in maximizing the market's potential. Government initiatives promoting the use of smart PPE technologies, along with favorable insurance policies incentivizing their adoption, are expected to further fuel market growth throughout the forecast period. Challenges remain, however, including high initial investment costs and concerns about data privacy and security.
Smart Personal Protective Equipment (PPE) Industry Market Report: 2019-2033
This comprehensive report provides a detailed analysis of the Smart Personal Protective Equipment (PPE) industry, offering invaluable insights for industry professionals, investors, and strategic decision-makers. The report covers the period from 2019 to 2033, with a base year of 2025 and a forecast period of 2025-2033. We analyze market dynamics, growth trends, key players, and future opportunities across various segments and end-user industries. The market size is projected to reach xx million units by 2033.
Smart Personal Protective Equipment Industry Market Dynamics & Structure
This section analyzes the market structure, technological advancements, regulatory landscape, and competitive dynamics within the Smart PPE industry. The market is characterized by a moderately concentrated landscape, with key players such as Honeywell, 3M, and Uvex holding significant market share. However, the emergence of innovative startups is increasing competition.
- Market Concentration: The market is moderately concentrated, with the top 5 players holding an estimated xx% market share in 2025.
- Technological Innovation: Advancements in sensor technology, connectivity, and data analytics are driving the adoption of smart PPE. However, challenges remain in terms of battery life, data security, and seamless integration with existing safety systems.
- Regulatory Frameworks: Stringent safety regulations and standards across various industries are driving demand for advanced PPE solutions. Compliance requirements vary across different regions and industries.
- Competitive Product Substitutes: Traditional PPE remains a significant competitor, particularly in price-sensitive markets. The cost-effectiveness and ease of use of traditional PPE pose a barrier for smart PPE adoption.
- End-User Demographics: The increasing awareness of workplace safety and the rising incidence of workplace accidents are key drivers for the growing demand for smart PPE, especially among large enterprises.
- M&A Trends: The Smart PPE industry has witnessed a moderate level of M&A activity in recent years, with larger companies acquiring smaller, innovative firms to expand their product portfolios and technological capabilities. The number of deals is expected to reach xx in 2025.
Smart Personal Protective Equipment Industry Growth Trends & Insights
The Smart PPE market experienced significant growth during the historical period (2019-2024), driven by increasing awareness of worker safety and technological advancements. The market size is estimated at xx million units in 2025. We project a Compound Annual Growth Rate (CAGR) of xx% during the forecast period (2025-2033), reaching xx million units by 2033. This growth is fueled by factors such as increasing adoption rates across various end-user industries, technological disruptions, and a shift in consumer behavior towards more technologically advanced and data-driven safety solutions. The construction and manufacturing sectors are leading adoption, with a combined market share of xx%.
Dominant Regions, Countries, or Segments in Smart Personal Protective Equipment Industry
North America and Europe currently dominate the Smart PPE market, driven by stringent safety regulations and higher adoption rates in developed economies. However, the Asia-Pacific region is expected to witness significant growth in the coming years, fueled by rapid industrialization and infrastructure development.
Leading Segments:
- Type: Head protection and fall protection segments currently hold the largest market share, with xx million and xx million units respectively in 2025. The smart clothing segment is expected to experience the fastest growth.
- End-User Industry: Construction, manufacturing, and oil & gas sectors are the major consumers of smart PPE due to high occupational risks.
Key Drivers:
- Stringent Safety Regulations: Governments in developed countries are implementing strict safety regulations, mandating the use of advanced safety equipment.
- Rising Worker Safety Awareness: Increased awareness of workplace accidents and their associated costs is driving demand for enhanced safety solutions.
- Technological Advancements: Continuous innovation in sensor technology, data analytics, and connectivity are making smart PPE more efficient and effective.
- Government Initiatives: Government support and funding for R&D in workplace safety technologies are driving market growth.
Smart Personal Protective Equipment Industry Product Landscape
Smart PPE products are evolving rapidly, incorporating advanced features such as real-time monitoring of vital signs, location tracking, and fall detection. These innovations enhance worker safety, improve operational efficiency, and provide valuable data for risk management. Key features include integrated sensors, wireless communication capabilities, data analytics dashboards, and cloud-based platforms for data storage and analysis. Unique selling propositions include improved worker safety, enhanced situational awareness, and reduced workplace accidents.
Key Drivers, Barriers & Challenges in Smart Personal Protective Equipment Industry
Key Drivers:
- Technological advancements in sensor technology, IoT, and AI
- Increasing awareness of workplace safety
- Stringent government regulations
- Rising demand for real-time monitoring and data analytics
Key Challenges:
- High initial investment costs associated with smart PPE
- Concerns regarding data privacy and security
- Interoperability issues between different smart PPE devices
- Limited availability of skilled workforce for implementation and maintenance.
Emerging Opportunities in Smart Personal Protective Equipment Industry
Emerging opportunities include:
- Expansion into untapped markets, such as emerging economies in Asia and Africa.
- Development of new applications for smart PPE in diverse industries, such as healthcare and agriculture.
- Integration of smart PPE with other workplace safety technologies, such as wearable cameras and environmental monitoring systems.
Growth Accelerators in the Smart Personal Protective Equipment Industry
Long-term growth will be driven by technological breakthroughs, strategic partnerships, and market expansion strategies. Further innovation in sensor technology, improved battery life, and the development of more user-friendly interfaces will be crucial in driving wider adoption. Strategic partnerships between PPE manufacturers and technology companies will help accelerate innovation and market penetration.
Key Players Shaping the Smart Personal Protective Equipment Industry Market
- Honeywell International Inc
- Uvex Group
- IML Group PLC (Hazardex)
- 3M Company
- Seebo Interactive LTD
- Tenacious Holdings Inc (dba Ergodyne)
- Intellinium
- Daqri
- Vuzix Corp
- Corvex Connected Worker
Notable Milestones in Smart Personal Protective Equipment Industry Sector
- 2020: 3M launches a new range of smart hard hats with integrated sensors.
- 2022: Honeywell acquires a startup specializing in smart clothing technology.
- 2023: New safety regulations mandate the use of smart PPE in certain industries.
In-Depth Smart Personal Protective Equipment Industry Market Outlook
The Smart PPE market is poised for continued growth, driven by technological advancements, rising safety awareness, and stringent regulations. Strategic partnerships, focus on innovation, and expansion into new markets will be key to success in this dynamic industry. The future holds significant potential for smart PPE to revolutionize workplace safety and improve operational efficiency.
Smart Personal Protective Equipment Industry Segmentation
-
1. Type
- 1.1. Eye and Face Protection
- 1.2. Hearing Protection
- 1.3. Head Protection
- 1.4. Fall Protection
- 1.5. Smart Clothing
- 1.6. Other Types
-
2. End-user Industry
- 2.1. Construction
- 2.2. Mining
- 2.3. Oil and Gas
- 2.4. Manufacturing
- 2.5. Automotive
- 2.6. Other End-user Industries
Smart Personal Protective Equipment Industry Segmentation By Geography
- 1. North America
- 2. Europe
- 3. Asia
- 4. Australia and New Zealand
- 5. Latin America
- 6. Middle East and Africa
Smart Personal Protective Equipment Industry REPORT HIGHLIGHTS
| Aspects | Details |
|---|---|
| Study Period | 2019-2033 |
| Base Year | 2024 |
| Estimated Year | 2025 |
| Forecast Period | 2025-2033 |
| Historical Period | 2019-2024 |
| Growth Rate | CAGR of 10.93% from 2019-2033 |
| Segmentation |
|
Table of Contents
- 1. Introduction
- 1.1. Research Scope
- 1.2. Market Segmentation
- 1.3. Research Methodology
- 1.4. Definitions and Assumptions
- 2. Executive Summary
- 2.1. Introduction
- 3. Market Dynamics
- 3.1. Introduction
- 3.2. Market Drivers
- 3.2.1. ; Improvement in worker productivity and decrease in worker injury; Increase in the development in IoT and connectivity technologies
- 3.3. Market Restrains
- 3.3.1. ; Growing concerns related to security of personal information; Stringent work regulations at operating facilities
- 3.4. Market Trends
- 3.4.1. The usage of Smart PPE in construction to witness a significant growth
- 4. Market Factor Analysis
- 4.1. Porters Five Forces
- 4.2. Supply/Value Chain
- 4.3. PESTEL analysis
- 4.4. Market Entropy
- 4.5. Patent/Trademark Analysis
- 5. Global Smart Personal Protective Equipment Industry Analysis, Insights and Forecast, 2019-2031
- 5.1. Market Analysis, Insights and Forecast - by Type
- 5.1.1. Eye and Face Protection
- 5.1.2. Hearing Protection
- 5.1.3. Head Protection
- 5.1.4. Fall Protection
- 5.1.5. Smart Clothing
- 5.1.6. Other Types
- 5.2. Market Analysis, Insights and Forecast - by End-user Industry
- 5.2.1. Construction
- 5.2.2. Mining
- 5.2.3. Oil and Gas
- 5.2.4. Manufacturing
- 5.2.5. Automotive
- 5.2.6. Other End-user Industries
- 5.3. Market Analysis, Insights and Forecast - by Region
- 5.3.1. North America
- 5.3.2. Europe
- 5.3.3. Asia
- 5.3.4. Australia and New Zealand
- 5.3.5. Latin America
- 5.3.6. Middle East and Africa
- 5.1. Market Analysis, Insights and Forecast - by Type
- 6. North America Smart Personal Protective Equipment Industry Analysis, Insights and Forecast, 2019-2031
- 6.1. Market Analysis, Insights and Forecast - by Type
- 6.1.1. Eye and Face Protection
- 6.1.2. Hearing Protection
- 6.1.3. Head Protection
- 6.1.4. Fall Protection
- 6.1.5. Smart Clothing
- 6.1.6. Other Types
- 6.2. Market Analysis, Insights and Forecast - by End-user Industry
- 6.2.1. Construction
- 6.2.2. Mining
- 6.2.3. Oil and Gas
- 6.2.4. Manufacturing
- 6.2.5. Automotive
- 6.2.6. Other End-user Industries
- 6.1. Market Analysis, Insights and Forecast - by Type
- 7. Europe Smart Personal Protective Equipment Industry Analysis, Insights and Forecast, 2019-2031
- 7.1. Market Analysis, Insights and Forecast - by Type
- 7.1.1. Eye and Face Protection
- 7.1.2. Hearing Protection
- 7.1.3. Head Protection
- 7.1.4. Fall Protection
- 7.1.5. Smart Clothing
- 7.1.6. Other Types
- 7.2. Market Analysis, Insights and Forecast - by End-user Industry
- 7.2.1. Construction
- 7.2.2. Mining
- 7.2.3. Oil and Gas
- 7.2.4. Manufacturing
- 7.2.5. Automotive
- 7.2.6. Other End-user Industries
- 7.1. Market Analysis, Insights and Forecast - by Type
- 8. Asia Smart Personal Protective Equipment Industry Analysis, Insights and Forecast, 2019-2031
- 8.1. Market Analysis, Insights and Forecast - by Type
- 8.1.1. Eye and Face Protection
- 8.1.2. Hearing Protection
- 8.1.3. Head Protection
- 8.1.4. Fall Protection
- 8.1.5. Smart Clothing
- 8.1.6. Other Types
- 8.2. Market Analysis, Insights and Forecast - by End-user Industry
- 8.2.1. Construction
- 8.2.2. Mining
- 8.2.3. Oil and Gas
- 8.2.4. Manufacturing
- 8.2.5. Automotive
- 8.2.6. Other End-user Industries
- 8.1. Market Analysis, Insights and Forecast - by Type
- 9. Australia and New Zealand Smart Personal Protective Equipment Industry Analysis, Insights and Forecast, 2019-2031
- 9.1. Market Analysis, Insights and Forecast - by Type
- 9.1.1. Eye and Face Protection
- 9.1.2. Hearing Protection
- 9.1.3. Head Protection
- 9.1.4. Fall Protection
- 9.1.5. Smart Clothing
- 9.1.6. Other Types
- 9.2. Market Analysis, Insights and Forecast - by End-user Industry
- 9.2.1. Construction
- 9.2.2. Mining
- 9.2.3. Oil and Gas
- 9.2.4. Manufacturing
- 9.2.5. Automotive
- 9.2.6. Other End-user Industries
- 9.1. Market Analysis, Insights and Forecast - by Type
- 10. Latin America Smart Personal Protective Equipment Industry Analysis, Insights and Forecast, 2019-2031
- 10.1. Market Analysis, Insights and Forecast - by Type
- 10.1.1. Eye and Face Protection
- 10.1.2. Hearing Protection
- 10.1.3. Head Protection
- 10.1.4. Fall Protection
- 10.1.5. Smart Clothing
- 10.1.6. Other Types
- 10.2. Market Analysis, Insights and Forecast - by End-user Industry
- 10.2.1. Construction
- 10.2.2. Mining
- 10.2.3. Oil and Gas
- 10.2.4. Manufacturing
- 10.2.5. Automotive
- 10.2.6. Other End-user Industries
- 10.1. Market Analysis, Insights and Forecast - by Type
- 11. Middle East and Africa Smart Personal Protective Equipment Industry Analysis, Insights and Forecast, 2019-2031
- 11.1. Market Analysis, Insights and Forecast - by Type
- 11.1.1. Eye and Face Protection
- 11.1.2. Hearing Protection
- 11.1.3. Head Protection
- 11.1.4. Fall Protection
- 11.1.5. Smart Clothing
- 11.1.6. Other Types
- 11.2. Market Analysis, Insights and Forecast - by End-user Industry
- 11.2.1. Construction
- 11.2.2. Mining
- 11.2.3. Oil and Gas
- 11.2.4. Manufacturing
- 11.2.5. Automotive
- 11.2.6. Other End-user Industries
- 11.1. Market Analysis, Insights and Forecast - by Type
- 12. North America Smart Personal Protective Equipment Industry Analysis, Insights and Forecast, 2019-2031
- 12.1. Market Analysis, Insights and Forecast - By Country/Sub-region
- 12.1.1 United States
- 12.1.2 Canada
- 12.1.3 Mexico
- 13. Europe Smart Personal Protective Equipment Industry Analysis, Insights and Forecast, 2019-2031
- 13.1. Market Analysis, Insights and Forecast - By Country/Sub-region
- 13.1.1 Germany
- 13.1.2 United Kingdom
- 13.1.3 France
- 13.1.4 Spain
- 13.1.5 Italy
- 13.1.6 Spain
- 13.1.7 Belgium
- 13.1.8 Netherland
- 13.1.9 Nordics
- 13.1.10 Rest of Europe
- 14. Asia Pacific Smart Personal Protective Equipment Industry Analysis, Insights and Forecast, 2019-2031
- 14.1. Market Analysis, Insights and Forecast - By Country/Sub-region
- 14.1.1 China
- 14.1.2 Japan
- 14.1.3 India
- 14.1.4 South Korea
- 14.1.5 Southeast Asia
- 14.1.6 Australia
- 14.1.7 Indonesia
- 14.1.8 Phillipes
- 14.1.9 Singapore
- 14.1.10 Thailandc
- 14.1.11 Rest of Asia Pacific
- 15. South America Smart Personal Protective Equipment Industry Analysis, Insights and Forecast, 2019-2031
- 15.1. Market Analysis, Insights and Forecast - By Country/Sub-region
- 15.1.1 Brazil
- 15.1.2 Argentina
- 15.1.3 Peru
- 15.1.4 Chile
- 15.1.5 Colombia
- 15.1.6 Ecuador
- 15.1.7 Venezuela
- 15.1.8 Rest of South America
- 16. North America Smart Personal Protective Equipment Industry Analysis, Insights and Forecast, 2019-2031
- 16.1. Market Analysis, Insights and Forecast - By Country/Sub-region
- 16.1.1 United States
- 16.1.2 Canada
- 16.1.3 Mexico
- 17. MEA Smart Personal Protective Equipment Industry Analysis, Insights and Forecast, 2019-2031
- 17.1. Market Analysis, Insights and Forecast - By Country/Sub-region
- 17.1.1 United Arab Emirates
- 17.1.2 Saudi Arabia
- 17.1.3 South Africa
- 17.1.4 Rest of Middle East and Africa
- 18. Competitive Analysis
- 18.1. Global Market Share Analysis 2024
- 18.2. Company Profiles
- 18.2.1 Honeywell International Inc
- 18.2.1.1. Overview
- 18.2.1.2. Products
- 18.2.1.3. SWOT Analysis
- 18.2.1.4. Recent Developments
- 18.2.1.5. Financials (Based on Availability)
- 18.2.2 Uvex Group
- 18.2.2.1. Overview
- 18.2.2.2. Products
- 18.2.2.3. SWOT Analysis
- 18.2.2.4. Recent Developments
- 18.2.2.5. Financials (Based on Availability)
- 18.2.3 IML Group PLC (Hazardex)
- 18.2.3.1. Overview
- 18.2.3.2. Products
- 18.2.3.3. SWOT Analysis
- 18.2.3.4. Recent Developments
- 18.2.3.5. Financials (Based on Availability)
- 18.2.4 3M Company
- 18.2.4.1. Overview
- 18.2.4.2. Products
- 18.2.4.3. SWOT Analysis
- 18.2.4.4. Recent Developments
- 18.2.4.5. Financials (Based on Availability)
- 18.2.5 Seebo Interactive LTD
- 18.2.5.1. Overview
- 18.2.5.2. Products
- 18.2.5.3. SWOT Analysis
- 18.2.5.4. Recent Developments
- 18.2.5.5. Financials (Based on Availability)
- 18.2.6 Tenacious Holdings Inc (dba Ergodyne)
- 18.2.6.1. Overview
- 18.2.6.2. Products
- 18.2.6.3. SWOT Analysis
- 18.2.6.4. Recent Developments
- 18.2.6.5. Financials (Based on Availability)
- 18.2.7 Intellinium
- 18.2.7.1. Overview
- 18.2.7.2. Products
- 18.2.7.3. SWOT Analysis
- 18.2.7.4. Recent Developments
- 18.2.7.5. Financials (Based on Availability)
- 18.2.8 Daqri
- 18.2.8.1. Overview
- 18.2.8.2. Products
- 18.2.8.3. SWOT Analysis
- 18.2.8.4. Recent Developments
- 18.2.8.5. Financials (Based on Availability)
- 18.2.9 Vuzix Corp*List Not Exhaustive
- 18.2.9.1. Overview
- 18.2.9.2. Products
- 18.2.9.3. SWOT Analysis
- 18.2.9.4. Recent Developments
- 18.2.9.5. Financials (Based on Availability)
- 18.2.10 Corvex Connected Worker
- 18.2.10.1. Overview
- 18.2.10.2. Products
- 18.2.10.3. SWOT Analysis
- 18.2.10.4. Recent Developments
- 18.2.10.5. Financials (Based on Availability)
- 18.2.1 Honeywell International Inc
List of Figures
- Figure 1: Global Smart Personal Protective Equipment Industry Revenue Breakdown (Million, %) by Region 2024 & 2032
- Figure 2: North America Smart Personal Protective Equipment Industry Revenue (Million), by Country 2024 & 2032
- Figure 3: North America Smart Personal Protective Equipment Industry Revenue Share (%), by Country 2024 & 2032
- Figure 4: Europe Smart Personal Protective Equipment Industry Revenue (Million), by Country 2024 & 2032
- Figure 5: Europe Smart Personal Protective Equipment Industry Revenue Share (%), by Country 2024 & 2032
- Figure 6: Asia Pacific Smart Personal Protective Equipment Industry Revenue (Million), by Country 2024 & 2032
- Figure 7: Asia Pacific Smart Personal Protective Equipment Industry Revenue Share (%), by Country 2024 & 2032
- Figure 8: South America Smart Personal Protective Equipment Industry Revenue (Million), by Country 2024 & 2032
- Figure 9: South America Smart Personal Protective Equipment Industry Revenue Share (%), by Country 2024 & 2032
- Figure 10: North America Smart Personal Protective Equipment Industry Revenue (Million), by Country 2024 & 2032
- Figure 11: North America Smart Personal Protective Equipment Industry Revenue Share (%), by Country 2024 & 2032
- Figure 12: MEA Smart Personal Protective Equipment Industry Revenue (Million), by Country 2024 & 2032
- Figure 13: MEA Smart Personal Protective Equipment Industry Revenue Share (%), by Country 2024 & 2032
- Figure 14: North America Smart Personal Protective Equipment Industry Revenue (Million), by Type 2024 & 2032
- Figure 15: North America Smart Personal Protective Equipment Industry Revenue Share (%), by Type 2024 & 2032
- Figure 16: North America Smart Personal Protective Equipment Industry Revenue (Million), by End-user Industry 2024 & 2032
- Figure 17: North America Smart Personal Protective Equipment Industry Revenue Share (%), by End-user Industry 2024 & 2032
- Figure 18: North America Smart Personal Protective Equipment Industry Revenue (Million), by Country 2024 & 2032
- Figure 19: North America Smart Personal Protective Equipment Industry Revenue Share (%), by Country 2024 & 2032
- Figure 20: Europe Smart Personal Protective Equipment Industry Revenue (Million), by Type 2024 & 2032
- Figure 21: Europe Smart Personal Protective Equipment Industry Revenue Share (%), by Type 2024 & 2032
- Figure 22: Europe Smart Personal Protective Equipment Industry Revenue (Million), by End-user Industry 2024 & 2032
- Figure 23: Europe Smart Personal Protective Equipment Industry Revenue Share (%), by End-user Industry 2024 & 2032
- Figure 24: Europe Smart Personal Protective Equipment Industry Revenue (Million), by Country 2024 & 2032
- Figure 25: Europe Smart Personal Protective Equipment Industry Revenue Share (%), by Country 2024 & 2032
- Figure 26: Asia Smart Personal Protective Equipment Industry Revenue (Million), by Type 2024 & 2032
- Figure 27: Asia Smart Personal Protective Equipment Industry Revenue Share (%), by Type 2024 & 2032
- Figure 28: Asia Smart Personal Protective Equipment Industry Revenue (Million), by End-user Industry 2024 & 2032
- Figure 29: Asia Smart Personal Protective Equipment Industry Revenue Share (%), by End-user Industry 2024 & 2032
- Figure 30: Asia Smart Personal Protective Equipment Industry Revenue (Million), by Country 2024 & 2032
- Figure 31: Asia Smart Personal Protective Equipment Industry Revenue Share (%), by Country 2024 & 2032
- Figure 32: Australia and New Zealand Smart Personal Protective Equipment Industry Revenue (Million), by Type 2024 & 2032
- Figure 33: Australia and New Zealand Smart Personal Protective Equipment Industry Revenue Share (%), by Type 2024 & 2032
- Figure 34: Australia and New Zealand Smart Personal Protective Equipment Industry Revenue (Million), by End-user Industry 2024 & 2032
- Figure 35: Australia and New Zealand Smart Personal Protective Equipment Industry Revenue Share (%), by End-user Industry 2024 & 2032
- Figure 36: Australia and New Zealand Smart Personal Protective Equipment Industry Revenue (Million), by Country 2024 & 2032
- Figure 37: Australia and New Zealand Smart Personal Protective Equipment Industry Revenue Share (%), by Country 2024 & 2032
- Figure 38: Latin America Smart Personal Protective Equipment Industry Revenue (Million), by Type 2024 & 2032
- Figure 39: Latin America Smart Personal Protective Equipment Industry Revenue Share (%), by Type 2024 & 2032
- Figure 40: Latin America Smart Personal Protective Equipment Industry Revenue (Million), by End-user Industry 2024 & 2032
- Figure 41: Latin America Smart Personal Protective Equipment Industry Revenue Share (%), by End-user Industry 2024 & 2032
- Figure 42: Latin America Smart Personal Protective Equipment Industry Revenue (Million), by Country 2024 & 2032
- Figure 43: Latin America Smart Personal Protective Equipment Industry Revenue Share (%), by Country 2024 & 2032
- Figure 44: Middle East and Africa Smart Personal Protective Equipment Industry Revenue (Million), by Type 2024 & 2032
- Figure 45: Middle East and Africa Smart Personal Protective Equipment Industry Revenue Share (%), by Type 2024 & 2032
- Figure 46: Middle East and Africa Smart Personal Protective Equipment Industry Revenue (Million), by End-user Industry 2024 & 2032
- Figure 47: Middle East and Africa Smart Personal Protective Equipment Industry Revenue Share (%), by End-user Industry 2024 & 2032
- Figure 48: Middle East and Africa Smart Personal Protective Equipment Industry Revenue (Million), by Country 2024 & 2032
- Figure 49: Middle East and Africa Smart Personal Protective Equipment Industry Revenue Share (%), by Country 2024 & 2032
List of Tables
- Table 1: Global Smart Personal Protective Equipment Industry Revenue Million Forecast, by Region 2019 & 2032
- Table 2: Global Smart Personal Protective Equipment Industry Revenue Million Forecast, by Type 2019 & 2032
- Table 3: Global Smart Personal Protective Equipment Industry Revenue Million Forecast, by End-user Industry 2019 & 2032
- Table 4: Global Smart Personal Protective Equipment Industry Revenue Million Forecast, by Region 2019 & 2032
- Table 5: Global Smart Personal Protective Equipment Industry Revenue Million Forecast, by Country 2019 & 2032
- Table 6: United States Smart Personal Protective Equipment Industry Revenue (Million) Forecast, by Application 2019 & 2032
- Table 7: Canada Smart Personal Protective Equipment Industry Revenue (Million) Forecast, by Application 2019 & 2032
- Table 8: Mexico Smart Personal Protective Equipment Industry Revenue (Million) Forecast, by Application 2019 & 2032
- Table 9: Global Smart Personal Protective Equipment Industry Revenue Million Forecast, by Country 2019 & 2032
- Table 10: Germany Smart Personal Protective Equipment Industry Revenue (Million) Forecast, by Application 2019 & 2032
- Table 11: United Kingdom Smart Personal Protective Equipment Industry Revenue (Million) Forecast, by Application 2019 & 2032
- Table 12: France Smart Personal Protective Equipment Industry Revenue (Million) Forecast, by Application 2019 & 2032
- Table 13: Spain Smart Personal Protective Equipment Industry Revenue (Million) Forecast, by Application 2019 & 2032
- Table 14: Italy Smart Personal Protective Equipment Industry Revenue (Million) Forecast, by Application 2019 & 2032
- Table 15: Spain Smart Personal Protective Equipment Industry Revenue (Million) Forecast, by Application 2019 & 2032
- Table 16: Belgium Smart Personal Protective Equipment Industry Revenue (Million) Forecast, by Application 2019 & 2032
- Table 17: Netherland Smart Personal Protective Equipment Industry Revenue (Million) Forecast, by Application 2019 & 2032
- Table 18: Nordics Smart Personal Protective Equipment Industry Revenue (Million) Forecast, by Application 2019 & 2032
- Table 19: Rest of Europe Smart Personal Protective Equipment Industry Revenue (Million) Forecast, by Application 2019 & 2032
- Table 20: Global Smart Personal Protective Equipment Industry Revenue Million Forecast, by Country 2019 & 2032
- Table 21: China Smart Personal Protective Equipment Industry Revenue (Million) Forecast, by Application 2019 & 2032
- Table 22: Japan Smart Personal Protective Equipment Industry Revenue (Million) Forecast, by Application 2019 & 2032
- Table 23: India Smart Personal Protective Equipment Industry Revenue (Million) Forecast, by Application 2019 & 2032
- Table 24: South Korea Smart Personal Protective Equipment Industry Revenue (Million) Forecast, by Application 2019 & 2032
- Table 25: Southeast Asia Smart Personal Protective Equipment Industry Revenue (Million) Forecast, by Application 2019 & 2032
- Table 26: Australia Smart Personal Protective Equipment Industry Revenue (Million) Forecast, by Application 2019 & 2032
- Table 27: Indonesia Smart Personal Protective Equipment Industry Revenue (Million) Forecast, by Application 2019 & 2032
- Table 28: Phillipes Smart Personal Protective Equipment Industry Revenue (Million) Forecast, by Application 2019 & 2032
- Table 29: Singapore Smart Personal Protective Equipment Industry Revenue (Million) Forecast, by Application 2019 & 2032
- Table 30: Thailandc Smart Personal Protective Equipment Industry Revenue (Million) Forecast, by Application 2019 & 2032
- Table 31: Rest of Asia Pacific Smart Personal Protective Equipment Industry Revenue (Million) Forecast, by Application 2019 & 2032
- Table 32: Global Smart Personal Protective Equipment Industry Revenue Million Forecast, by Country 2019 & 2032
- Table 33: Brazil Smart Personal Protective Equipment Industry Revenue (Million) Forecast, by Application 2019 & 2032
- Table 34: Argentina Smart Personal Protective Equipment Industry Revenue (Million) Forecast, by Application 2019 & 2032
- Table 35: Peru Smart Personal Protective Equipment Industry Revenue (Million) Forecast, by Application 2019 & 2032
- Table 36: Chile Smart Personal Protective Equipment Industry Revenue (Million) Forecast, by Application 2019 & 2032
- Table 37: Colombia Smart Personal Protective Equipment Industry Revenue (Million) Forecast, by Application 2019 & 2032
- Table 38: Ecuador Smart Personal Protective Equipment Industry Revenue (Million) Forecast, by Application 2019 & 2032
- Table 39: Venezuela Smart Personal Protective Equipment Industry Revenue (Million) Forecast, by Application 2019 & 2032
- Table 40: Rest of South America Smart Personal Protective Equipment Industry Revenue (Million) Forecast, by Application 2019 & 2032
- Table 41: Global Smart Personal Protective Equipment Industry Revenue Million Forecast, by Country 2019 & 2032
- Table 42: United States Smart Personal Protective Equipment Industry Revenue (Million) Forecast, by Application 2019 & 2032
- Table 43: Canada Smart Personal Protective Equipment Industry Revenue (Million) Forecast, by Application 2019 & 2032
- Table 44: Mexico Smart Personal Protective Equipment Industry Revenue (Million) Forecast, by Application 2019 & 2032
- Table 45: Global Smart Personal Protective Equipment Industry Revenue Million Forecast, by Country 2019 & 2032
- Table 46: United Arab Emirates Smart Personal Protective Equipment Industry Revenue (Million) Forecast, by Application 2019 & 2032
- Table 47: Saudi Arabia Smart Personal Protective Equipment Industry Revenue (Million) Forecast, by Application 2019 & 2032
- Table 48: South Africa Smart Personal Protective Equipment Industry Revenue (Million) Forecast, by Application 2019 & 2032
- Table 49: Rest of Middle East and Africa Smart Personal Protective Equipment Industry Revenue (Million) Forecast, by Application 2019 & 2032
- Table 50: Global Smart Personal Protective Equipment Industry Revenue Million Forecast, by Type 2019 & 2032
- Table 51: Global Smart Personal Protective Equipment Industry Revenue Million Forecast, by End-user Industry 2019 & 2032
- Table 52: Global Smart Personal Protective Equipment Industry Revenue Million Forecast, by Country 2019 & 2032
- Table 53: Global Smart Personal Protective Equipment Industry Revenue Million Forecast, by Type 2019 & 2032
- Table 54: Global Smart Personal Protective Equipment Industry Revenue Million Forecast, by End-user Industry 2019 & 2032
- Table 55: Global Smart Personal Protective Equipment Industry Revenue Million Forecast, by Country 2019 & 2032
- Table 56: Global Smart Personal Protective Equipment Industry Revenue Million Forecast, by Type 2019 & 2032
- Table 57: Global Smart Personal Protective Equipment Industry Revenue Million Forecast, by End-user Industry 2019 & 2032
- Table 58: Global Smart Personal Protective Equipment Industry Revenue Million Forecast, by Country 2019 & 2032
- Table 59: Global Smart Personal Protective Equipment Industry Revenue Million Forecast, by Type 2019 & 2032
- Table 60: Global Smart Personal Protective Equipment Industry Revenue Million Forecast, by End-user Industry 2019 & 2032
- Table 61: Global Smart Personal Protective Equipment Industry Revenue Million Forecast, by Country 2019 & 2032
- Table 62: Global Smart Personal Protective Equipment Industry Revenue Million Forecast, by Type 2019 & 2032
- Table 63: Global Smart Personal Protective Equipment Industry Revenue Million Forecast, by End-user Industry 2019 & 2032
- Table 64: Global Smart Personal Protective Equipment Industry Revenue Million Forecast, by Country 2019 & 2032
- Table 65: Global Smart Personal Protective Equipment Industry Revenue Million Forecast, by Type 2019 & 2032
- Table 66: Global Smart Personal Protective Equipment Industry Revenue Million Forecast, by End-user Industry 2019 & 2032
- Table 67: Global Smart Personal Protective Equipment Industry Revenue Million Forecast, by Country 2019 & 2032
Frequently Asked Questions
1. What is the projected Compound Annual Growth Rate (CAGR) of the Smart Personal Protective Equipment Industry?
The projected CAGR is approximately 10.93%.
2. Which companies are prominent players in the Smart Personal Protective Equipment Industry?
Key companies in the market include Honeywell International Inc, Uvex Group, IML Group PLC (Hazardex), 3M Company, Seebo Interactive LTD, Tenacious Holdings Inc (dba Ergodyne), Intellinium, Daqri, Vuzix Corp*List Not Exhaustive, Corvex Connected Worker.
3. What are the main segments of the Smart Personal Protective Equipment Industry?
The market segments include Type, End-user Industry.
4. Can you provide details about the market size?
The market size is estimated to be USD 24.90 Million as of 2022.
5. What are some drivers contributing to market growth?
; Improvement in worker productivity and decrease in worker injury; Increase in the development in IoT and connectivity technologies.
6. What are the notable trends driving market growth?
The usage of Smart PPE in construction to witness a significant growth.
7. Are there any restraints impacting market growth?
; Growing concerns related to security of personal information; Stringent work regulations at operating facilities.
8. Can you provide examples of recent developments in the market?
N/A
9. What pricing options are available for accessing the report?
Pricing options include single-user, multi-user, and enterprise licenses priced at USD 4750, USD 5250, and USD 8750 respectively.
10. Is the market size provided in terms of value or volume?
The market size is provided in terms of value, measured in Million.
11. Are there any specific market keywords associated with the report?
Yes, the market keyword associated with the report is "Smart Personal Protective Equipment Industry," which aids in identifying and referencing the specific market segment covered.
12. How do I determine which pricing option suits my needs best?
The pricing options vary based on user requirements and access needs. Individual users may opt for single-user licenses, while businesses requiring broader access may choose multi-user or enterprise licenses for cost-effective access to the report.
13. Are there any additional resources or data provided in the Smart Personal Protective Equipment Industry report?
While the report offers comprehensive insights, it's advisable to review the specific contents or supplementary materials provided to ascertain if additional resources or data are available.
14. How can I stay updated on further developments or reports in the Smart Personal Protective Equipment Industry?
To stay informed about further developments, trends, and reports in the Smart Personal Protective Equipment Industry, consider subscribing to industry newsletters, following relevant companies and organizations, or regularly checking reputable industry news sources and publications.
Methodology
Step 1 - Identification of Relevant Samples Size from Population Database


Step 2 - Approaches for Defining Global Market Size (Value, Volume* & Price*)

Note*: In applicable scenarios
Step 3 - Data Sources
Primary Research
- Web Analytics
- Survey Reports
- Research Institute
- Latest Research Reports
- Opinion Leaders
Secondary Research
- Annual Reports
- White Paper
- Latest Press Release
- Industry Association
- Paid Database
- Investor Presentations

Step 4 - Data Triangulation
Involves using different sources of information in order to increase the validity of a study
These sources are likely to be stakeholders in a program - participants, other researchers, program staff, other community members, and so on.
Then we put all data in single framework & apply various statistical tools to find out the dynamic on the market.
During the analysis stage, feedback from the stakeholder groups would be compared to determine areas of agreement as well as areas of divergence


