Key Insights
The Smart Light Pole Gateway market is experiencing significant expansion, propelled by the widespread adoption of smart city initiatives and the imperative for efficient urban infrastructure management. This integration of lighting, communication, and sensor technologies into a singular pole is fundamentally transforming urban environments. It facilitates centralized control of street lighting, optimizing energy consumption and enabling remote monitoring. The incorporation of sensors for environmental data (air quality, noise levels) and public safety (CCTV, emergency call buttons) significantly enhances functionality and value. We project the market size in 2025 to be $9.2 billion, with a Compound Annual Growth Rate (CAGR) of 12.51% anticipated through 2033. This growth is primarily driven by substantial government investment in smart city projects, especially in North America and Europe, alongside increasing private sector engagement in deploying advanced infrastructure solutions.
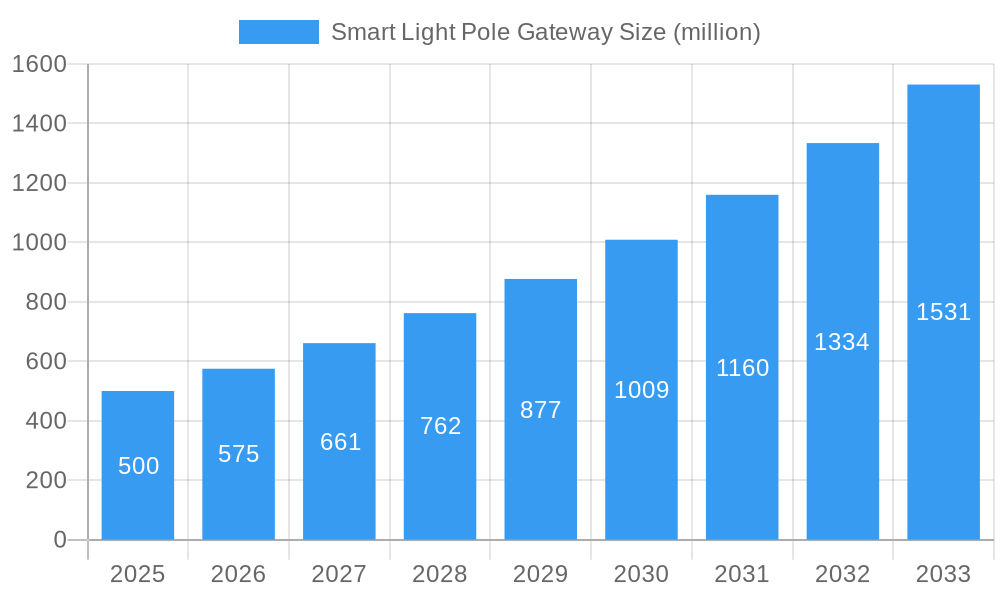
Smart Light Pole Gateway Market Size (In Billion)
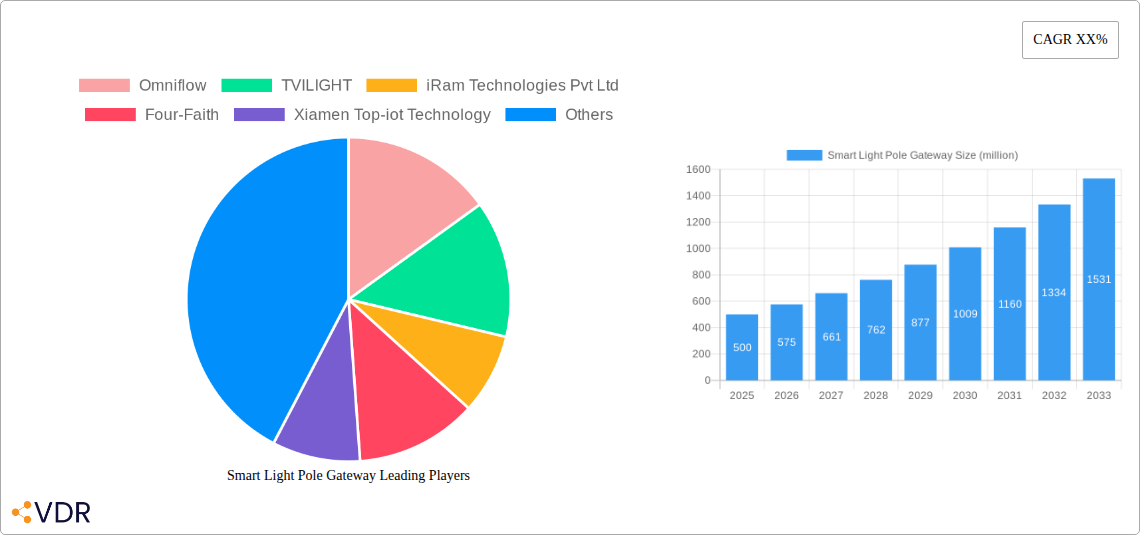
Key challenges include the substantial initial capital required for infrastructure deployment, which can be a barrier for some municipalities. Data security and privacy concerns associated with collected sensor data necessitate robust security protocols and transparent data governance. Furthermore, the standardization of communication protocols and ensuring interoperability across different vendor equipment are crucial for seamless integration and preventing fragmented systems. Despite these hurdles, the long-term outlook for the Smart Light Pole Gateway market remains exceptionally positive, fueled by the escalating demand for sustainable and efficient urban infrastructure, coupled with advancements in IoT technologies and declining component costs. Leading players such as Omniflow, TVILIGHT, and iRam Technologies are actively innovating and forging strategic partnerships, shaping the market's trajectory. Market segmentation is expected to diversify, with specialized gateways tailored to specific application needs gaining prominence.
Smart Light Pole Gateway Company Market Share
This comprehensive report offers an in-depth analysis of the Smart Light Pole Gateway market, covering market dynamics, growth trends, regional leadership, product segmentation, key industry players, and future projections. The analysis spans the period 2019-2033, with 2025 serving as the base and estimated year. The forecast period is 2025-2033, with the historical period covering 2019-2024. This report is an essential resource for industry professionals, investors, and strategic decision-makers seeking to understand and leverage opportunities within this dynamic market.
Smart Light Pole Gateway Market Dynamics & Structure
The Smart Light Pole Gateway market is characterized by a moderately fragmented landscape, with several key players competing for market share. Market concentration is expected to increase slightly over the forecast period due to mergers and acquisitions (M&A) activity. Technological innovation, particularly in areas like 5G connectivity, AI-powered analytics, and energy harvesting, is a primary driver of market growth. Regulatory frameworks, including those related to smart city initiatives and data privacy, significantly impact market development. Competitive substitutes, such as traditional lighting systems, are gradually losing ground to the advantages offered by smart gateways. The end-user demographic encompasses municipalities, transportation authorities, and private sector entities.
- Market Concentration: Moderately fragmented, with a Herfindahl-Hirschman Index (HHI) of xx in 2025, projected to increase to xx by 2033.
- M&A Activity: An estimated xx M&A deals occurred between 2019 and 2024, with a projected xx deals during 2025-2033.
- Technological Innovation: Key drivers include 5G, AI, and energy harvesting technologies. Barriers to innovation include high initial investment costs and interoperability challenges.
- Regulatory Landscape: Government incentives for smart city projects are boosting adoption. Data privacy regulations are influencing market development.
Smart Light Pole Gateway Growth Trends & Insights
The Smart Light Pole Gateway market is experiencing robust growth, fueled by increasing urbanization, rising demand for smart city infrastructure, and advancements in IoT technologies. Market size expanded from xx million units in 2019 to xx million units in 2024, registering a Compound Annual Growth Rate (CAGR) of xx%. This growth trend is anticipated to continue throughout the forecast period, with a projected CAGR of xx% from 2025 to 2033, reaching xx million units by 2033. Market penetration in key regions is expected to increase significantly, driven by factors such as government initiatives promoting smart city deployments and improved affordability of Smart Light Pole Gateways. Technological disruptions, such as the widespread adoption of 5G and the integration of edge computing, further accelerate market expansion. Consumer behavior shifts towards greater environmental awareness and preference for efficient solutions are also key factors propelling market growth.
Dominant Regions, Countries, or Segments in Smart Light Pole Gateway
North America currently holds the largest market share in the Smart Light Pole Gateway sector, driven primarily by strong government support for smart city projects and substantial investments in smart infrastructure. However, the Asia-Pacific region is projected to witness the fastest growth rate during the forecast period, fueled by rapid urbanization, increasing IoT adoption, and favorable government policies. Europe is another significant market, characterized by a focus on sustainable urban development and efficient energy management solutions.
- North America: High adoption rate driven by early adoption of smart city initiatives and significant investments.
- Asia-Pacific: Fastest-growing region due to rapid urbanization, rising IoT adoption, and government support.
- Europe: Strong market presence driven by focus on sustainability and efficient energy management.
- Key Drivers: Government initiatives, smart city investments, and increasing demand for efficient infrastructure solutions.
Smart Light Pole Gateway Product Landscape
Smart Light Pole Gateways are evolving rapidly, incorporating advanced features like multi-protocol support, enhanced security protocols, and improved power management. These gateways are increasingly integrated with various smart city applications, including environmental monitoring, traffic management, and public safety systems. Key performance metrics include data throughput, latency, security features, and power consumption. Unique selling propositions include ease of installation, scalability, and robust connectivity. Technological advancements, such as the incorporation of AI-powered analytics and edge computing capabilities, are enhancing the capabilities of these gateways.
Key Drivers, Barriers & Challenges in Smart Light Pole Gateway
Key Drivers:
- Growing adoption of smart city initiatives globally.
- Increasing demand for efficient and sustainable urban infrastructure.
- Advancements in IoT and 5G technologies.
Challenges & Restraints:
- High initial investment costs for implementing smart pole gateway systems.
- Interoperability issues between different systems and platforms.
- Concerns regarding data security and privacy.
- Supply chain disruptions can impact the availability of components and lead to delays in deployment. This is estimated to reduce market growth by approximately xx% in 2026.
Emerging Opportunities in Smart Light Pole Gateway
Emerging opportunities include the expansion into untapped markets in developing countries, the integration of Smart Light Pole Gateways with other smart city technologies, and the development of innovative applications such as advanced environmental monitoring and smart parking solutions. The increasing demand for private 5G networks offers significant growth potential. Further research and development in the area of energy harvesting technologies could significantly impact the cost-effectiveness and sustainability of Smart Light Pole Gateways.
Growth Accelerators in the Smart Light Pole Gateway Industry
Technological breakthroughs, particularly in areas such as AI-powered analytics and edge computing, are key growth catalysts. Strategic partnerships between technology providers, infrastructure developers, and city municipalities accelerate market expansion. Market expansion strategies targeting emerging markets and the development of tailored solutions for specific industry segments will drive growth. The integration of renewable energy sources and the development of more power-efficient designs can enhance the sustainability and cost-effectiveness of Smart Light Pole Gateways, spurring adoption.
Key Players Shaping the Smart Light Pole Gateway Market
- Omniflow
- TVILIGHT
- iRam Technologies Pvt Ltd
- Four-Faith
- Xiamen Top-iot Technology
- x-speed
- Guangdong HonorInsight IoT Co.,Ltd
- hontekelec
- Xiamen Baima Technology Co.,Ltd
- Forlinx Embedded Technology Co.,Ltd
- JWIPC
- Xiamen Nengjia Nuevo Energy Company
- Shenzhen Beilai Technology Co.,Ltd
- star-elink
Notable Milestones in Smart Light Pole Gateway Sector
- 2020-Q4: Launch of the first 5G-enabled Smart Light Pole Gateway by Omniflow.
- 2022-Q2: Strategic partnership between Four-Faith and a major city municipality for a large-scale smart city deployment.
- 2023-Q3: Acquisition of a smaller competitor by Xiamen Top-iot Technology, consolidating market share.
- 2024-Q1: Introduction of a new energy-harvesting Smart Light Pole Gateway technology by Forlinx Embedded Technology.
In-Depth Smart Light Pole Gateway Market Outlook
The Smart Light Pole Gateway market is poised for substantial growth over the next decade, driven by continuous technological advancements, increasing urbanization, and the growing adoption of smart city initiatives globally. Strategic partnerships and innovative business models will be crucial for success in this market. Significant opportunities exist for companies that can offer cost-effective, scalable, and secure solutions catering to the diverse needs of various market segments. The market’s long-term potential lies in its ability to transform urban landscapes into more efficient, sustainable, and connected environments.
Smart Light Pole Gateway Segmentation
-
1. Application
- 1.1. Automobile
- 1.2. Industrial
- 1.3. Others
-
2. Types
- 2.1. 4G
- 2.2. 5G
Smart Light Pole Gateway Segmentation By Geography
-
1. North America
- 1.1. United States
- 1.2. Canada
- 1.3. Mexico
-
2. South America
- 2.1. Brazil
- 2.2. Argentina
- 2.3. Rest of South America
-
3. Europe
- 3.1. United Kingdom
- 3.2. Germany
- 3.3. France
- 3.4. Italy
- 3.5. Spain
- 3.6. Russia
- 3.7. Benelux
- 3.8. Nordics
- 3.9. Rest of Europe
-
4. Middle East & Africa
- 4.1. Turkey
- 4.2. Israel
- 4.3. GCC
- 4.4. North Africa
- 4.5. South Africa
- 4.6. Rest of Middle East & Africa
-
5. Asia Pacific
- 5.1. China
- 5.2. India
- 5.3. Japan
- 5.4. South Korea
- 5.5. ASEAN
- 5.6. Oceania
- 5.7. Rest of Asia Pacific

Smart Light Pole Gateway Regional Market Share
Geographic Coverage of Smart Light Pole Gateway
Smart Light Pole Gateway REPORT HIGHLIGHTS
| Aspects | Details |
|---|---|
| Study Period | 2020-2034 |
| Base Year | 2025 |
| Estimated Year | 2026 |
| Forecast Period | 2026-2034 |
| Historical Period | 2020-2025 |
| Growth Rate | CAGR of 12.51% from 2020-2034 |
| Segmentation |
|
Table of Contents
- 1. Introduction
- 1.1. Research Scope
- 1.2. Market Segmentation
- 1.3. Research Objective
- 1.4. Definitions and Assumptions
- 2. Executive Summary
- 2.1. Market Snapshot
- 3. Market Dynamics
- 3.1. Market Drivers
- 3.2. Market Restrains
- 3.3. Market Trends
- 3.4. Market Opportunities
- 4. Market Factor Analysis
- 4.1. Porters Five Forces
- 4.1.1. Bargaining Power of Suppliers
- 4.1.2. Bargaining Power of Buyers
- 4.1.3. Threat of New Entrants
- 4.1.4. Threat of Substitutes
- 4.1.5. Competitive Rivalry
- 4.2. PESTEL analysis
- 4.3. BCG Analysis
- 4.3.1. Stars (High Growth, High Market Share)
- 4.3.2. Cash Cows (Low Growth, High Market Share)
- 4.3.3. Question Mark (High Growth, Low Market Share)
- 4.3.4. Dogs (Low Growth, Low Market Share)
- 4.4. Ansoff Matrix Analysis
- 4.5. Supply Chain Analysis
- 4.6. Regulatory Landscape
- 4.7. Current Market Potential and Opportunity Assessment (TAM–SAM–SOM Framework)
- 4.8. VDR Analyst Note
- 4.1. Porters Five Forces
- 5. Market Analysis, Insights and Forecast 2021-2033
- 5.1. Market Analysis, Insights and Forecast - by Application
- 5.1.1. Automobile
- 5.1.2. Industrial
- 5.1.3. Others
- 5.2. Market Analysis, Insights and Forecast - by Types
- 5.2.1. 4G
- 5.2.2. 5G
- 5.3. Market Analysis, Insights and Forecast - by Region
- 5.3.1. North America
- 5.3.2. South America
- 5.3.3. Europe
- 5.3.4. Middle East & Africa
- 5.3.5. Asia Pacific
- 5.1. Market Analysis, Insights and Forecast - by Application
- 6. Global Smart Light Pole Gateway Analysis, Insights and Forecast, 2021-2033
- 6.1. Market Analysis, Insights and Forecast - by Application
- 6.1.1. Automobile
- 6.1.2. Industrial
- 6.1.3. Others
- 6.2. Market Analysis, Insights and Forecast - by Types
- 6.2.1. 4G
- 6.2.2. 5G
- 6.1. Market Analysis, Insights and Forecast - by Application
- 7. North America Smart Light Pole Gateway Analysis, Insights and Forecast, 2021-2033
- 7.1. Market Analysis, Insights and Forecast - by Application
- 7.1.1. Automobile
- 7.1.2. Industrial
- 7.1.3. Others
- 7.2. Market Analysis, Insights and Forecast - by Types
- 7.2.1. 4G
- 7.2.2. 5G
- 7.1. Market Analysis, Insights and Forecast - by Application
- 8. South America Smart Light Pole Gateway Analysis, Insights and Forecast, 2021-2033
- 8.1. Market Analysis, Insights and Forecast - by Application
- 8.1.1. Automobile
- 8.1.2. Industrial
- 8.1.3. Others
- 8.2. Market Analysis, Insights and Forecast - by Types
- 8.2.1. 4G
- 8.2.2. 5G
- 8.1. Market Analysis, Insights and Forecast - by Application
- 9. Europe Smart Light Pole Gateway Analysis, Insights and Forecast, 2021-2033
- 9.1. Market Analysis, Insights and Forecast - by Application
- 9.1.1. Automobile
- 9.1.2. Industrial
- 9.1.3. Others
- 9.2. Market Analysis, Insights and Forecast - by Types
- 9.2.1. 4G
- 9.2.2. 5G
- 9.1. Market Analysis, Insights and Forecast - by Application
- 10. Middle East & Africa Smart Light Pole Gateway Analysis, Insights and Forecast, 2021-2033
- 10.1. Market Analysis, Insights and Forecast - by Application
- 10.1.1. Automobile
- 10.1.2. Industrial
- 10.1.3. Others
- 10.2. Market Analysis, Insights and Forecast - by Types
- 10.2.1. 4G
- 10.2.2. 5G
- 10.1. Market Analysis, Insights and Forecast - by Application
- 11. Asia Pacific Smart Light Pole Gateway Analysis, Insights and Forecast, 2021-2033
- 11.1. Market Analysis, Insights and Forecast - by Application
- 11.1.1. Automobile
- 11.1.2. Industrial
- 11.1.3. Others
- 11.2. Market Analysis, Insights and Forecast - by Types
- 11.2.1. 4G
- 11.2.2. 5G
- 11.1. Market Analysis, Insights and Forecast - by Application
- 12. Competitive Analysis
- 12.1. Company Profiles
- 12.1.1 Omniflow
- 12.1.1.1. Company Overview
- 12.1.1.2. Products
- 12.1.1.3. Company Financials
- 12.1.1.4. SWOT Analysis
- 12.1.2 TVILIGHT
- 12.1.2.1. Company Overview
- 12.1.2.2. Products
- 12.1.2.3. Company Financials
- 12.1.2.4. SWOT Analysis
- 12.1.3 iRam Technologies Pvt Ltd
- 12.1.3.1. Company Overview
- 12.1.3.2. Products
- 12.1.3.3. Company Financials
- 12.1.3.4. SWOT Analysis
- 12.1.4 Four-Faith
- 12.1.4.1. Company Overview
- 12.1.4.2. Products
- 12.1.4.3. Company Financials
- 12.1.4.4. SWOT Analysis
- 12.1.5 Xiamen Top-iot Technology
- 12.1.5.1. Company Overview
- 12.1.5.2. Products
- 12.1.5.3. Company Financials
- 12.1.5.4. SWOT Analysis
- 12.1.6 x-speed
- 12.1.6.1. Company Overview
- 12.1.6.2. Products
- 12.1.6.3. Company Financials
- 12.1.6.4. SWOT Analysis
- 12.1.7 Guangdong HonorInsight IoT Co.
- 12.1.7.1. Company Overview
- 12.1.7.2. Products
- 12.1.7.3. Company Financials
- 12.1.7.4. SWOT Analysis
- 12.1.8 Ltd
- 12.1.8.1. Company Overview
- 12.1.8.2. Products
- 12.1.8.3. Company Financials
- 12.1.8.4. SWOT Analysis
- 12.1.9 hontekelec
- 12.1.9.1. Company Overview
- 12.1.9.2. Products
- 12.1.9.3. Company Financials
- 12.1.9.4. SWOT Analysis
- 12.1.10 Xiamen Baima Technology Co.
- 12.1.10.1. Company Overview
- 12.1.10.2. Products
- 12.1.10.3. Company Financials
- 12.1.10.4. SWOT Analysis
- 12.1.11 Ltd
- 12.1.11.1. Company Overview
- 12.1.11.2. Products
- 12.1.11.3. Company Financials
- 12.1.11.4. SWOT Analysis
- 12.1.12 Forlinx Embedded Technology Co.
- 12.1.12.1. Company Overview
- 12.1.12.2. Products
- 12.1.12.3. Company Financials
- 12.1.12.4. SWOT Analysis
- 12.1.13 Ltd
- 12.1.13.1. Company Overview
- 12.1.13.2. Products
- 12.1.13.3. Company Financials
- 12.1.13.4. SWOT Analysis
- 12.1.14 JWIPC
- 12.1.14.1. Company Overview
- 12.1.14.2. Products
- 12.1.14.3. Company Financials
- 12.1.14.4. SWOT Analysis
- 12.1.15 Xiamen Nengjia Nuevo Energy Company
- 12.1.15.1. Company Overview
- 12.1.15.2. Products
- 12.1.15.3. Company Financials
- 12.1.15.4. SWOT Analysis
- 12.1.16 Shenzhen Beilai Technology Co.
- 12.1.16.1. Company Overview
- 12.1.16.2. Products
- 12.1.16.3. Company Financials
- 12.1.16.4. SWOT Analysis
- 12.1.17 Ltd
- 12.1.17.1. Company Overview
- 12.1.17.2. Products
- 12.1.17.3. Company Financials
- 12.1.17.4. SWOT Analysis
- 12.1.18 star-elink
- 12.1.18.1. Company Overview
- 12.1.18.2. Products
- 12.1.18.3. Company Financials
- 12.1.18.4. SWOT Analysis
- 12.1.1 Omniflow
- 12.2. Market Entropy
- 12.2.1 Company's Key Areas Served
- 12.2.2 Recent Developments
- 12.3. Company Market Share Analysis 2025
- 12.3.1 Top 5 Companies Market Share Analysis
- 12.3.2 Top 3 Companies Market Share Analysis
- 12.4. List of Potential Customers
- 13. Research Methodology
List of Figures
- Figure 1: Global Smart Light Pole Gateway Revenue Breakdown (billion, %) by Region 2025 & 2033
- Figure 2: Global Smart Light Pole Gateway Volume Breakdown (K, %) by Region 2025 & 2033
- Figure 3: North America Smart Light Pole Gateway Revenue (billion), by Application 2025 & 2033
- Figure 4: North America Smart Light Pole Gateway Volume (K), by Application 2025 & 2033
- Figure 5: North America Smart Light Pole Gateway Revenue Share (%), by Application 2025 & 2033
- Figure 6: North America Smart Light Pole Gateway Volume Share (%), by Application 2025 & 2033
- Figure 7: North America Smart Light Pole Gateway Revenue (billion), by Types 2025 & 2033
- Figure 8: North America Smart Light Pole Gateway Volume (K), by Types 2025 & 2033
- Figure 9: North America Smart Light Pole Gateway Revenue Share (%), by Types 2025 & 2033
- Figure 10: North America Smart Light Pole Gateway Volume Share (%), by Types 2025 & 2033
- Figure 11: North America Smart Light Pole Gateway Revenue (billion), by Country 2025 & 2033
- Figure 12: North America Smart Light Pole Gateway Volume (K), by Country 2025 & 2033
- Figure 13: North America Smart Light Pole Gateway Revenue Share (%), by Country 2025 & 2033
- Figure 14: North America Smart Light Pole Gateway Volume Share (%), by Country 2025 & 2033
- Figure 15: South America Smart Light Pole Gateway Revenue (billion), by Application 2025 & 2033
- Figure 16: South America Smart Light Pole Gateway Volume (K), by Application 2025 & 2033
- Figure 17: South America Smart Light Pole Gateway Revenue Share (%), by Application 2025 & 2033
- Figure 18: South America Smart Light Pole Gateway Volume Share (%), by Application 2025 & 2033
- Figure 19: South America Smart Light Pole Gateway Revenue (billion), by Types 2025 & 2033
- Figure 20: South America Smart Light Pole Gateway Volume (K), by Types 2025 & 2033
- Figure 21: South America Smart Light Pole Gateway Revenue Share (%), by Types 2025 & 2033
- Figure 22: South America Smart Light Pole Gateway Volume Share (%), by Types 2025 & 2033
- Figure 23: South America Smart Light Pole Gateway Revenue (billion), by Country 2025 & 2033
- Figure 24: South America Smart Light Pole Gateway Volume (K), by Country 2025 & 2033
- Figure 25: South America Smart Light Pole Gateway Revenue Share (%), by Country 2025 & 2033
- Figure 26: South America Smart Light Pole Gateway Volume Share (%), by Country 2025 & 2033
- Figure 27: Europe Smart Light Pole Gateway Revenue (billion), by Application 2025 & 2033
- Figure 28: Europe Smart Light Pole Gateway Volume (K), by Application 2025 & 2033
- Figure 29: Europe Smart Light Pole Gateway Revenue Share (%), by Application 2025 & 2033
- Figure 30: Europe Smart Light Pole Gateway Volume Share (%), by Application 2025 & 2033
- Figure 31: Europe Smart Light Pole Gateway Revenue (billion), by Types 2025 & 2033
- Figure 32: Europe Smart Light Pole Gateway Volume (K), by Types 2025 & 2033
- Figure 33: Europe Smart Light Pole Gateway Revenue Share (%), by Types 2025 & 2033
- Figure 34: Europe Smart Light Pole Gateway Volume Share (%), by Types 2025 & 2033
- Figure 35: Europe Smart Light Pole Gateway Revenue (billion), by Country 2025 & 2033
- Figure 36: Europe Smart Light Pole Gateway Volume (K), by Country 2025 & 2033
- Figure 37: Europe Smart Light Pole Gateway Revenue Share (%), by Country 2025 & 2033
- Figure 38: Europe Smart Light Pole Gateway Volume Share (%), by Country 2025 & 2033
- Figure 39: Middle East & Africa Smart Light Pole Gateway Revenue (billion), by Application 2025 & 2033
- Figure 40: Middle East & Africa Smart Light Pole Gateway Volume (K), by Application 2025 & 2033
- Figure 41: Middle East & Africa Smart Light Pole Gateway Revenue Share (%), by Application 2025 & 2033
- Figure 42: Middle East & Africa Smart Light Pole Gateway Volume Share (%), by Application 2025 & 2033
- Figure 43: Middle East & Africa Smart Light Pole Gateway Revenue (billion), by Types 2025 & 2033
- Figure 44: Middle East & Africa Smart Light Pole Gateway Volume (K), by Types 2025 & 2033
- Figure 45: Middle East & Africa Smart Light Pole Gateway Revenue Share (%), by Types 2025 & 2033
- Figure 46: Middle East & Africa Smart Light Pole Gateway Volume Share (%), by Types 2025 & 2033
- Figure 47: Middle East & Africa Smart Light Pole Gateway Revenue (billion), by Country 2025 & 2033
- Figure 48: Middle East & Africa Smart Light Pole Gateway Volume (K), by Country 2025 & 2033
- Figure 49: Middle East & Africa Smart Light Pole Gateway Revenue Share (%), by Country 2025 & 2033
- Figure 50: Middle East & Africa Smart Light Pole Gateway Volume Share (%), by Country 2025 & 2033
- Figure 51: Asia Pacific Smart Light Pole Gateway Revenue (billion), by Application 2025 & 2033
- Figure 52: Asia Pacific Smart Light Pole Gateway Volume (K), by Application 2025 & 2033
- Figure 53: Asia Pacific Smart Light Pole Gateway Revenue Share (%), by Application 2025 & 2033
- Figure 54: Asia Pacific Smart Light Pole Gateway Volume Share (%), by Application 2025 & 2033
- Figure 55: Asia Pacific Smart Light Pole Gateway Revenue (billion), by Types 2025 & 2033
- Figure 56: Asia Pacific Smart Light Pole Gateway Volume (K), by Types 2025 & 2033
- Figure 57: Asia Pacific Smart Light Pole Gateway Revenue Share (%), by Types 2025 & 2033
- Figure 58: Asia Pacific Smart Light Pole Gateway Volume Share (%), by Types 2025 & 2033
- Figure 59: Asia Pacific Smart Light Pole Gateway Revenue (billion), by Country 2025 & 2033
- Figure 60: Asia Pacific Smart Light Pole Gateway Volume (K), by Country 2025 & 2033
- Figure 61: Asia Pacific Smart Light Pole Gateway Revenue Share (%), by Country 2025 & 2033
- Figure 62: Asia Pacific Smart Light Pole Gateway Volume Share (%), by Country 2025 & 2033
List of Tables
- Table 1: Global Smart Light Pole Gateway Revenue billion Forecast, by Application 2020 & 2033
- Table 2: Global Smart Light Pole Gateway Volume K Forecast, by Application 2020 & 2033
- Table 3: Global Smart Light Pole Gateway Revenue billion Forecast, by Types 2020 & 2033
- Table 4: Global Smart Light Pole Gateway Volume K Forecast, by Types 2020 & 2033
- Table 5: Global Smart Light Pole Gateway Revenue billion Forecast, by Region 2020 & 2033
- Table 6: Global Smart Light Pole Gateway Volume K Forecast, by Region 2020 & 2033
- Table 7: Global Smart Light Pole Gateway Revenue billion Forecast, by Application 2020 & 2033
- Table 8: Global Smart Light Pole Gateway Volume K Forecast, by Application 2020 & 2033
- Table 9: Global Smart Light Pole Gateway Revenue billion Forecast, by Types 2020 & 2033
- Table 10: Global Smart Light Pole Gateway Volume K Forecast, by Types 2020 & 2033
- Table 11: Global Smart Light Pole Gateway Revenue billion Forecast, by Country 2020 & 2033
- Table 12: Global Smart Light Pole Gateway Volume K Forecast, by Country 2020 & 2033
- Table 13: United States Smart Light Pole Gateway Revenue (billion) Forecast, by Application 2020 & 2033
- Table 14: United States Smart Light Pole Gateway Volume (K) Forecast, by Application 2020 & 2033
- Table 15: Canada Smart Light Pole Gateway Revenue (billion) Forecast, by Application 2020 & 2033
- Table 16: Canada Smart Light Pole Gateway Volume (K) Forecast, by Application 2020 & 2033
- Table 17: Mexico Smart Light Pole Gateway Revenue (billion) Forecast, by Application 2020 & 2033
- Table 18: Mexico Smart Light Pole Gateway Volume (K) Forecast, by Application 2020 & 2033
- Table 19: Global Smart Light Pole Gateway Revenue billion Forecast, by Application 2020 & 2033
- Table 20: Global Smart Light Pole Gateway Volume K Forecast, by Application 2020 & 2033
- Table 21: Global Smart Light Pole Gateway Revenue billion Forecast, by Types 2020 & 2033
- Table 22: Global Smart Light Pole Gateway Volume K Forecast, by Types 2020 & 2033
- Table 23: Global Smart Light Pole Gateway Revenue billion Forecast, by Country 2020 & 2033
- Table 24: Global Smart Light Pole Gateway Volume K Forecast, by Country 2020 & 2033
- Table 25: Brazil Smart Light Pole Gateway Revenue (billion) Forecast, by Application 2020 & 2033
- Table 26: Brazil Smart Light Pole Gateway Volume (K) Forecast, by Application 2020 & 2033
- Table 27: Argentina Smart Light Pole Gateway Revenue (billion) Forecast, by Application 2020 & 2033
- Table 28: Argentina Smart Light Pole Gateway Volume (K) Forecast, by Application 2020 & 2033
- Table 29: Rest of South America Smart Light Pole Gateway Revenue (billion) Forecast, by Application 2020 & 2033
- Table 30: Rest of South America Smart Light Pole Gateway Volume (K) Forecast, by Application 2020 & 2033
- Table 31: Global Smart Light Pole Gateway Revenue billion Forecast, by Application 2020 & 2033
- Table 32: Global Smart Light Pole Gateway Volume K Forecast, by Application 2020 & 2033
- Table 33: Global Smart Light Pole Gateway Revenue billion Forecast, by Types 2020 & 2033
- Table 34: Global Smart Light Pole Gateway Volume K Forecast, by Types 2020 & 2033
- Table 35: Global Smart Light Pole Gateway Revenue billion Forecast, by Country 2020 & 2033
- Table 36: Global Smart Light Pole Gateway Volume K Forecast, by Country 2020 & 2033
- Table 37: United Kingdom Smart Light Pole Gateway Revenue (billion) Forecast, by Application 2020 & 2033
- Table 38: United Kingdom Smart Light Pole Gateway Volume (K) Forecast, by Application 2020 & 2033
- Table 39: Germany Smart Light Pole Gateway Revenue (billion) Forecast, by Application 2020 & 2033
- Table 40: Germany Smart Light Pole Gateway Volume (K) Forecast, by Application 2020 & 2033
- Table 41: France Smart Light Pole Gateway Revenue (billion) Forecast, by Application 2020 & 2033
- Table 42: France Smart Light Pole Gateway Volume (K) Forecast, by Application 2020 & 2033
- Table 43: Italy Smart Light Pole Gateway Revenue (billion) Forecast, by Application 2020 & 2033
- Table 44: Italy Smart Light Pole Gateway Volume (K) Forecast, by Application 2020 & 2033
- Table 45: Spain Smart Light Pole Gateway Revenue (billion) Forecast, by Application 2020 & 2033
- Table 46: Spain Smart Light Pole Gateway Volume (K) Forecast, by Application 2020 & 2033
- Table 47: Russia Smart Light Pole Gateway Revenue (billion) Forecast, by Application 2020 & 2033
- Table 48: Russia Smart Light Pole Gateway Volume (K) Forecast, by Application 2020 & 2033
- Table 49: Benelux Smart Light Pole Gateway Revenue (billion) Forecast, by Application 2020 & 2033
- Table 50: Benelux Smart Light Pole Gateway Volume (K) Forecast, by Application 2020 & 2033
- Table 51: Nordics Smart Light Pole Gateway Revenue (billion) Forecast, by Application 2020 & 2033
- Table 52: Nordics Smart Light Pole Gateway Volume (K) Forecast, by Application 2020 & 2033
- Table 53: Rest of Europe Smart Light Pole Gateway Revenue (billion) Forecast, by Application 2020 & 2033
- Table 54: Rest of Europe Smart Light Pole Gateway Volume (K) Forecast, by Application 2020 & 2033
- Table 55: Global Smart Light Pole Gateway Revenue billion Forecast, by Application 2020 & 2033
- Table 56: Global Smart Light Pole Gateway Volume K Forecast, by Application 2020 & 2033
- Table 57: Global Smart Light Pole Gateway Revenue billion Forecast, by Types 2020 & 2033
- Table 58: Global Smart Light Pole Gateway Volume K Forecast, by Types 2020 & 2033
- Table 59: Global Smart Light Pole Gateway Revenue billion Forecast, by Country 2020 & 2033
- Table 60: Global Smart Light Pole Gateway Volume K Forecast, by Country 2020 & 2033
- Table 61: Turkey Smart Light Pole Gateway Revenue (billion) Forecast, by Application 2020 & 2033
- Table 62: Turkey Smart Light Pole Gateway Volume (K) Forecast, by Application 2020 & 2033
- Table 63: Israel Smart Light Pole Gateway Revenue (billion) Forecast, by Application 2020 & 2033
- Table 64: Israel Smart Light Pole Gateway Volume (K) Forecast, by Application 2020 & 2033
- Table 65: GCC Smart Light Pole Gateway Revenue (billion) Forecast, by Application 2020 & 2033
- Table 66: GCC Smart Light Pole Gateway Volume (K) Forecast, by Application 2020 & 2033
- Table 67: North Africa Smart Light Pole Gateway Revenue (billion) Forecast, by Application 2020 & 2033
- Table 68: North Africa Smart Light Pole Gateway Volume (K) Forecast, by Application 2020 & 2033
- Table 69: South Africa Smart Light Pole Gateway Revenue (billion) Forecast, by Application 2020 & 2033
- Table 70: South Africa Smart Light Pole Gateway Volume (K) Forecast, by Application 2020 & 2033
- Table 71: Rest of Middle East & Africa Smart Light Pole Gateway Revenue (billion) Forecast, by Application 2020 & 2033
- Table 72: Rest of Middle East & Africa Smart Light Pole Gateway Volume (K) Forecast, by Application 2020 & 2033
- Table 73: Global Smart Light Pole Gateway Revenue billion Forecast, by Application 2020 & 2033
- Table 74: Global Smart Light Pole Gateway Volume K Forecast, by Application 2020 & 2033
- Table 75: Global Smart Light Pole Gateway Revenue billion Forecast, by Types 2020 & 2033
- Table 76: Global Smart Light Pole Gateway Volume K Forecast, by Types 2020 & 2033
- Table 77: Global Smart Light Pole Gateway Revenue billion Forecast, by Country 2020 & 2033
- Table 78: Global Smart Light Pole Gateway Volume K Forecast, by Country 2020 & 2033
- Table 79: China Smart Light Pole Gateway Revenue (billion) Forecast, by Application 2020 & 2033
- Table 80: China Smart Light Pole Gateway Volume (K) Forecast, by Application 2020 & 2033
- Table 81: India Smart Light Pole Gateway Revenue (billion) Forecast, by Application 2020 & 2033
- Table 82: India Smart Light Pole Gateway Volume (K) Forecast, by Application 2020 & 2033
- Table 83: Japan Smart Light Pole Gateway Revenue (billion) Forecast, by Application 2020 & 2033
- Table 84: Japan Smart Light Pole Gateway Volume (K) Forecast, by Application 2020 & 2033
- Table 85: South Korea Smart Light Pole Gateway Revenue (billion) Forecast, by Application 2020 & 2033
- Table 86: South Korea Smart Light Pole Gateway Volume (K) Forecast, by Application 2020 & 2033
- Table 87: ASEAN Smart Light Pole Gateway Revenue (billion) Forecast, by Application 2020 & 2033
- Table 88: ASEAN Smart Light Pole Gateway Volume (K) Forecast, by Application 2020 & 2033
- Table 89: Oceania Smart Light Pole Gateway Revenue (billion) Forecast, by Application 2020 & 2033
- Table 90: Oceania Smart Light Pole Gateway Volume (K) Forecast, by Application 2020 & 2033
- Table 91: Rest of Asia Pacific Smart Light Pole Gateway Revenue (billion) Forecast, by Application 2020 & 2033
- Table 92: Rest of Asia Pacific Smart Light Pole Gateway Volume (K) Forecast, by Application 2020 & 2033
Frequently Asked Questions
1. What is the projected Compound Annual Growth Rate (CAGR) of the Smart Light Pole Gateway?
The projected CAGR is approximately 12.51%.
2. Which companies are prominent players in the Smart Light Pole Gateway?
Key companies in the market include Omniflow, TVILIGHT, iRam Technologies Pvt Ltd, Four-Faith, Xiamen Top-iot Technology, x-speed, Guangdong HonorInsight IoT Co., Ltd, hontekelec, Xiamen Baima Technology Co., Ltd, Forlinx Embedded Technology Co., Ltd, JWIPC, Xiamen Nengjia Nuevo Energy Company, Shenzhen Beilai Technology Co., Ltd, star-elink.
3. What are the main segments of the Smart Light Pole Gateway?
The market segments include Application, Types.
4. Can you provide details about the market size?
The market size is estimated to be USD 9.2 billion as of 2022.
5. What are some drivers contributing to market growth?
N/A
6. What are the notable trends driving market growth?
N/A
7. Are there any restraints impacting market growth?
N/A
8. Can you provide examples of recent developments in the market?
N/A
9. What pricing options are available for accessing the report?
Pricing options include single-user, multi-user, and enterprise licenses priced at USD 3950.00, USD 5925.00, and USD 7900.00 respectively.
10. Is the market size provided in terms of value or volume?
The market size is provided in terms of value, measured in billion and volume, measured in K.
11. Are there any specific market keywords associated with the report?
Yes, the market keyword associated with the report is "Smart Light Pole Gateway," which aids in identifying and referencing the specific market segment covered.
12. How do I determine which pricing option suits my needs best?
The pricing options vary based on user requirements and access needs. Individual users may opt for single-user licenses, while businesses requiring broader access may choose multi-user or enterprise licenses for cost-effective access to the report.
13. Are there any additional resources or data provided in the Smart Light Pole Gateway report?
While the report offers comprehensive insights, it's advisable to review the specific contents or supplementary materials provided to ascertain if additional resources or data are available.
14. How can I stay updated on further developments or reports in the Smart Light Pole Gateway?
To stay informed about further developments, trends, and reports in the Smart Light Pole Gateway, consider subscribing to industry newsletters, following relevant companies and organizations, or regularly checking reputable industry news sources and publications.
Methodology
Step 1 - Identification of Relevant Samples Size from Population Database


Step 2 - Approaches for Defining Global Market Size (Value, Volume* & Price*)

Note*: In applicable scenarios
Step 3 - Data Sources
Primary Research
- Web Analytics
- Survey Reports
- Research Institute
- Latest Research Reports
- Opinion Leaders
Secondary Research
- Annual Reports
- White Paper
- Latest Press Release
- Industry Association
- Paid Database
- Investor Presentations

Step 4 - Data Triangulation
Involves using different sources of information in order to increase the validity of a study
These sources are likely to be stakeholders in a program - participants, other researchers, program staff, other community members, and so on.
Then we put all data in single framework & apply various statistical tools to find out the dynamic on the market.
During the analysis stage, feedback from the stakeholder groups would be compared to determine areas of agreement as well as areas of divergence

