
Key Insights
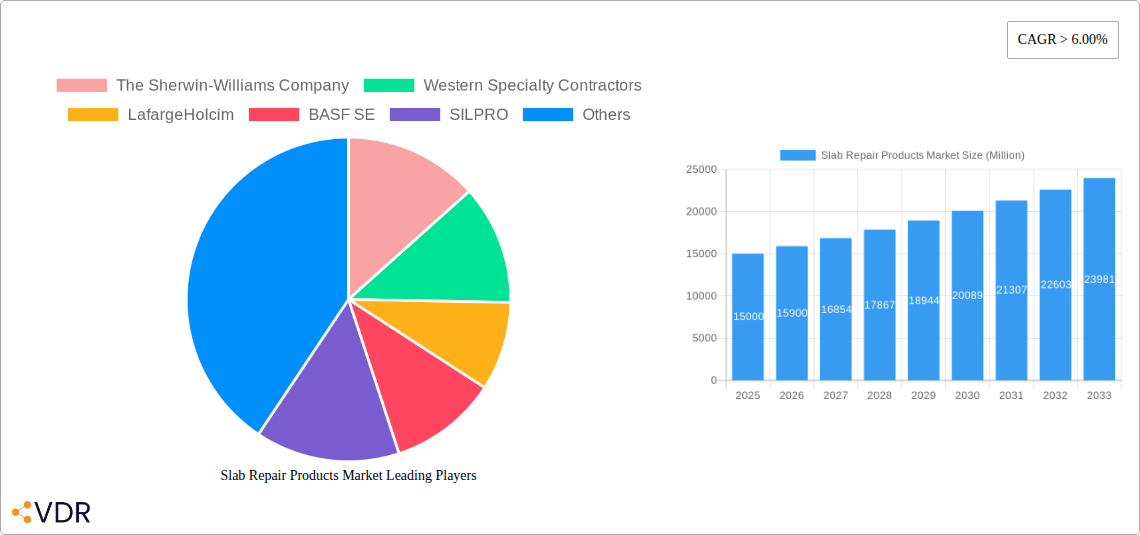
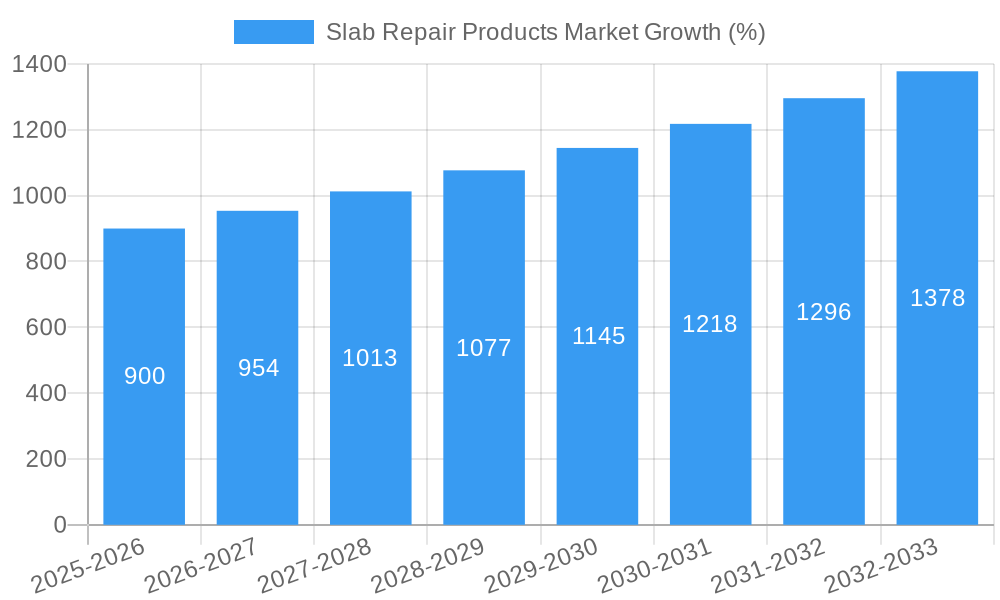
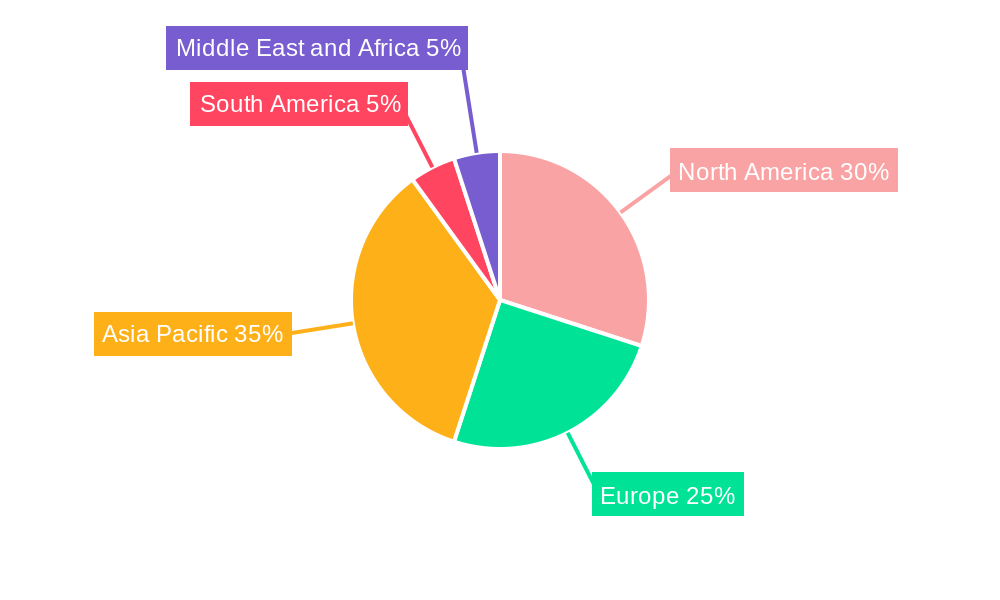
The global slab repair products market is experiencing robust growth, driven by the increasing need for infrastructure maintenance and repair across diverse sectors. The market's expansion is fueled by factors such as aging infrastructure, rising construction activities in developing economies, and the growing demand for durable and efficient repair solutions. A Compound Annual Growth Rate (CAGR) exceeding 6% indicates significant market expansion, with projections pointing towards substantial growth over the forecast period (2025-2033). Polyurethane-based products currently dominate the product type segment, owing to their superior adhesion, flexibility, and rapid curing properties, making them ideal for various applications. However, the epoxy and polyacrylate segments are also expected to witness substantial growth due to their increasing adoption in specialized applications. The building and construction sector constitutes the largest end-user industry segment, followed by roads, pavements, and tunnels. This is attributed to the extensive use of concrete slabs in these applications, making them susceptible to damage and requiring frequent repairs. While North America and Europe currently hold significant market shares, the Asia-Pacific region is projected to exhibit the fastest growth rate, driven by rapid urbanization and infrastructure development in countries like China and India. Key players in the market, including The Sherwin-Williams Company, BASF SE, and Sika AG, are focusing on innovation and strategic partnerships to enhance their market presence and cater to the growing demand. Competition is intense, with companies focusing on product differentiation, superior quality, and efficient distribution networks.
The market faces certain challenges, such as fluctuating raw material prices and stringent environmental regulations. However, the increasing awareness of infrastructure sustainability and the adoption of green building practices are creating opportunities for manufacturers to develop and market environmentally friendly slab repair products. Technological advancements in material science are also contributing to the development of high-performance repair solutions that offer improved durability, longevity, and ease of application. Furthermore, government initiatives aimed at promoting infrastructure development and maintenance are expected to further propel market growth in the coming years. The long-term outlook for the slab repair products market remains positive, with continued growth anticipated throughout the forecast period. The market is poised for further consolidation, with potential mergers and acquisitions among key players.
Slab Repair Products Market: A Comprehensive Report (2019-2033)
This comprehensive report provides a detailed analysis of the Slab Repair Products Market, encompassing market dynamics, growth trends, regional dominance, product landscape, challenges, opportunities, and key players. The study period covers 2019-2033, with 2025 as the base and estimated year. The forecast period extends from 2025 to 2033, and the historical period analyzed is 2019-2024. The market is segmented by product type (Polyurethane, Epoxy, Polyacrylate, Cementitious, Other Product Types) and end-user industry (Buildings, Roads, Pavements, and Tunnels, Railways, Dams, Other End-user Industries). The market is valued in million units.
Slab Repair Products Market Market Dynamics & Structure
The Slab Repair Products market is characterized by moderate concentration, with key players like The Sherwin-Williams Company, BASF SE, and Sika AG holding significant market share (estimated at xx% combined in 2025). Technological innovation, particularly in high-performance materials and application methods, is a major driver. Stringent regulatory frameworks concerning environmental impact and material safety influence product development and adoption. Competitive substitutes, such as traditional repair techniques, exert pressure, especially in price-sensitive segments. The end-user demographic is diverse, encompassing construction companies, infrastructure developers, and government agencies. M&A activity in the past five years has been moderate (xx deals), primarily focused on expanding geographical reach and product portfolios.
- Market Concentration: Moderately concentrated, with top 5 players holding xx% market share in 2025.
- Technological Innovation: Focus on high-performance, sustainable, and rapidly curing materials.
- Regulatory Framework: Increasingly stringent environmental regulations impacting material composition.
- Competitive Substitutes: Traditional repair methods pose a price-based challenge.
- End-User Demographics: Diverse, including construction firms, government bodies, and infrastructure developers.
- M&A Trends: Moderate activity (xx deals since 2019), focused on expansion and portfolio diversification.
Slab Repair Products Market Growth Trends & Insights
The Slab Repair Products market experienced steady growth during the historical period (2019-2024), with a CAGR of xx%. This growth is attributed to increasing infrastructure development globally, particularly in emerging economies, coupled with the rising need for efficient and durable slab repair solutions. The market size in 2025 is estimated at xx million units, and is projected to reach xx million units by 2033, exhibiting a CAGR of xx% during the forecast period (2025-2033). Technological disruptions, such as the adoption of advanced polymers and automated application techniques, are accelerating market penetration. Consumer behavior is shifting towards sustainable and eco-friendly products, creating opportunities for manufacturers offering such solutions. Market penetration in key regions is expected to increase further with improved awareness of lifecycle costs of repairing structures.
Dominant Regions, Countries, or Segments in Slab Repair Products Market
North America currently holds the largest market share (xx% in 2025) in the Slab Repair Products market, driven by robust construction activity and well-established infrastructure. Within product types, Polyurethane and Epoxy segments demonstrate the highest growth, owing to their superior performance characteristics. The Buildings end-user segment dominates, accounting for approximately xx% of the total market in 2025, followed by Roads, Pavements, and Tunnels.
- Key Drivers (North America): Strong construction activity, well-developed infrastructure, and higher spending on maintenance and repairs.
- Key Drivers (Asia Pacific): Rapid infrastructure development, urbanization, and increasing government investments.
- Dominant Product Type: Polyurethane and Epoxy segments, owing to superior performance and durability.
- Dominant End-user: Buildings segment, driven by the large number of aging buildings requiring repairs.
Slab Repair Products Market Product Landscape
The slab repair product landscape is marked by continuous innovation in material science and application methods. Manufacturers are focusing on developing high-performance materials with improved durability, faster curing times, and enhanced sustainability. Unique selling propositions center on superior adhesion, crack bridging capabilities, and resistance to environmental factors. Technological advancements include self-leveling compounds, rapid-setting solutions, and environmentally friendly formulations.
Key Drivers, Barriers & Challenges in Slab Repair Products Market
Key Drivers: Growing infrastructure development globally, increasing urbanization, rising demand for durable repair solutions, and technological advancements in material science are key drivers. Government initiatives promoting infrastructure development in various countries also contribute significantly.
Challenges & Restraints: Fluctuations in raw material prices, stringent environmental regulations, and intense competition from substitute materials pose significant challenges. Supply chain disruptions can impact production and delivery timelines, leading to increased costs. Furthermore, the complex nature of some repair projects may hinder market penetration of advanced products.
Emerging Opportunities in Slab Repair Products Market
Untapped markets in developing countries present significant growth opportunities. Innovative applications, such as the use of 3D printing technology for slab repairs, hold potential. Growing focus on sustainable and eco-friendly materials offers opportunities for manufacturers offering such solutions. Furthermore, the emergence of specialized repair solutions for specific types of slabs opens new avenues for market penetration.
Growth Accelerators in the Slab Repair Products Market Industry
Technological breakthroughs, such as the development of self-healing materials and advanced application techniques, are key growth accelerators. Strategic partnerships between material manufacturers and construction companies can foster innovation and expand market reach. Government initiatives promoting infrastructure investment and green building practices also serve as strong growth catalysts.
Key Players Shaping the Slab Repair Products Market Market
- The Sherwin-Williams Company
- Western Specialty Contractors
- LafargeHolcim
- BASF SE
- SILPRO
- SABIC
- Sika AG
- Schomburg
Notable Milestones in Slab Repair Products Market Sector
- 2020: BASF SE launches a new line of high-performance epoxy-based repair materials.
- 2021: Sika AG acquires a smaller competitor, expanding its product portfolio and geographical reach.
- 2022: Several key players introduce sustainable, low-VOC repair products to comply with stricter regulations.
- 2023: Increased investment in R&D leading to the development of self-healing concrete technologies.
- 2024: Several M&A activities resulted in greater market consolidation
In-Depth Slab Repair Products Market Market Outlook
The Slab Repair Products market is poised for sustained growth over the forecast period (2025-2033), driven by technological advancements, infrastructural development, and the increasing focus on sustainable solutions. Strategic partnerships, expansion into new markets, and continuous innovation in materials science will be crucial for players to gain a competitive edge and capitalize on the growth opportunities. The market is expected to witness significant expansion, particularly in developing economies and within specialized applications.
Slab Repair Products Market Segmentation
-
1. Product Type
- 1.1. Polyurethane
- 1.2. Epoxy
- 1.3. Polyacrylate
- 1.4. Cementitious
- 1.5. Other Product Types
-
2. End-user Industry
- 2.1. Buildings
- 2.2. Roads, Pavements, and Tunnels
- 2.3. Railways
- 2.4. Dams
- 2.5. Other End-user Industries
Slab Repair Products Market Segmentation By Geography
-
1. Asia Pacific
- 1.1. China
- 1.2. India
- 1.3. Japan
- 1.4. South Korea
- 1.5. ASEAN Countries
- 1.6. Rest of Asia Pacific
-
2. North America
- 2.1. United States
- 2.2. Canada
- 2.3. Mexico
-
3. Europe
- 3.1. Germany
- 3.2. United Kingdom
- 3.3. Italy
- 3.4. France
- 3.5. Rest of Europe
-
4. South America
- 4.1. Brazil
- 4.2. Argentina
- 4.3. Rest of South America
-
5. Middle East and Africa
- 5.1. Saudi Arabia
- 5.2. South Africa
- 5.3. Rest of Middle East and Africa
Slab Repair Products Market REPORT HIGHLIGHTS
| Aspects | Details |
|---|---|
| Study Period | 2019-2033 |
| Base Year | 2024 |
| Estimated Year | 2025 |
| Forecast Period | 2025-2033 |
| Historical Period | 2019-2024 |
| Growth Rate | CAGR of > 6.00% from 2019-2033 |
| Segmentation |
|
Table of Contents
- 1. Introduction
- 1.1. Research Scope
- 1.2. Market Segmentation
- 1.3. Research Methodology
- 1.4. Definitions and Assumptions
- 2. Executive Summary
- 2.1. Introduction
- 3. Market Dynamics
- 3.1. Introduction
- 3.2. Market Drivers
- 3.2.1. ; Growth In Revitalization Of Public Infrastructure Projects; Other Driverss
- 3.3. Market Restrains
- 3.3.1. ; Lack of Market Penetration in Developing Economies; Impact of COVID-19 Pandemic
- 3.4. Market Trends
- 3.4.1. Polyurethane Products to Witness the Highest Growth Rate
- 4. Market Factor Analysis
- 4.1. Porters Five Forces
- 4.2. Supply/Value Chain
- 4.3. PESTEL analysis
- 4.4. Market Entropy
- 4.5. Patent/Trademark Analysis
- 5. Global Slab Repair Products Market Analysis, Insights and Forecast, 2019-2031
- 5.1. Market Analysis, Insights and Forecast - by Product Type
- 5.1.1. Polyurethane
- 5.1.2. Epoxy
- 5.1.3. Polyacrylate
- 5.1.4. Cementitious
- 5.1.5. Other Product Types
- 5.2. Market Analysis, Insights and Forecast - by End-user Industry
- 5.2.1. Buildings
- 5.2.2. Roads, Pavements, and Tunnels
- 5.2.3. Railways
- 5.2.4. Dams
- 5.2.5. Other End-user Industries
- 5.3. Market Analysis, Insights and Forecast - by Region
- 5.3.1. Asia Pacific
- 5.3.2. North America
- 5.3.3. Europe
- 5.3.4. South America
- 5.3.5. Middle East and Africa
- 5.1. Market Analysis, Insights and Forecast - by Product Type
- 6. Asia Pacific Slab Repair Products Market Analysis, Insights and Forecast, 2019-2031
- 6.1. Market Analysis, Insights and Forecast - by Product Type
- 6.1.1. Polyurethane
- 6.1.2. Epoxy
- 6.1.3. Polyacrylate
- 6.1.4. Cementitious
- 6.1.5. Other Product Types
- 6.2. Market Analysis, Insights and Forecast - by End-user Industry
- 6.2.1. Buildings
- 6.2.2. Roads, Pavements, and Tunnels
- 6.2.3. Railways
- 6.2.4. Dams
- 6.2.5. Other End-user Industries
- 6.1. Market Analysis, Insights and Forecast - by Product Type
- 7. North America Slab Repair Products Market Analysis, Insights and Forecast, 2019-2031
- 7.1. Market Analysis, Insights and Forecast - by Product Type
- 7.1.1. Polyurethane
- 7.1.2. Epoxy
- 7.1.3. Polyacrylate
- 7.1.4. Cementitious
- 7.1.5. Other Product Types
- 7.2. Market Analysis, Insights and Forecast - by End-user Industry
- 7.2.1. Buildings
- 7.2.2. Roads, Pavements, and Tunnels
- 7.2.3. Railways
- 7.2.4. Dams
- 7.2.5. Other End-user Industries
- 7.1. Market Analysis, Insights and Forecast - by Product Type
- 8. Europe Slab Repair Products Market Analysis, Insights and Forecast, 2019-2031
- 8.1. Market Analysis, Insights and Forecast - by Product Type
- 8.1.1. Polyurethane
- 8.1.2. Epoxy
- 8.1.3. Polyacrylate
- 8.1.4. Cementitious
- 8.1.5. Other Product Types
- 8.2. Market Analysis, Insights and Forecast - by End-user Industry
- 8.2.1. Buildings
- 8.2.2. Roads, Pavements, and Tunnels
- 8.2.3. Railways
- 8.2.4. Dams
- 8.2.5. Other End-user Industries
- 8.1. Market Analysis, Insights and Forecast - by Product Type
- 9. South America Slab Repair Products Market Analysis, Insights and Forecast, 2019-2031
- 9.1. Market Analysis, Insights and Forecast - by Product Type
- 9.1.1. Polyurethane
- 9.1.2. Epoxy
- 9.1.3. Polyacrylate
- 9.1.4. Cementitious
- 9.1.5. Other Product Types
- 9.2. Market Analysis, Insights and Forecast - by End-user Industry
- 9.2.1. Buildings
- 9.2.2. Roads, Pavements, and Tunnels
- 9.2.3. Railways
- 9.2.4. Dams
- 9.2.5. Other End-user Industries
- 9.1. Market Analysis, Insights and Forecast - by Product Type
- 10. Middle East and Africa Slab Repair Products Market Analysis, Insights and Forecast, 2019-2031
- 10.1. Market Analysis, Insights and Forecast - by Product Type
- 10.1.1. Polyurethane
- 10.1.2. Epoxy
- 10.1.3. Polyacrylate
- 10.1.4. Cementitious
- 10.1.5. Other Product Types
- 10.2. Market Analysis, Insights and Forecast - by End-user Industry
- 10.2.1. Buildings
- 10.2.2. Roads, Pavements, and Tunnels
- 10.2.3. Railways
- 10.2.4. Dams
- 10.2.5. Other End-user Industries
- 10.1. Market Analysis, Insights and Forecast - by Product Type
- 11. Asia Pacific Slab Repair Products Market Analysis, Insights and Forecast, 2019-2031
- 11.1. Market Analysis, Insights and Forecast - By Country/Sub-region
- 11.1.1 China
- 11.1.2 India
- 11.1.3 Japan
- 11.1.4 South Korea
- 11.1.5 ASEAN Countries
- 11.1.6 Rest of Asia Pacific
- 12. North America Slab Repair Products Market Analysis, Insights and Forecast, 2019-2031
- 12.1. Market Analysis, Insights and Forecast - By Country/Sub-region
- 12.1.1 United States
- 12.1.2 Canada
- 12.1.3 Mexico
- 13. Europe Slab Repair Products Market Analysis, Insights and Forecast, 2019-2031
- 13.1. Market Analysis, Insights and Forecast - By Country/Sub-region
- 13.1.1 Germany
- 13.1.2 United Kingdom
- 13.1.3 Italy
- 13.1.4 France
- 13.1.5 Rest of Europe
- 14. South America Slab Repair Products Market Analysis, Insights and Forecast, 2019-2031
- 14.1. Market Analysis, Insights and Forecast - By Country/Sub-region
- 14.1.1 Brazil
- 14.1.2 Argentina
- 14.1.3 Rest of South America
- 15. Middle East and Africa Slab Repair Products Market Analysis, Insights and Forecast, 2019-2031
- 15.1. Market Analysis, Insights and Forecast - By Country/Sub-region
- 15.1.1 Saudi Arabia
- 15.1.2 South Africa
- 15.1.3 Rest of Middle East and Africa
- 16. Competitive Analysis
- 16.1. Global Market Share Analysis 2024
- 16.2. Company Profiles
- 16.2.1 The Sherwin-Williams Company
- 16.2.1.1. Overview
- 16.2.1.2. Products
- 16.2.1.3. SWOT Analysis
- 16.2.1.4. Recent Developments
- 16.2.1.5. Financials (Based on Availability)
- 16.2.2 Western Specialty Contractors
- 16.2.2.1. Overview
- 16.2.2.2. Products
- 16.2.2.3. SWOT Analysis
- 16.2.2.4. Recent Developments
- 16.2.2.5. Financials (Based on Availability)
- 16.2.3 LafargeHolcim
- 16.2.3.1. Overview
- 16.2.3.2. Products
- 16.2.3.3. SWOT Analysis
- 16.2.3.4. Recent Developments
- 16.2.3.5. Financials (Based on Availability)
- 16.2.4 BASF SE
- 16.2.4.1. Overview
- 16.2.4.2. Products
- 16.2.4.3. SWOT Analysis
- 16.2.4.4. Recent Developments
- 16.2.4.5. Financials (Based on Availability)
- 16.2.5 SILPRO
- 16.2.5.1. Overview
- 16.2.5.2. Products
- 16.2.5.3. SWOT Analysis
- 16.2.5.4. Recent Developments
- 16.2.5.5. Financials (Based on Availability)
- 16.2.6 SABIC
- 16.2.6.1. Overview
- 16.2.6.2. Products
- 16.2.6.3. SWOT Analysis
- 16.2.6.4. Recent Developments
- 16.2.6.5. Financials (Based on Availability)
- 16.2.7 Sika AG
- 16.2.7.1. Overview
- 16.2.7.2. Products
- 16.2.7.3. SWOT Analysis
- 16.2.7.4. Recent Developments
- 16.2.7.5. Financials (Based on Availability)
- 16.2.8 Schomburg
- 16.2.8.1. Overview
- 16.2.8.2. Products
- 16.2.8.3. SWOT Analysis
- 16.2.8.4. Recent Developments
- 16.2.8.5. Financials (Based on Availability)
- 16.2.1 The Sherwin-Williams Company
List of Figures
- Figure 1: Global Slab Repair Products Market Revenue Breakdown (Million, %) by Region 2024 & 2032
- Figure 2: Global Slab Repair Products Market Volume Breakdown (K Unit, %) by Region 2024 & 2032
- Figure 3: Asia Pacific Slab Repair Products Market Revenue (Million), by Country 2024 & 2032
- Figure 4: Asia Pacific Slab Repair Products Market Volume (K Unit), by Country 2024 & 2032
- Figure 5: Asia Pacific Slab Repair Products Market Revenue Share (%), by Country 2024 & 2032
- Figure 6: Asia Pacific Slab Repair Products Market Volume Share (%), by Country 2024 & 2032
- Figure 7: North America Slab Repair Products Market Revenue (Million), by Country 2024 & 2032
- Figure 8: North America Slab Repair Products Market Volume (K Unit), by Country 2024 & 2032
- Figure 9: North America Slab Repair Products Market Revenue Share (%), by Country 2024 & 2032
- Figure 10: North America Slab Repair Products Market Volume Share (%), by Country 2024 & 2032
- Figure 11: Europe Slab Repair Products Market Revenue (Million), by Country 2024 & 2032
- Figure 12: Europe Slab Repair Products Market Volume (K Unit), by Country 2024 & 2032
- Figure 13: Europe Slab Repair Products Market Revenue Share (%), by Country 2024 & 2032
- Figure 14: Europe Slab Repair Products Market Volume Share (%), by Country 2024 & 2032
- Figure 15: South America Slab Repair Products Market Revenue (Million), by Country 2024 & 2032
- Figure 16: South America Slab Repair Products Market Volume (K Unit), by Country 2024 & 2032
- Figure 17: South America Slab Repair Products Market Revenue Share (%), by Country 2024 & 2032
- Figure 18: South America Slab Repair Products Market Volume Share (%), by Country 2024 & 2032
- Figure 19: Middle East and Africa Slab Repair Products Market Revenue (Million), by Country 2024 & 2032
- Figure 20: Middle East and Africa Slab Repair Products Market Volume (K Unit), by Country 2024 & 2032
- Figure 21: Middle East and Africa Slab Repair Products Market Revenue Share (%), by Country 2024 & 2032
- Figure 22: Middle East and Africa Slab Repair Products Market Volume Share (%), by Country 2024 & 2032
- Figure 23: Asia Pacific Slab Repair Products Market Revenue (Million), by Product Type 2024 & 2032
- Figure 24: Asia Pacific Slab Repair Products Market Volume (K Unit), by Product Type 2024 & 2032
- Figure 25: Asia Pacific Slab Repair Products Market Revenue Share (%), by Product Type 2024 & 2032
- Figure 26: Asia Pacific Slab Repair Products Market Volume Share (%), by Product Type 2024 & 2032
- Figure 27: Asia Pacific Slab Repair Products Market Revenue (Million), by End-user Industry 2024 & 2032
- Figure 28: Asia Pacific Slab Repair Products Market Volume (K Unit), by End-user Industry 2024 & 2032
- Figure 29: Asia Pacific Slab Repair Products Market Revenue Share (%), by End-user Industry 2024 & 2032
- Figure 30: Asia Pacific Slab Repair Products Market Volume Share (%), by End-user Industry 2024 & 2032
- Figure 31: Asia Pacific Slab Repair Products Market Revenue (Million), by Country 2024 & 2032
- Figure 32: Asia Pacific Slab Repair Products Market Volume (K Unit), by Country 2024 & 2032
- Figure 33: Asia Pacific Slab Repair Products Market Revenue Share (%), by Country 2024 & 2032
- Figure 34: Asia Pacific Slab Repair Products Market Volume Share (%), by Country 2024 & 2032
- Figure 35: North America Slab Repair Products Market Revenue (Million), by Product Type 2024 & 2032
- Figure 36: North America Slab Repair Products Market Volume (K Unit), by Product Type 2024 & 2032
- Figure 37: North America Slab Repair Products Market Revenue Share (%), by Product Type 2024 & 2032
- Figure 38: North America Slab Repair Products Market Volume Share (%), by Product Type 2024 & 2032
- Figure 39: North America Slab Repair Products Market Revenue (Million), by End-user Industry 2024 & 2032
- Figure 40: North America Slab Repair Products Market Volume (K Unit), by End-user Industry 2024 & 2032
- Figure 41: North America Slab Repair Products Market Revenue Share (%), by End-user Industry 2024 & 2032
- Figure 42: North America Slab Repair Products Market Volume Share (%), by End-user Industry 2024 & 2032
- Figure 43: North America Slab Repair Products Market Revenue (Million), by Country 2024 & 2032
- Figure 44: North America Slab Repair Products Market Volume (K Unit), by Country 2024 & 2032
- Figure 45: North America Slab Repair Products Market Revenue Share (%), by Country 2024 & 2032
- Figure 46: North America Slab Repair Products Market Volume Share (%), by Country 2024 & 2032
- Figure 47: Europe Slab Repair Products Market Revenue (Million), by Product Type 2024 & 2032
- Figure 48: Europe Slab Repair Products Market Volume (K Unit), by Product Type 2024 & 2032
- Figure 49: Europe Slab Repair Products Market Revenue Share (%), by Product Type 2024 & 2032
- Figure 50: Europe Slab Repair Products Market Volume Share (%), by Product Type 2024 & 2032
- Figure 51: Europe Slab Repair Products Market Revenue (Million), by End-user Industry 2024 & 2032
- Figure 52: Europe Slab Repair Products Market Volume (K Unit), by End-user Industry 2024 & 2032
- Figure 53: Europe Slab Repair Products Market Revenue Share (%), by End-user Industry 2024 & 2032
- Figure 54: Europe Slab Repair Products Market Volume Share (%), by End-user Industry 2024 & 2032
- Figure 55: Europe Slab Repair Products Market Revenue (Million), by Country 2024 & 2032
- Figure 56: Europe Slab Repair Products Market Volume (K Unit), by Country 2024 & 2032
- Figure 57: Europe Slab Repair Products Market Revenue Share (%), by Country 2024 & 2032
- Figure 58: Europe Slab Repair Products Market Volume Share (%), by Country 2024 & 2032
- Figure 59: South America Slab Repair Products Market Revenue (Million), by Product Type 2024 & 2032
- Figure 60: South America Slab Repair Products Market Volume (K Unit), by Product Type 2024 & 2032
- Figure 61: South America Slab Repair Products Market Revenue Share (%), by Product Type 2024 & 2032
- Figure 62: South America Slab Repair Products Market Volume Share (%), by Product Type 2024 & 2032
- Figure 63: South America Slab Repair Products Market Revenue (Million), by End-user Industry 2024 & 2032
- Figure 64: South America Slab Repair Products Market Volume (K Unit), by End-user Industry 2024 & 2032
- Figure 65: South America Slab Repair Products Market Revenue Share (%), by End-user Industry 2024 & 2032
- Figure 66: South America Slab Repair Products Market Volume Share (%), by End-user Industry 2024 & 2032
- Figure 67: South America Slab Repair Products Market Revenue (Million), by Country 2024 & 2032
- Figure 68: South America Slab Repair Products Market Volume (K Unit), by Country 2024 & 2032
- Figure 69: South America Slab Repair Products Market Revenue Share (%), by Country 2024 & 2032
- Figure 70: South America Slab Repair Products Market Volume Share (%), by Country 2024 & 2032
- Figure 71: Middle East and Africa Slab Repair Products Market Revenue (Million), by Product Type 2024 & 2032
- Figure 72: Middle East and Africa Slab Repair Products Market Volume (K Unit), by Product Type 2024 & 2032
- Figure 73: Middle East and Africa Slab Repair Products Market Revenue Share (%), by Product Type 2024 & 2032
- Figure 74: Middle East and Africa Slab Repair Products Market Volume Share (%), by Product Type 2024 & 2032
- Figure 75: Middle East and Africa Slab Repair Products Market Revenue (Million), by End-user Industry 2024 & 2032
- Figure 76: Middle East and Africa Slab Repair Products Market Volume (K Unit), by End-user Industry 2024 & 2032
- Figure 77: Middle East and Africa Slab Repair Products Market Revenue Share (%), by End-user Industry 2024 & 2032
- Figure 78: Middle East and Africa Slab Repair Products Market Volume Share (%), by End-user Industry 2024 & 2032
- Figure 79: Middle East and Africa Slab Repair Products Market Revenue (Million), by Country 2024 & 2032
- Figure 80: Middle East and Africa Slab Repair Products Market Volume (K Unit), by Country 2024 & 2032
- Figure 81: Middle East and Africa Slab Repair Products Market Revenue Share (%), by Country 2024 & 2032
- Figure 82: Middle East and Africa Slab Repair Products Market Volume Share (%), by Country 2024 & 2032
List of Tables
- Table 1: Global Slab Repair Products Market Revenue Million Forecast, by Region 2019 & 2032
- Table 2: Global Slab Repair Products Market Volume K Unit Forecast, by Region 2019 & 2032
- Table 3: Global Slab Repair Products Market Revenue Million Forecast, by Product Type 2019 & 2032
- Table 4: Global Slab Repair Products Market Volume K Unit Forecast, by Product Type 2019 & 2032
- Table 5: Global Slab Repair Products Market Revenue Million Forecast, by End-user Industry 2019 & 2032
- Table 6: Global Slab Repair Products Market Volume K Unit Forecast, by End-user Industry 2019 & 2032
- Table 7: Global Slab Repair Products Market Revenue Million Forecast, by Region 2019 & 2032
- Table 8: Global Slab Repair Products Market Volume K Unit Forecast, by Region 2019 & 2032
- Table 9: Global Slab Repair Products Market Revenue Million Forecast, by Country 2019 & 2032
- Table 10: Global Slab Repair Products Market Volume K Unit Forecast, by Country 2019 & 2032
- Table 11: China Slab Repair Products Market Revenue (Million) Forecast, by Application 2019 & 2032
- Table 12: China Slab Repair Products Market Volume (K Unit) Forecast, by Application 2019 & 2032
- Table 13: India Slab Repair Products Market Revenue (Million) Forecast, by Application 2019 & 2032
- Table 14: India Slab Repair Products Market Volume (K Unit) Forecast, by Application 2019 & 2032
- Table 15: Japan Slab Repair Products Market Revenue (Million) Forecast, by Application 2019 & 2032
- Table 16: Japan Slab Repair Products Market Volume (K Unit) Forecast, by Application 2019 & 2032
- Table 17: South Korea Slab Repair Products Market Revenue (Million) Forecast, by Application 2019 & 2032
- Table 18: South Korea Slab Repair Products Market Volume (K Unit) Forecast, by Application 2019 & 2032
- Table 19: ASEAN Countries Slab Repair Products Market Revenue (Million) Forecast, by Application 2019 & 2032
- Table 20: ASEAN Countries Slab Repair Products Market Volume (K Unit) Forecast, by Application 2019 & 2032
- Table 21: Rest of Asia Pacific Slab Repair Products Market Revenue (Million) Forecast, by Application 2019 & 2032
- Table 22: Rest of Asia Pacific Slab Repair Products Market Volume (K Unit) Forecast, by Application 2019 & 2032
- Table 23: Global Slab Repair Products Market Revenue Million Forecast, by Country 2019 & 2032
- Table 24: Global Slab Repair Products Market Volume K Unit Forecast, by Country 2019 & 2032
- Table 25: United States Slab Repair Products Market Revenue (Million) Forecast, by Application 2019 & 2032
- Table 26: United States Slab Repair Products Market Volume (K Unit) Forecast, by Application 2019 & 2032
- Table 27: Canada Slab Repair Products Market Revenue (Million) Forecast, by Application 2019 & 2032
- Table 28: Canada Slab Repair Products Market Volume (K Unit) Forecast, by Application 2019 & 2032
- Table 29: Mexico Slab Repair Products Market Revenue (Million) Forecast, by Application 2019 & 2032
- Table 30: Mexico Slab Repair Products Market Volume (K Unit) Forecast, by Application 2019 & 2032
- Table 31: Global Slab Repair Products Market Revenue Million Forecast, by Country 2019 & 2032
- Table 32: Global Slab Repair Products Market Volume K Unit Forecast, by Country 2019 & 2032
- Table 33: Germany Slab Repair Products Market Revenue (Million) Forecast, by Application 2019 & 2032
- Table 34: Germany Slab Repair Products Market Volume (K Unit) Forecast, by Application 2019 & 2032
- Table 35: United Kingdom Slab Repair Products Market Revenue (Million) Forecast, by Application 2019 & 2032
- Table 36: United Kingdom Slab Repair Products Market Volume (K Unit) Forecast, by Application 2019 & 2032
- Table 37: Italy Slab Repair Products Market Revenue (Million) Forecast, by Application 2019 & 2032
- Table 38: Italy Slab Repair Products Market Volume (K Unit) Forecast, by Application 2019 & 2032
- Table 39: France Slab Repair Products Market Revenue (Million) Forecast, by Application 2019 & 2032
- Table 40: France Slab Repair Products Market Volume (K Unit) Forecast, by Application 2019 & 2032
- Table 41: Rest of Europe Slab Repair Products Market Revenue (Million) Forecast, by Application 2019 & 2032
- Table 42: Rest of Europe Slab Repair Products Market Volume (K Unit) Forecast, by Application 2019 & 2032
- Table 43: Global Slab Repair Products Market Revenue Million Forecast, by Country 2019 & 2032
- Table 44: Global Slab Repair Products Market Volume K Unit Forecast, by Country 2019 & 2032
- Table 45: Brazil Slab Repair Products Market Revenue (Million) Forecast, by Application 2019 & 2032
- Table 46: Brazil Slab Repair Products Market Volume (K Unit) Forecast, by Application 2019 & 2032
- Table 47: Argentina Slab Repair Products Market Revenue (Million) Forecast, by Application 2019 & 2032
- Table 48: Argentina Slab Repair Products Market Volume (K Unit) Forecast, by Application 2019 & 2032
- Table 49: Rest of South America Slab Repair Products Market Revenue (Million) Forecast, by Application 2019 & 2032
- Table 50: Rest of South America Slab Repair Products Market Volume (K Unit) Forecast, by Application 2019 & 2032
- Table 51: Global Slab Repair Products Market Revenue Million Forecast, by Country 2019 & 2032
- Table 52: Global Slab Repair Products Market Volume K Unit Forecast, by Country 2019 & 2032
- Table 53: Saudi Arabia Slab Repair Products Market Revenue (Million) Forecast, by Application 2019 & 2032
- Table 54: Saudi Arabia Slab Repair Products Market Volume (K Unit) Forecast, by Application 2019 & 2032
- Table 55: South Africa Slab Repair Products Market Revenue (Million) Forecast, by Application 2019 & 2032
- Table 56: South Africa Slab Repair Products Market Volume (K Unit) Forecast, by Application 2019 & 2032
- Table 57: Rest of Middle East and Africa Slab Repair Products Market Revenue (Million) Forecast, by Application 2019 & 2032
- Table 58: Rest of Middle East and Africa Slab Repair Products Market Volume (K Unit) Forecast, by Application 2019 & 2032
- Table 59: Global Slab Repair Products Market Revenue Million Forecast, by Product Type 2019 & 2032
- Table 60: Global Slab Repair Products Market Volume K Unit Forecast, by Product Type 2019 & 2032
- Table 61: Global Slab Repair Products Market Revenue Million Forecast, by End-user Industry 2019 & 2032
- Table 62: Global Slab Repair Products Market Volume K Unit Forecast, by End-user Industry 2019 & 2032
- Table 63: Global Slab Repair Products Market Revenue Million Forecast, by Country 2019 & 2032
- Table 64: Global Slab Repair Products Market Volume K Unit Forecast, by Country 2019 & 2032
- Table 65: China Slab Repair Products Market Revenue (Million) Forecast, by Application 2019 & 2032
- Table 66: China Slab Repair Products Market Volume (K Unit) Forecast, by Application 2019 & 2032
- Table 67: India Slab Repair Products Market Revenue (Million) Forecast, by Application 2019 & 2032
- Table 68: India Slab Repair Products Market Volume (K Unit) Forecast, by Application 2019 & 2032
- Table 69: Japan Slab Repair Products Market Revenue (Million) Forecast, by Application 2019 & 2032
- Table 70: Japan Slab Repair Products Market Volume (K Unit) Forecast, by Application 2019 & 2032
- Table 71: South Korea Slab Repair Products Market Revenue (Million) Forecast, by Application 2019 & 2032
- Table 72: South Korea Slab Repair Products Market Volume (K Unit) Forecast, by Application 2019 & 2032
- Table 73: ASEAN Countries Slab Repair Products Market Revenue (Million) Forecast, by Application 2019 & 2032
- Table 74: ASEAN Countries Slab Repair Products Market Volume (K Unit) Forecast, by Application 2019 & 2032
- Table 75: Rest of Asia Pacific Slab Repair Products Market Revenue (Million) Forecast, by Application 2019 & 2032
- Table 76: Rest of Asia Pacific Slab Repair Products Market Volume (K Unit) Forecast, by Application 2019 & 2032
- Table 77: Global Slab Repair Products Market Revenue Million Forecast, by Product Type 2019 & 2032
- Table 78: Global Slab Repair Products Market Volume K Unit Forecast, by Product Type 2019 & 2032
- Table 79: Global Slab Repair Products Market Revenue Million Forecast, by End-user Industry 2019 & 2032
- Table 80: Global Slab Repair Products Market Volume K Unit Forecast, by End-user Industry 2019 & 2032
- Table 81: Global Slab Repair Products Market Revenue Million Forecast, by Country 2019 & 2032
- Table 82: Global Slab Repair Products Market Volume K Unit Forecast, by Country 2019 & 2032
- Table 83: United States Slab Repair Products Market Revenue (Million) Forecast, by Application 2019 & 2032
- Table 84: United States Slab Repair Products Market Volume (K Unit) Forecast, by Application 2019 & 2032
- Table 85: Canada Slab Repair Products Market Revenue (Million) Forecast, by Application 2019 & 2032
- Table 86: Canada Slab Repair Products Market Volume (K Unit) Forecast, by Application 2019 & 2032
- Table 87: Mexico Slab Repair Products Market Revenue (Million) Forecast, by Application 2019 & 2032
- Table 88: Mexico Slab Repair Products Market Volume (K Unit) Forecast, by Application 2019 & 2032
- Table 89: Global Slab Repair Products Market Revenue Million Forecast, by Product Type 2019 & 2032
- Table 90: Global Slab Repair Products Market Volume K Unit Forecast, by Product Type 2019 & 2032
- Table 91: Global Slab Repair Products Market Revenue Million Forecast, by End-user Industry 2019 & 2032
- Table 92: Global Slab Repair Products Market Volume K Unit Forecast, by End-user Industry 2019 & 2032
- Table 93: Global Slab Repair Products Market Revenue Million Forecast, by Country 2019 & 2032
- Table 94: Global Slab Repair Products Market Volume K Unit Forecast, by Country 2019 & 2032
- Table 95: Germany Slab Repair Products Market Revenue (Million) Forecast, by Application 2019 & 2032
- Table 96: Germany Slab Repair Products Market Volume (K Unit) Forecast, by Application 2019 & 2032
- Table 97: United Kingdom Slab Repair Products Market Revenue (Million) Forecast, by Application 2019 & 2032
- Table 98: United Kingdom Slab Repair Products Market Volume (K Unit) Forecast, by Application 2019 & 2032
- Table 99: Italy Slab Repair Products Market Revenue (Million) Forecast, by Application 2019 & 2032
- Table 100: Italy Slab Repair Products Market Volume (K Unit) Forecast, by Application 2019 & 2032
- Table 101: France Slab Repair Products Market Revenue (Million) Forecast, by Application 2019 & 2032
- Table 102: France Slab Repair Products Market Volume (K Unit) Forecast, by Application 2019 & 2032
- Table 103: Rest of Europe Slab Repair Products Market Revenue (Million) Forecast, by Application 2019 & 2032
- Table 104: Rest of Europe Slab Repair Products Market Volume (K Unit) Forecast, by Application 2019 & 2032
- Table 105: Global Slab Repair Products Market Revenue Million Forecast, by Product Type 2019 & 2032
- Table 106: Global Slab Repair Products Market Volume K Unit Forecast, by Product Type 2019 & 2032
- Table 107: Global Slab Repair Products Market Revenue Million Forecast, by End-user Industry 2019 & 2032
- Table 108: Global Slab Repair Products Market Volume K Unit Forecast, by End-user Industry 2019 & 2032
- Table 109: Global Slab Repair Products Market Revenue Million Forecast, by Country 2019 & 2032
- Table 110: Global Slab Repair Products Market Volume K Unit Forecast, by Country 2019 & 2032
- Table 111: Brazil Slab Repair Products Market Revenue (Million) Forecast, by Application 2019 & 2032
- Table 112: Brazil Slab Repair Products Market Volume (K Unit) Forecast, by Application 2019 & 2032
- Table 113: Argentina Slab Repair Products Market Revenue (Million) Forecast, by Application 2019 & 2032
- Table 114: Argentina Slab Repair Products Market Volume (K Unit) Forecast, by Application 2019 & 2032
- Table 115: Rest of South America Slab Repair Products Market Revenue (Million) Forecast, by Application 2019 & 2032
- Table 116: Rest of South America Slab Repair Products Market Volume (K Unit) Forecast, by Application 2019 & 2032
- Table 117: Global Slab Repair Products Market Revenue Million Forecast, by Product Type 2019 & 2032
- Table 118: Global Slab Repair Products Market Volume K Unit Forecast, by Product Type 2019 & 2032
- Table 119: Global Slab Repair Products Market Revenue Million Forecast, by End-user Industry 2019 & 2032
- Table 120: Global Slab Repair Products Market Volume K Unit Forecast, by End-user Industry 2019 & 2032
- Table 121: Global Slab Repair Products Market Revenue Million Forecast, by Country 2019 & 2032
- Table 122: Global Slab Repair Products Market Volume K Unit Forecast, by Country 2019 & 2032
- Table 123: Saudi Arabia Slab Repair Products Market Revenue (Million) Forecast, by Application 2019 & 2032
- Table 124: Saudi Arabia Slab Repair Products Market Volume (K Unit) Forecast, by Application 2019 & 2032
- Table 125: South Africa Slab Repair Products Market Revenue (Million) Forecast, by Application 2019 & 2032
- Table 126: South Africa Slab Repair Products Market Volume (K Unit) Forecast, by Application 2019 & 2032
- Table 127: Rest of Middle East and Africa Slab Repair Products Market Revenue (Million) Forecast, by Application 2019 & 2032
- Table 128: Rest of Middle East and Africa Slab Repair Products Market Volume (K Unit) Forecast, by Application 2019 & 2032
Frequently Asked Questions
1. What is the projected Compound Annual Growth Rate (CAGR) of the Slab Repair Products Market?
The projected CAGR is approximately > 6.00%.
2. Which companies are prominent players in the Slab Repair Products Market?
Key companies in the market include The Sherwin-Williams Company, Western Specialty Contractors, LafargeHolcim, BASF SE, SILPRO, SABIC, Sika AG, Schomburg.
3. What are the main segments of the Slab Repair Products Market?
The market segments include Product Type, End-user Industry.
4. Can you provide details about the market size?
The market size is estimated to be USD XX Million as of 2022.
5. What are some drivers contributing to market growth?
; Growth In Revitalization Of Public Infrastructure Projects; Other Driverss.
6. What are the notable trends driving market growth?
Polyurethane Products to Witness the Highest Growth Rate.
7. Are there any restraints impacting market growth?
; Lack of Market Penetration in Developing Economies; Impact of COVID-19 Pandemic.
8. Can you provide examples of recent developments in the market?
N/A
9. What pricing options are available for accessing the report?
Pricing options include single-user, multi-user, and enterprise licenses priced at USD 4750, USD 5250, and USD 8750 respectively.
10. Is the market size provided in terms of value or volume?
The market size is provided in terms of value, measured in Million and volume, measured in K Unit.
11. Are there any specific market keywords associated with the report?
Yes, the market keyword associated with the report is "Slab Repair Products Market," which aids in identifying and referencing the specific market segment covered.
12. How do I determine which pricing option suits my needs best?
The pricing options vary based on user requirements and access needs. Individual users may opt for single-user licenses, while businesses requiring broader access may choose multi-user or enterprise licenses for cost-effective access to the report.
13. Are there any additional resources or data provided in the Slab Repair Products Market report?
While the report offers comprehensive insights, it's advisable to review the specific contents or supplementary materials provided to ascertain if additional resources or data are available.
14. How can I stay updated on further developments or reports in the Slab Repair Products Market?
To stay informed about further developments, trends, and reports in the Slab Repair Products Market, consider subscribing to industry newsletters, following relevant companies and organizations, or regularly checking reputable industry news sources and publications.
Methodology
Step 1 - Identification of Relevant Samples Size from Population Database


Step 2 - Approaches for Defining Global Market Size (Value, Volume* & Price*)

Note*: In applicable scenarios
Step 3 - Data Sources
Primary Research
- Web Analytics
- Survey Reports
- Research Institute
- Latest Research Reports
- Opinion Leaders
Secondary Research
- Annual Reports
- White Paper
- Latest Press Release
- Industry Association
- Paid Database
- Investor Presentations

Step 4 - Data Triangulation
Involves using different sources of information in order to increase the validity of a study
These sources are likely to be stakeholders in a program - participants, other researchers, program staff, other community members, and so on.
Then we put all data in single framework & apply various statistical tools to find out the dynamic on the market.
During the analysis stage, feedback from the stakeholder groups would be compared to determine areas of agreement as well as areas of divergence


